
Section1: Commodity Update:
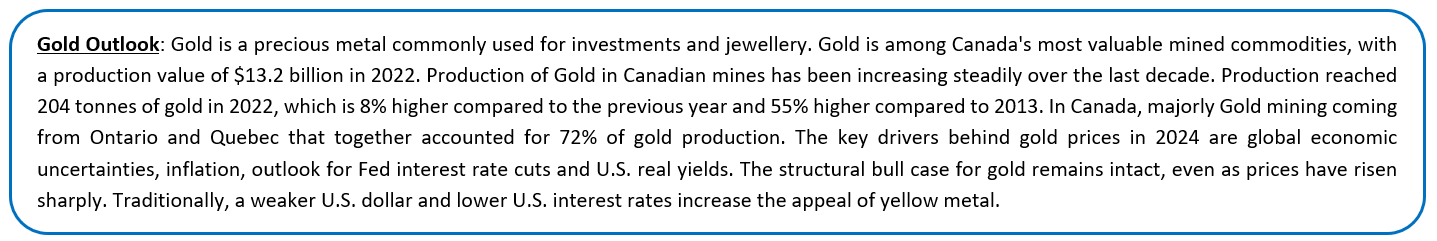
Data Source: Government of Canada
Section 2: Company Overview and Fundamental Insights:
2.1 Company Overview:
Kinross Gold (TSX: K) is a Canada-based senior gold producer. The company had 30 million ounces of proven and probable gold reserves and 59 million ounces of silver reserves at the end of 2020. It operates mines and focuses its greenfield and brownfield exploration in the Americas, West Africa, and Russia. Kalkine’s Gold Report covers the Investment Highlights, Key Financial Metrics, Risks, Technical Analysis along with the Valuation, Target Price, and Recommendation on the stock.
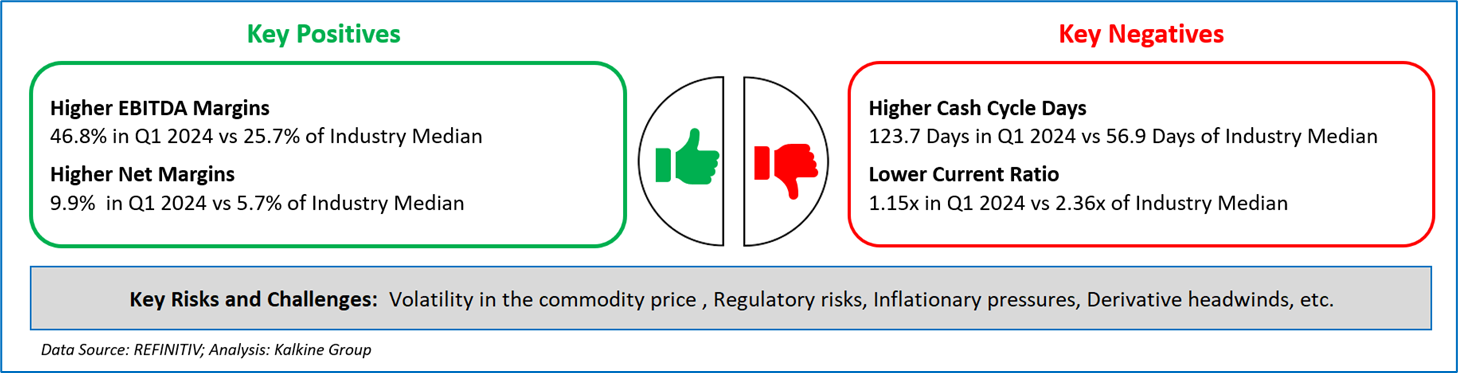
2.2 The Key Positives, Negatives, Investment Highlights and Risks
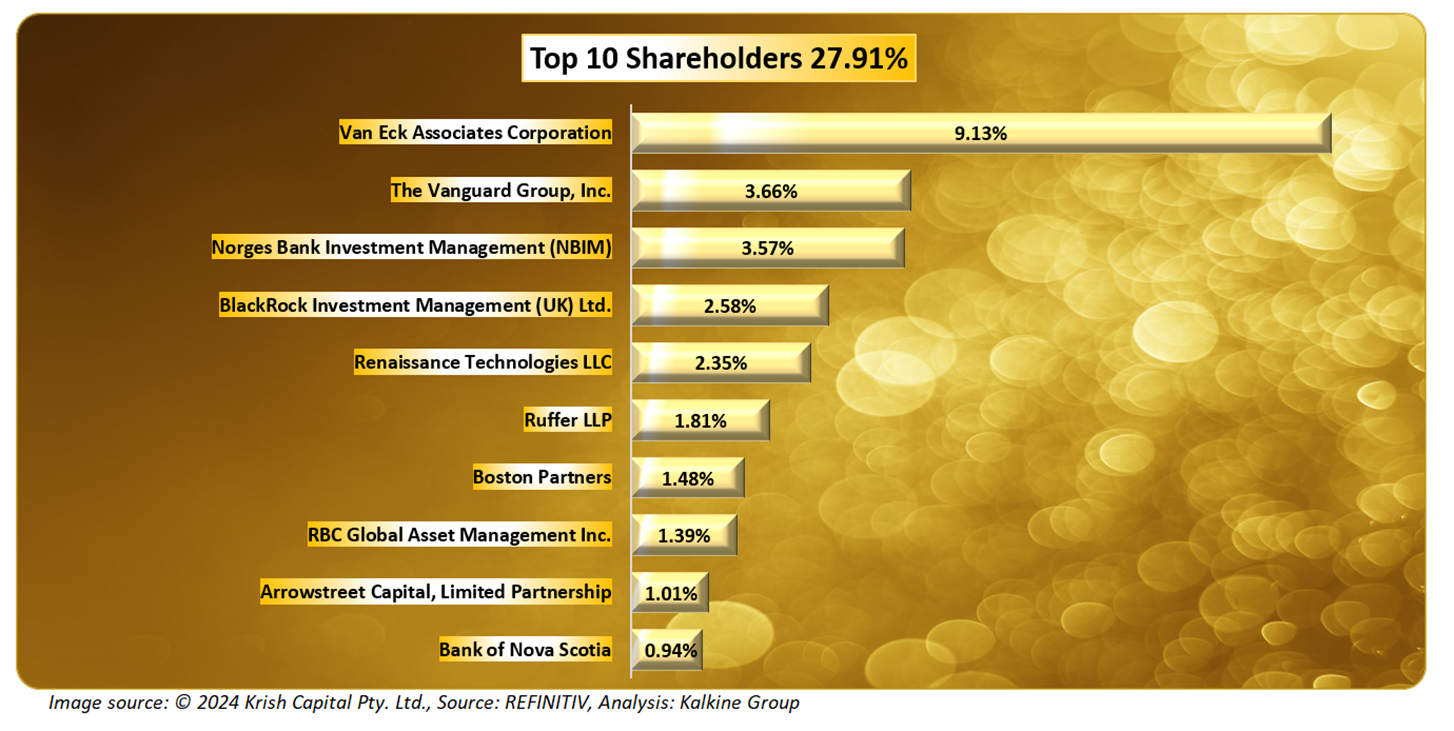
2.3 Top 10 Shareholders:
The top 10 shareholders together form ~27.91% of the total shareholding. Van Eck Associates Corporation and The Vanguard Group, Inc. hold a maximum stake in the company at ~9.13% and ~3.66%, respectively.
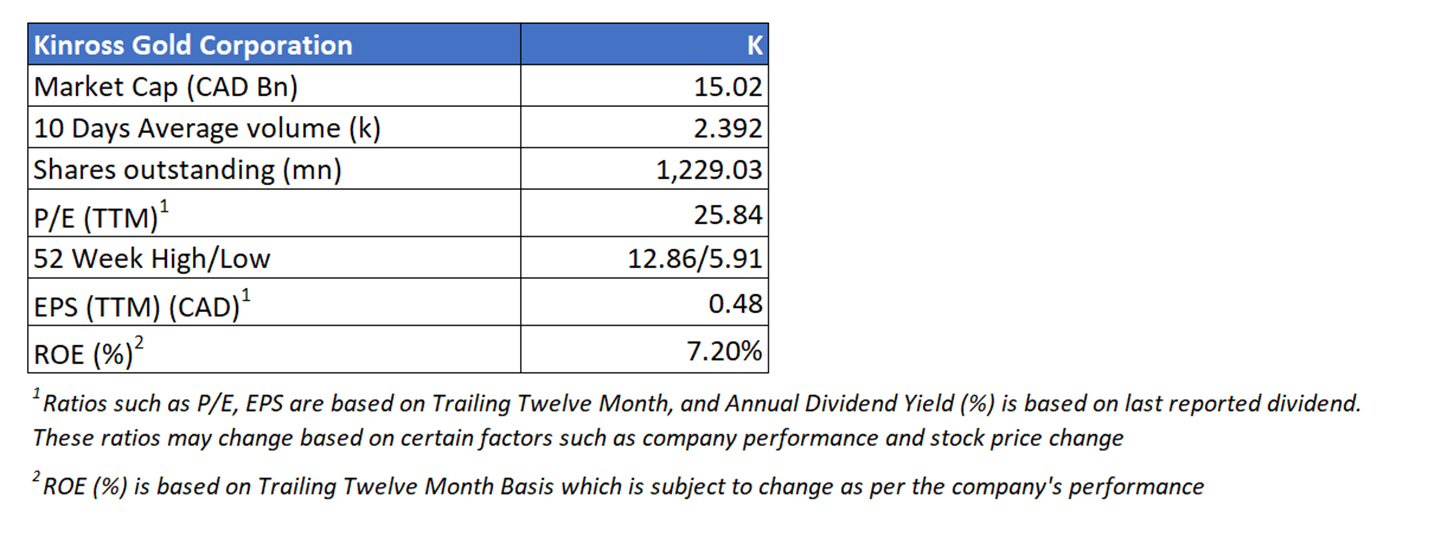
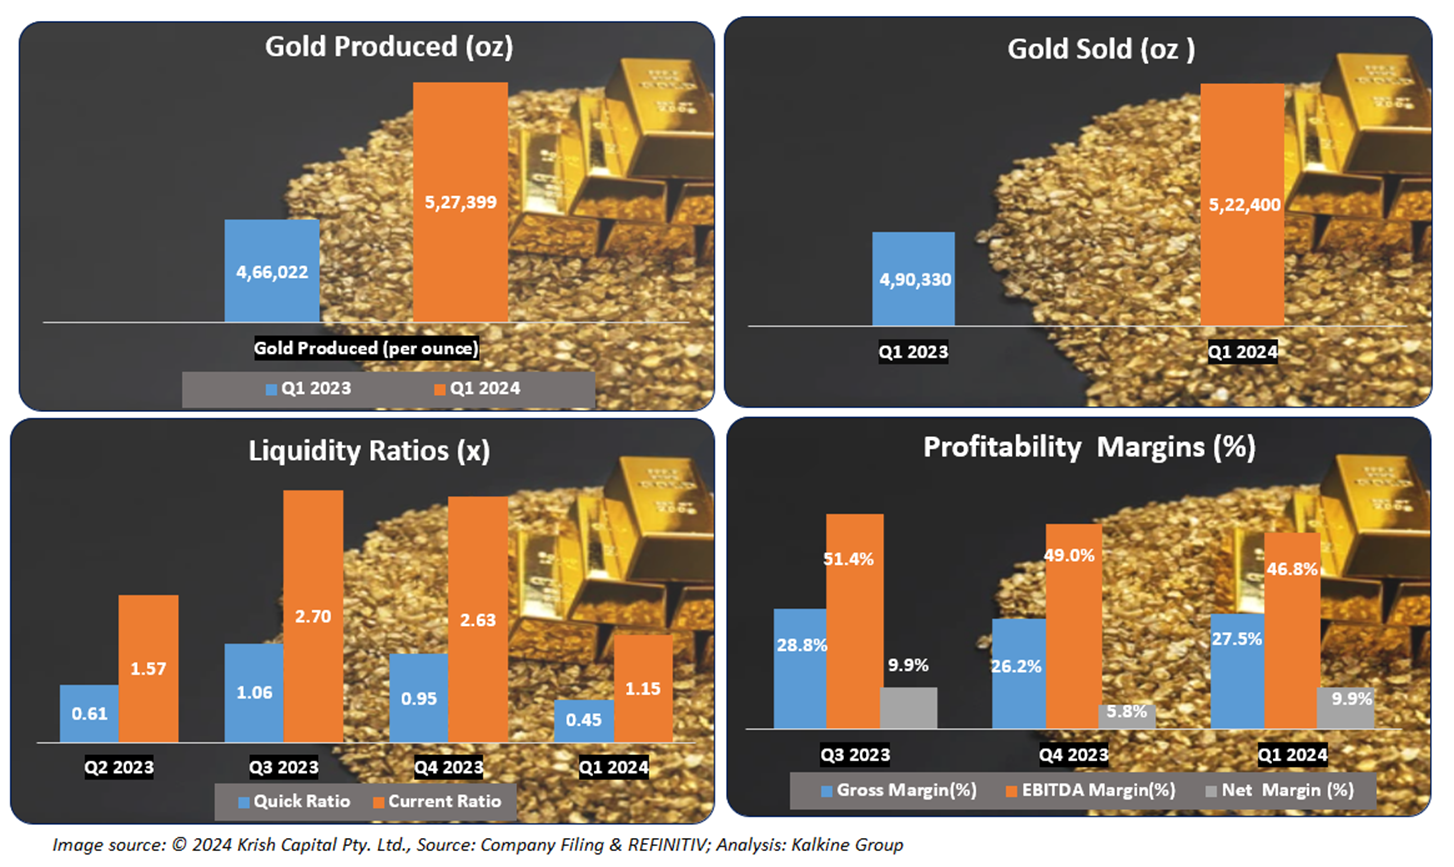
2.4 Key Metrics:
The firm has witnessed an improvement in its Gold Produced and Gold Sold during the quarter. Further, the group is keeping an eye on its Liquidity Ratios by keeping Quick and Current Ratio in check, which is a significant positive that displays the company’s strength and adaptability.
Section 3: Business Updates and Financial Highlights
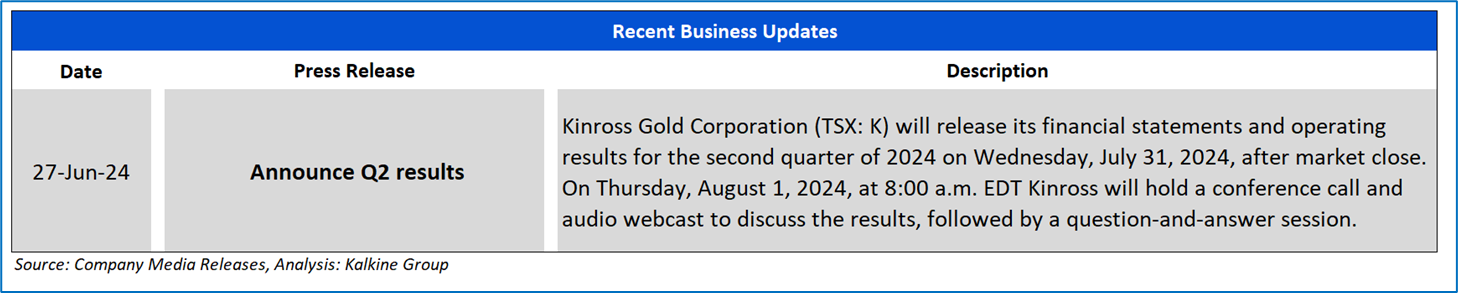
3.1 Recent Updates: The below picture gives an overview of its recent activities.
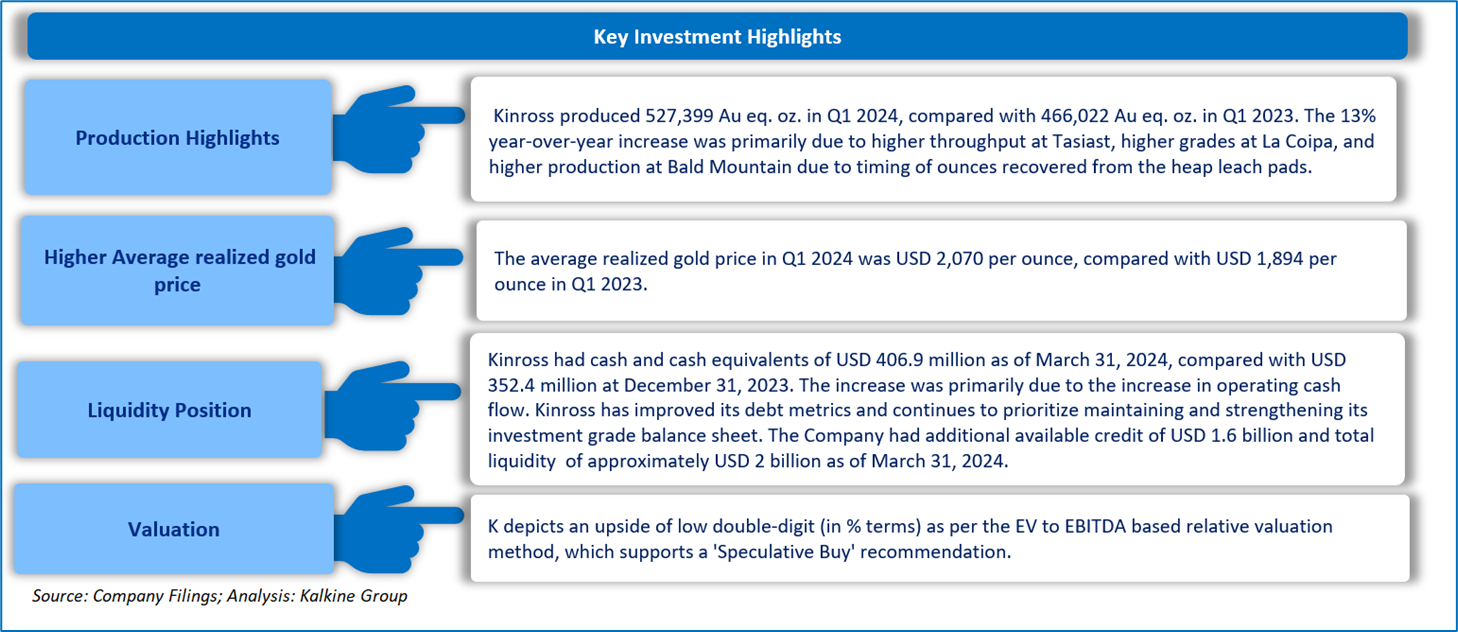
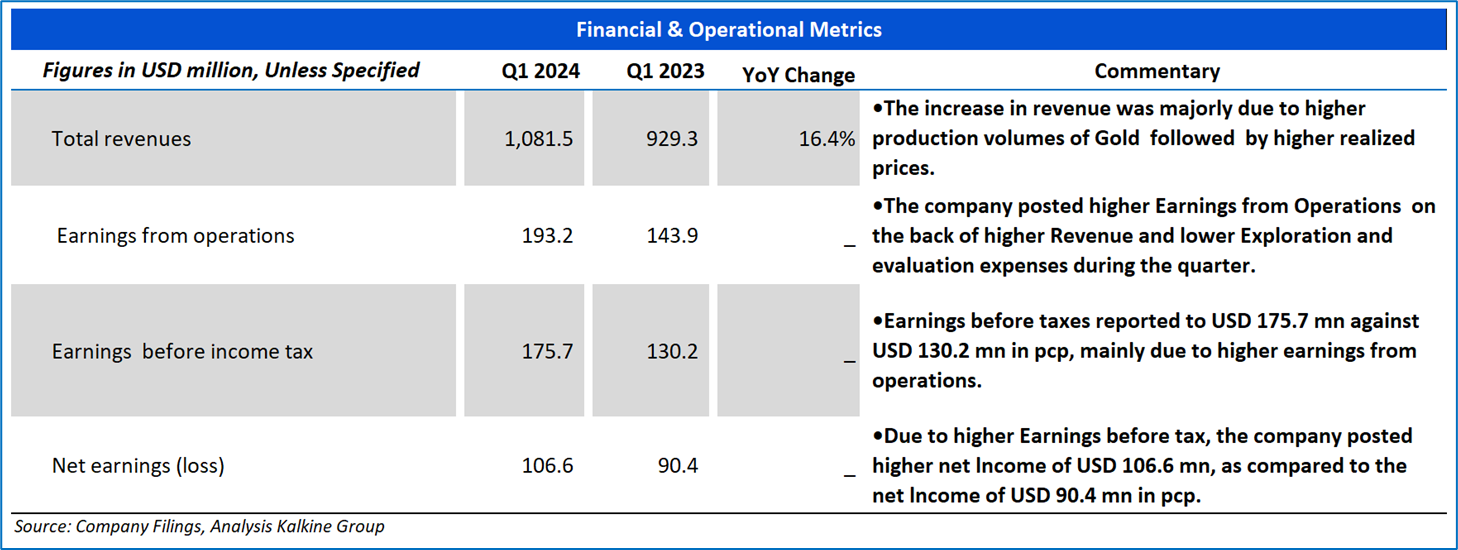
3.2 Insights on Q1 2024 Financial Performance:
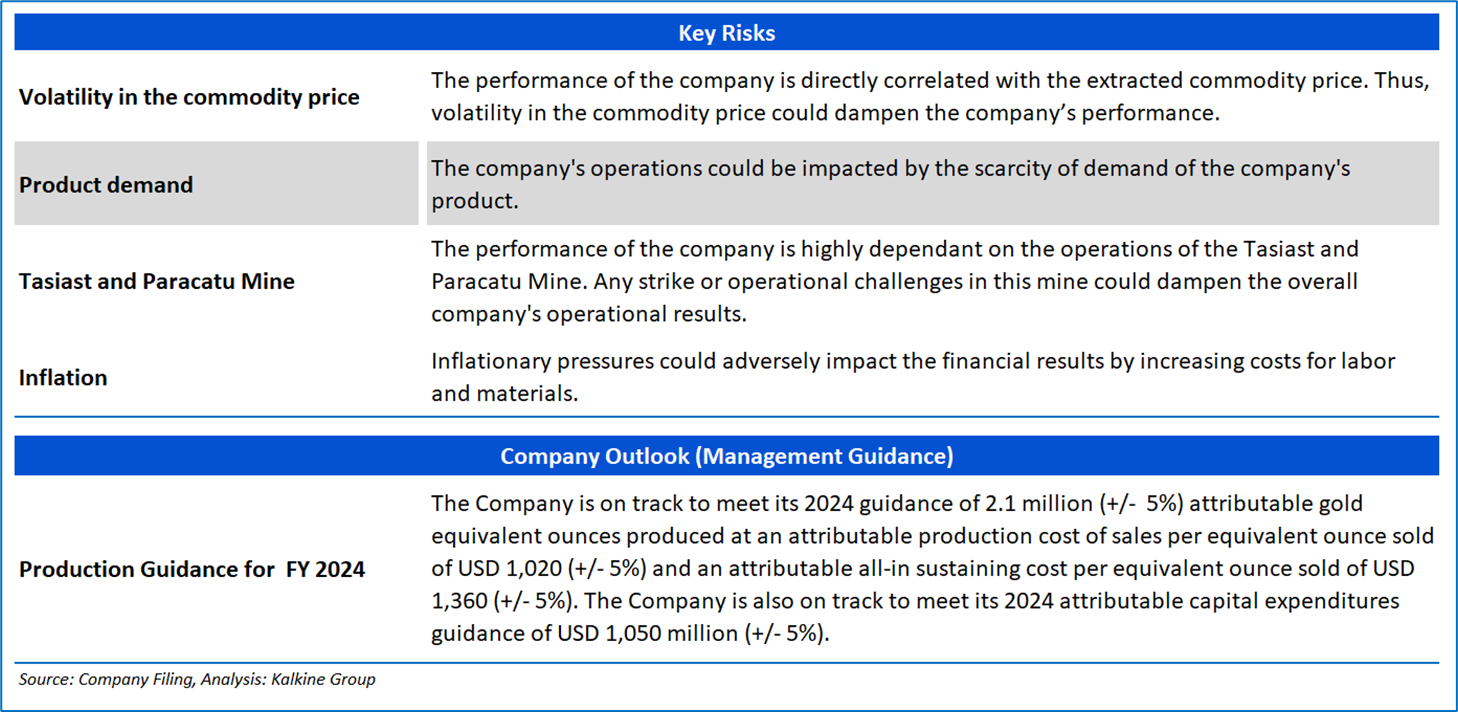
Section 4: Key Risks and Company Outlook
Section 4: Stock Recommendation Summary:
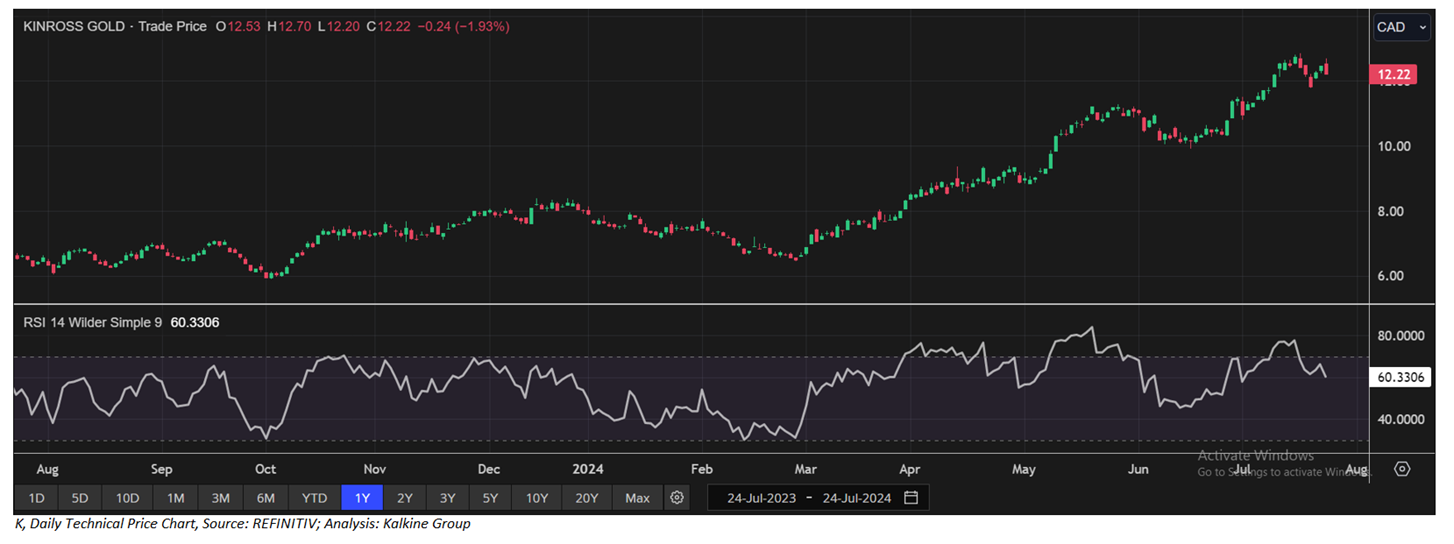
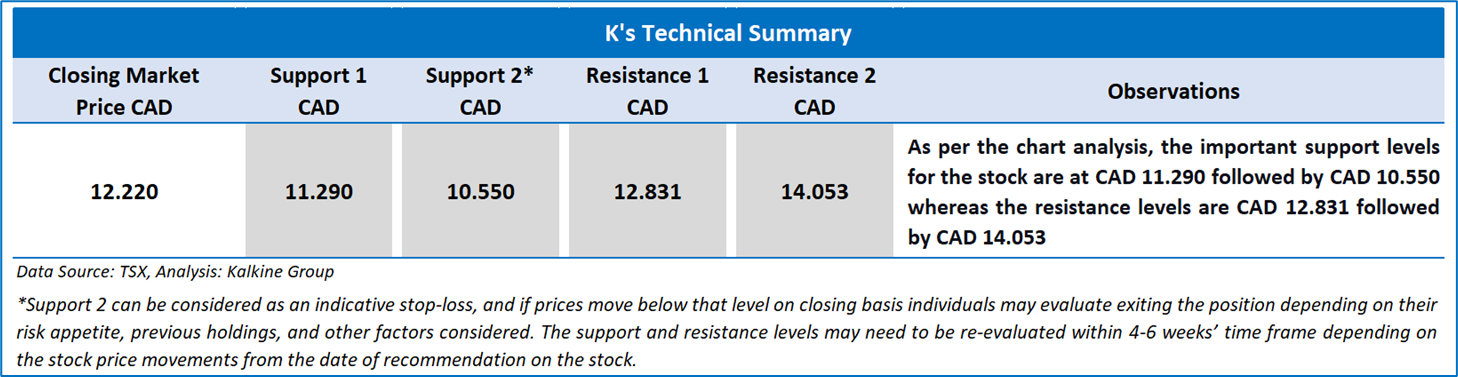
4.1 Price Performance and Technical Summary:

The stock has witnessed an upside of ~16.82% in 1 month and of ~35.17% over the last 3 months. Moreover, the stock is trading above the average 52-week high price of CAD 12.86 and 52-week low price of CAD 5.91 providing an opportunity to accumulate the stock.
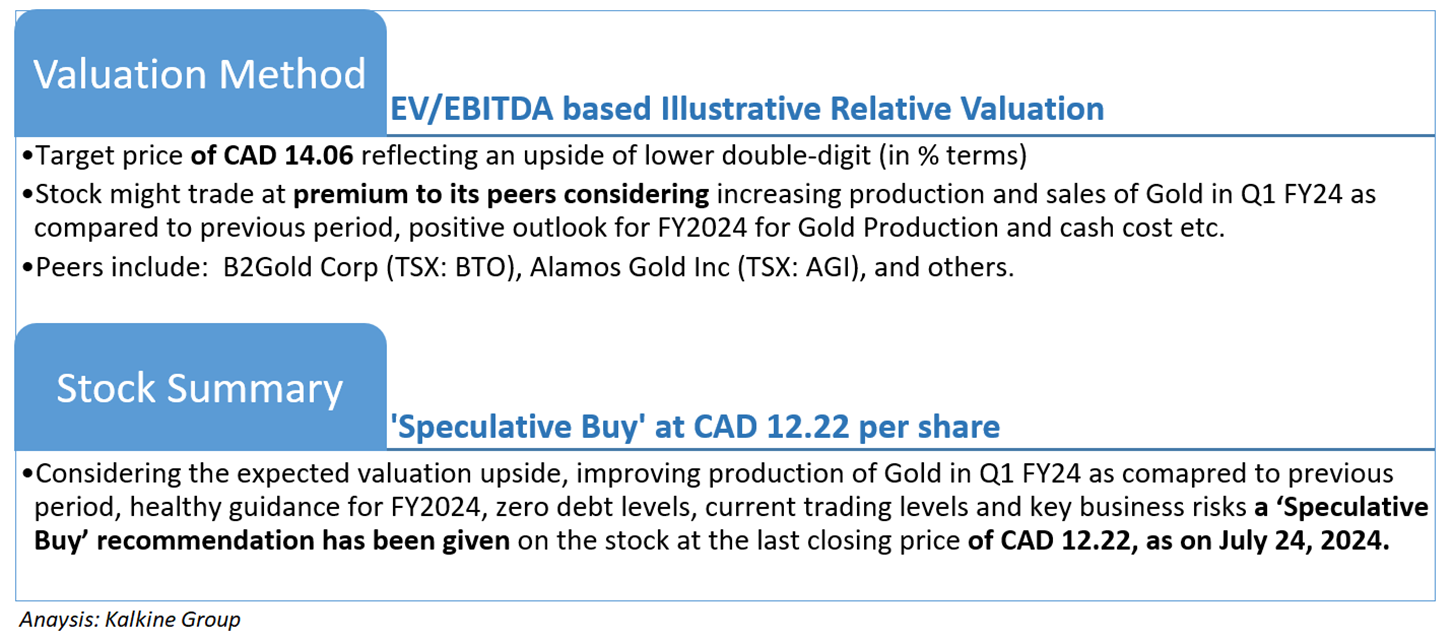
4.2 Fundamental Valuation
Valuation Methodology: EV to EBITDA Multiple Based Relative Valuation (Illustrative)
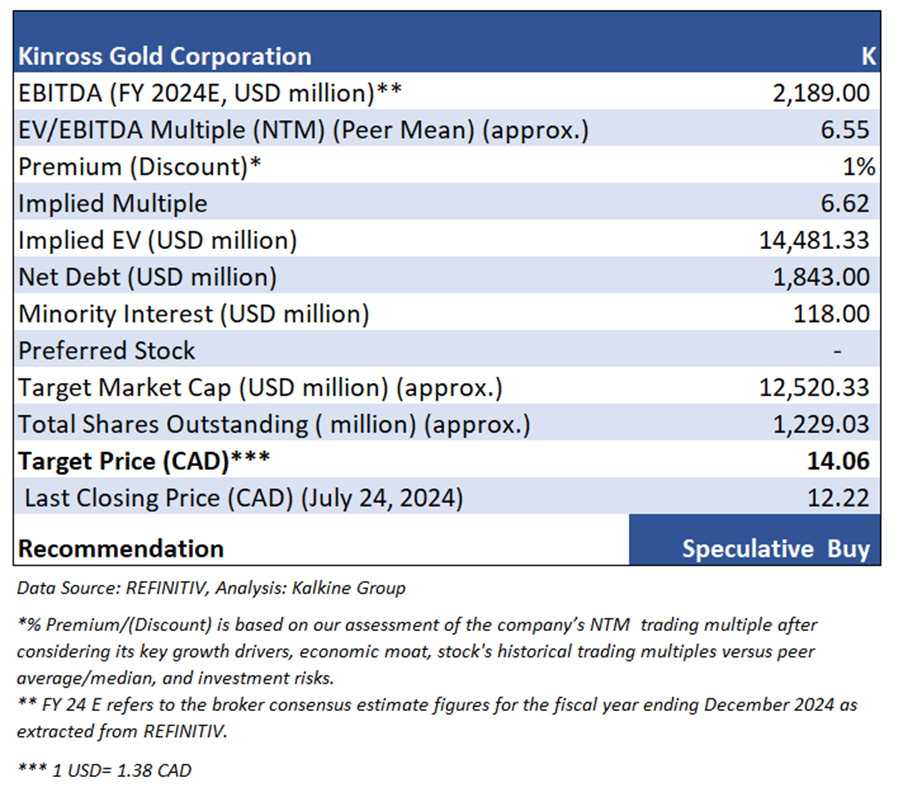
Markets are trading in a highly volatile zone currently due to certain macroeconomic issues and geopolitical tensions prevailing. Therefore, it is prudent to follow a cautious approach while investing.
Note 1: Past performance is not a reliable indicator of future performance.
Note 2: The reference date for all price data, currency, technical indicators, support, and resistance levels is July 24, 2024. The reference data in this report has been partly sourced from REFINITIV.
Note 3: Investment decisions should be made depending on an individual's appetite for upside potential, risks, holding duration, and any previous holdings. An 'Exit' from the stock can be considered if the Target Price mentioned as per the Valuation and or the technical levels provided has been achieved and is subject to the factors discussed above.
Note 4: Dividend Yield may vary as per the stock price movement.
Technical Indicators Defined: -
Support: A level at which the stock prices tend to find support if they are falling, and a downtrend may take a pause backed by demand or buying interest. Support 1 refers to the nearby support level for the stock and if the price breaches the level, then Support 2 may act as the crucial support level for the stock.
Resistance: A level at which the stock prices tend to find resistance when they are rising, and an uptrend may take a pause due to profit booking or selling interest. Resistance 1 refers to the nearby resistance level for the stock and if the price surpasses the level, then Resistance 2 may act as the crucial resistance level for the stock.
Stop-loss: It is a level to protect further losses in case of unfavourable movement in the stock prices.
 Please wait processing your request...