
Company Overview: LYFT Inc. is an on-demand transportation-as-a-service (TaaS) provider. The Company provides peer-to-peer transportation and on-demand ridesharing platform, which offers ride-hailing services. Lyft matches drivers with passengers who request rides through its smartphone application, and passengers pay automatically through the application. The Company offers ridesharing marketplace, which connects drivers with riders to provide car sharing and transportation services. The Company also has a network of shared bikes and scooters in various cities to address the needs of riders who are looking for short trips. Its nearby transit offering integrates third-party public transit data into the Lyft app to offer riders a robust view of transportation options. It offers various enterprise programs, including monthly ride credits for daily commutes, supplementing public transit by providing rides for the first and last leg of commute trips, late-night rides home and shuttle replacement rides.
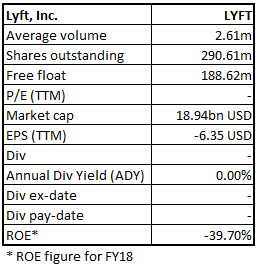
Stock’s Details
Aiming for future growth: LYFT, Inc. (NASDAQ: LYFT) is a U.S. based leading company offering transportation services in approximately 640 cities in the US and about nine cities in Canada. The company offers access to its services through the company’s platform and mobile based applications. In 2018, the company served 30 million riders and nearly 2 million drivers, achieving $8.1 billion in bookings and $2.2 billion in revenue. The company had come up with an initial public offering (IPO) in 2019 and the stock was priced at the upper range of the offer price at $72 per share. The company has seen strong revenue generation from $172.8 million in 1QFY17 to $776.0 million in 1QFY19. On an annual basis, top-line grew from $1,059.9 million in FY17 to $2,156.6 million in FY18, posting a growth of 103%. However, the company did not see any profitability in the last few quarters and losses alleviated in FY18 and 1Q FY19 due to higher costs related to IPO.
Going Forward, the Management expects the losses to peak out in FY2019 and to move in positive territory in terms of bottom-line at a consolidated basis. For FY2019, top line is expected to be in the range of $3.275 billion to $3.3 billion. LYFT expects FY 2019 adjusted EBITDA loss to be in the range of $1.15 billion to $1.175 billion. Going forward, the Management expects revenue to record a Y-o-Y growth in the range of 51.9% to 53% in FY19. With this, we expect CAGR-Growth in revenue over the period FY17-FY19E to be in the range of 75.8% to 76.5%.
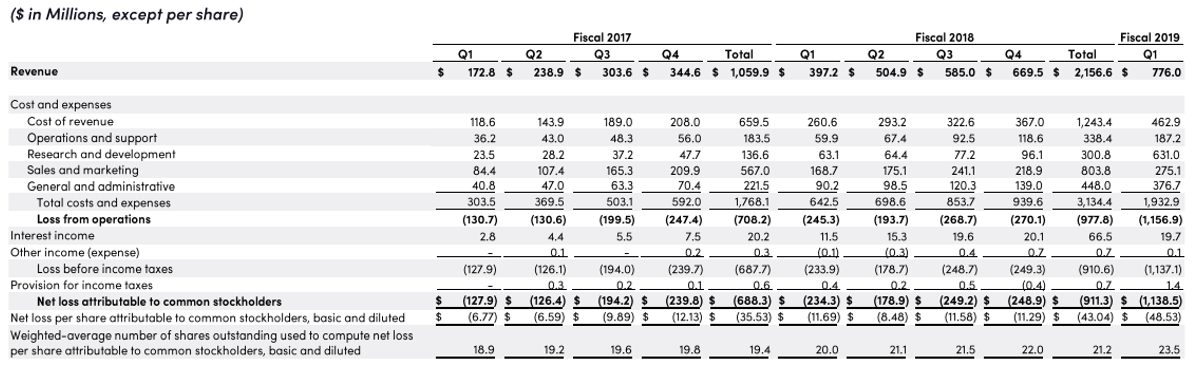
Consolidated Statement of Operations (Source: Company Reports)
A Quick Look at Revenue Generation Model: The Company has a robust business model. The Company generates substantially all of its revenue from its ridesharing marketplace, which ties drivers and travelers/passengers. Moreover, its network of shared bikes and scooters, and Express Drive program also contribute some amount revenue to its total top-line. Since 2018, LYFT is producing revenue from subscription fees and single-use ride fees paid by riders of shared bikes and scooters to access its network of shared bikes and scooters. Subscription fees are recognized on a straight-line basis over the subscription period. Single-use ride fees are recognized upon completion of each related ride. Sales from the network of shared bikes and scooters were not significant and were absent for the March quarter 2019 and FY 2018, respectively. For its Express Drive program, the Company primarily generates revenue from lease income earned under an arrangement with one of its third-party Express Drive partners.
With respect to the Rideshare Marketplace, revenue of the company is generated from service fees and commissions, paid by drivers for using LYFT’s Platform and associated activities. Drivers provide the services to travelers and complete the ride through LYFT mobile application where Lyft operates as a Transportation Network Company. With each completed ride, the company identifies revenue. Pursuant to the terms, LYFT holds the applicable fee for using the Lyft Platform and associated activities from the fare and related charges it collects from passengers on drivers’ behalf.
First Quarter Results for 2019: The company posted a mixed set of numbers and incurred significant losses during the period. LYFT reported a net loss of $1,138.5 million for 1Q19 as compared to a net loss of $234.3 million on pcp. The net loss for the quarter included the stock-based compensation and related payroll tax expenses of $894 million due to the recognition of RSU (Restricted Stock Units) expense associated with the company’s IPO. LYFT, in the first quarter of FY19, reported the adjusted losses per share of $9.02. However, the company’s adjusted losses per share significantly improved from the non-GAAP loss per share of $11.40 in the corresponding period last year.
The company had reported the adjusted revenue growth of 95% (yoy) to $776 million in 1QFY19. The topline growth was driven by a 34% increase in the revenue per active rider to $37.86 due to various monetization offered by the company on the platform or application. The robust top-line was also supported by Active Riders to 20.5 million posting a growth of 46% in the quarter. The growth of the active rider was an account of sharing the ride by more people and also due to the strategic steps, taken by the company to add new riders and retain its existing riders.
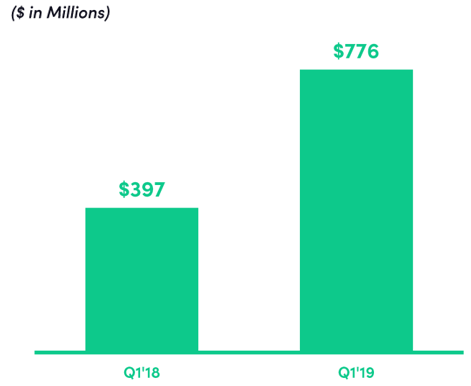
Revenue in 1QFY19 (Source: Company Reports)
The marketing of the initial public offer of the company had also led to the rise of the active riders. Further, during the first quarter of 2019, the contribution margin improved to 49.6% from 35.4% on pcp, driven by the rise in the topline and the reduction of the expenses in the quarter. The company reported a rise of 174% in the Contribution to $384.9 million on a yoy basis.
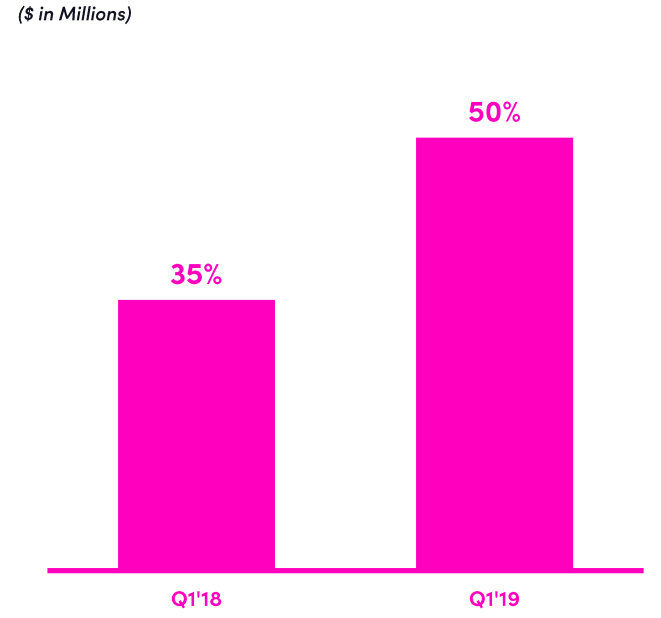
Contribution Margin (Source: Company Reports)
Three expenses on the income statement declined during the quarter were – (1) insurance which is necessary to be done under TNC regulations, processing of the transaction and hosting, (2) R&D expenses as the percentage of the revenue also declined in the quarter to 14% versus 16% on pcp, and (3) Sales & marketing expenses as a percentage of revenue fell to 29% from 42% on pcp.
As a result, for the first quarter, adjusted EBITDA loss had improved to $216 million from the adjusted EBITDA loss of $239 million in the same period last year. Consequently, adjusted EBITDA margin stood at -27.8% as compared to -60% posted in the corresponding period last year, reflecting a rise of ~32 percentage points in the margin on the year-on-year basis.
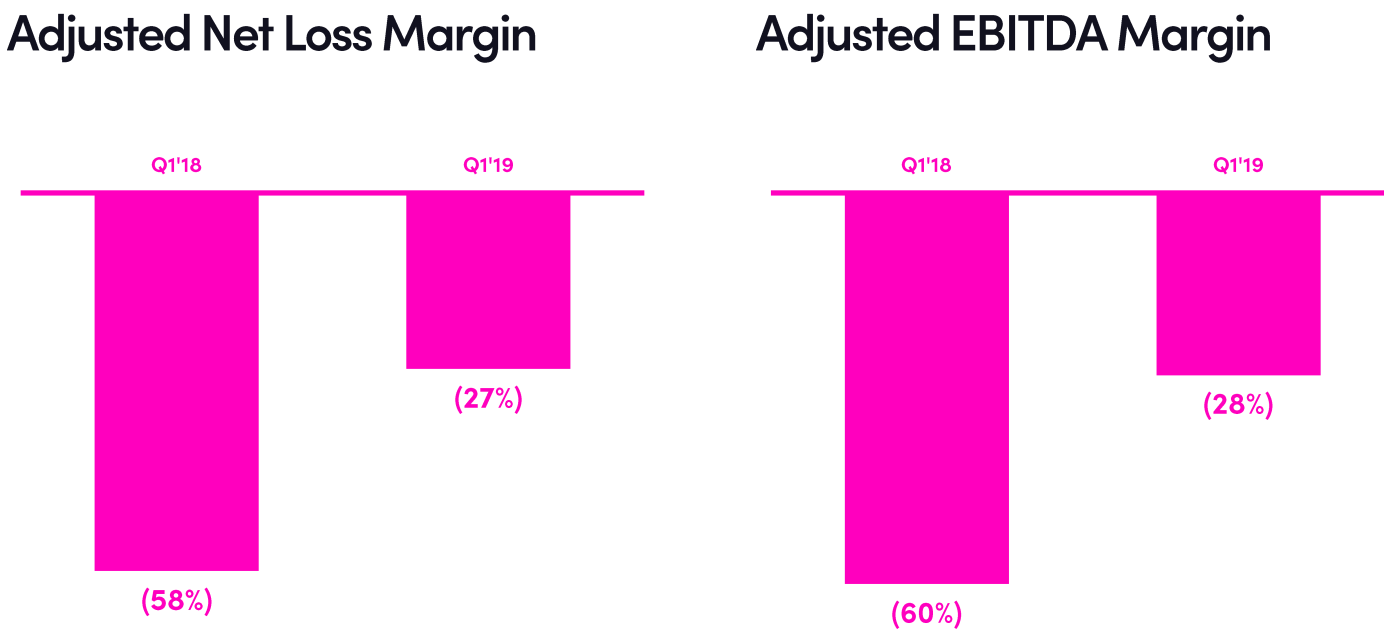
Adjusted Net Loss Margin and Adjusted EBITDA Margin (Source: Company Reports)
Additionally, the company, at the end of March 2019, had cash & cash equivalents of $1 billion on the balance sheet. Meanwhile, LYFT raised funds through an initial public offer and received the net proceeds of $2.5 billion. As a result, the company has cash of $3.5 billion with no debt on the books.
Top 10 Shareholders: The top 10 shareholders have been highlighted in the table, which together form around 42.73% of the total shareholding. Rakuten Europe S.a.r.l. and Fidelity Management & Research Company hold the maximum interest in the company at 11.50% and 7.25%, respectively.
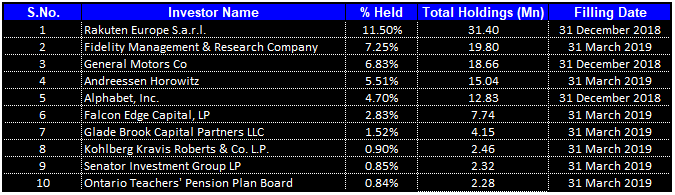
Top 10 Shareholders (Source: Thomson Reuters)
Major Development During the First Quarter 2019: LYFT’s strong performance during the period was on the back of product innovation, market growth, and strong focused execution by the company. LYFT, during the first quarter, had rolled out the service, namely, the Lyft matching platform. The company had been working on it from the past one year. With this platform, LYFT will be able to handle the pairing of passenger & the driver simultaneously, which will ultimately result in more rides and less cancellations. Overall, it will result in the further generation of topline and improvement of margins.
LYFT witnessed market growth for transportation during the first quarter as more consumers were attracted towards it. Further, it has been projected that about 3.6 million Americans are not able to attain medical appointments every year due to less availability of transportation service, for which LYFT has signed the partnerships with the largest healthcare systems present in the U.S. Moreover, there is a paradigm shift in the industry as the car ownership is speedily getting replaced with the transportation as a service. According to the recent economic impact report, 35% of LYFT users do not have their own car at all. As per the recent estimate, about 300,000 consumers got rid of their car because of Lyft. The company has recognized an opportunity that more than $1 trillion car owners will enter to the market of transportation as a service.
Key Metrics: The company’s gross margin came in at 16.2%, lower on sequential and yoy basis. As the company has not seen profitability in the last few quarters, margins remained in the negative territory. Current ratio during 1QFY19 stood at 0.79x, below the industry median of 1.17x.
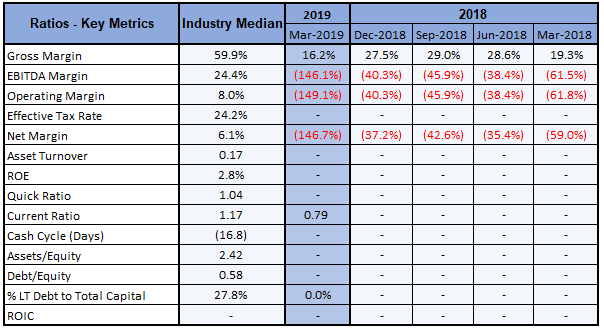
Key Metrics (Source: Thomson Reuters)
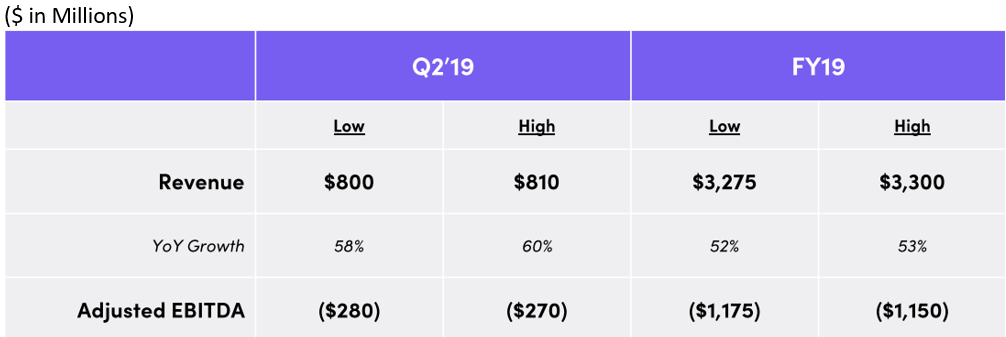
Outlook for 2Q 2019 and Full Year 2019: LYFT anticipates FY19 to be its peak loss year, and then it will move towards profitability at a consolidated basis. For the full year 2019, the company expects the top-line to be in the range of $3.275 billion to $3.3 billion. LYFT expects FY 2019 adjusted EBITDA loss to be in the range of $1.15 billion to $1.175 billion.
For the second quarter of 2019, the company anticipates the revenue to be in the range of $800 million to $810 million. However, the growth rate of the top-line will start falling from the 2Q 2019, on the back of the price hike seen in the corresponding quarter last year. Moreover, for the second quarter of 2019, LYFT anticipates the adjusted EBITDA loss to be in the range of $270 million to $280 million.
Outlook (Source: Company Reports)
Stock Recommendation: LYFT stock, trading at $65.17, has support at around $58.5 level and resistance at $76.24. For the second quarter of 2019, the company has projected topline growth to be in the range of 58% to 60% year-over-year. For the full-year 2019, the company expects the revenue to grow in the range of 52% to 53%. The company expects that the year 2019 will be proven a peak loss year, and then the company will move to profitability on a consolidated basis. The company during the quarter witnessed a 46% rise in the active rider. The industry overall is undergoing transformation where the services related to the transportation are on the rise and the number of car ownership is falling. The company’s adjusted EBITDA margin has improved significantly with cash of $3.5 billion (including the net proceeds from the IPO) and no debt on the books. Hence, considering the aforesaid facts, the recent pull-back in stock price and looking at decent outlook in the long run despite short-term challenges, we give a “Buy” recommendation on the stock at the current market price of $65.17, up 0.57% on 17 July 2019, and expect single high-digit growth in the next 12-18 months.
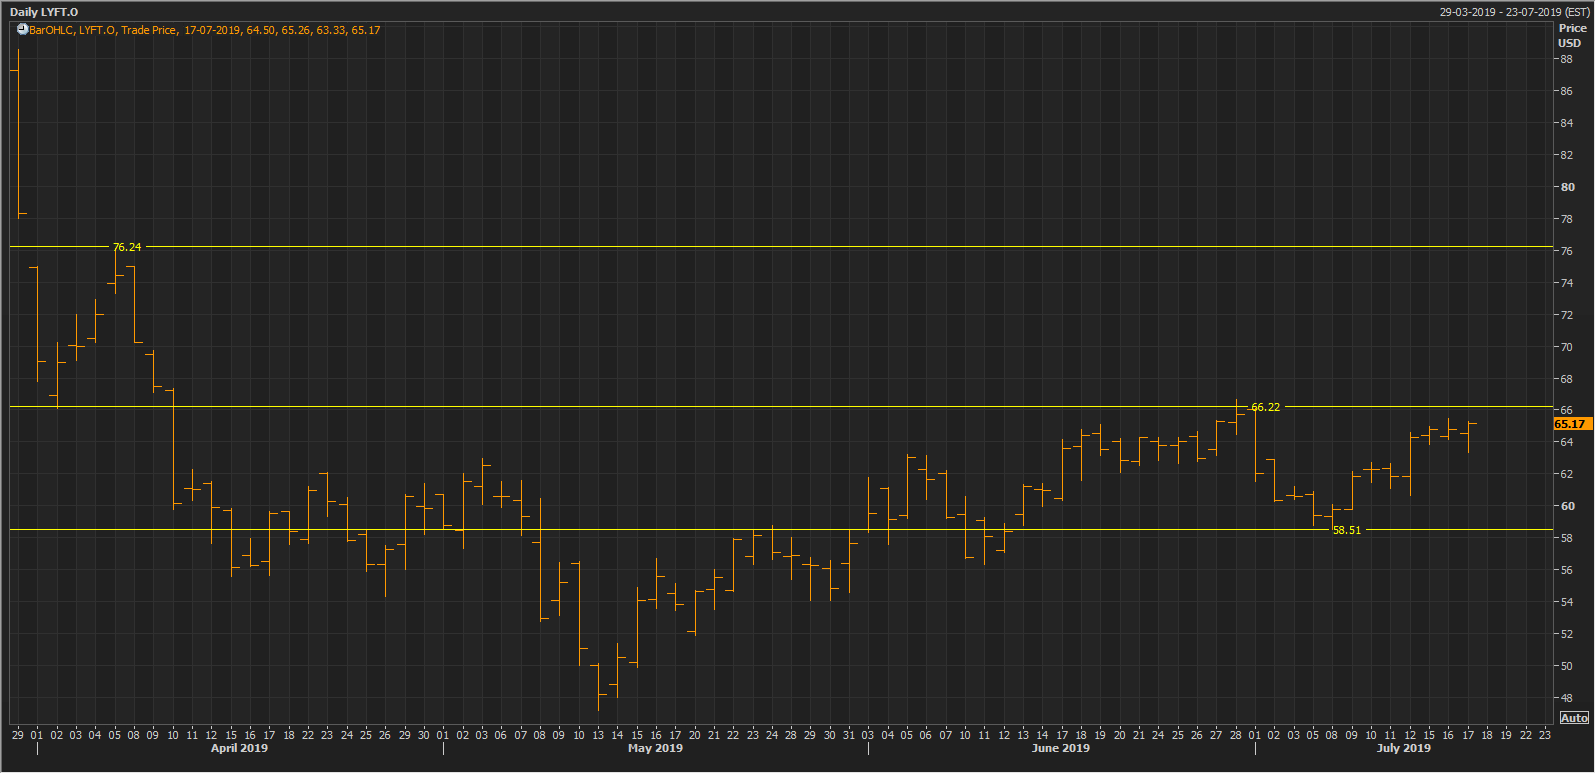
LYFT Daily Chart (Source: Thomson Reuters)
Disclaimer
The advice given by Kalkine Pty Ltd and provided on this website is general information only and it does not take into account your investment objectives, financial situation or needs. You should therefore consider whether the advice is appropriate to your investment objectives, financial situation and needs before acting upon it. You should seek advice from a financial adviser, stockbroker or other professional (including taxation and legal advice) as necessary before acting on any advice. Not all investments are appropriate for all people. Kalkine.com.au and associated websites are published by Kalkine Pty Ltd ABN 34 154 808 312 (Australian Financial Services License Number 425376). The information on this website has been prepared from a wide variety of sources, which Kalkine Pty Ltd, to the best of its knowledge and belief, considers accurate. You should make your own enquiries about any investments and we strongly suggest you seek advice before acting upon any recommendation. Kalkine Pty Ltd has made every effort to ensure the reliability of information contained in its newsletters and websites. All information represents our views at the date of publication and may change without notice. To the extent permitted by law, Kalkine Pty Ltd excludes all liability for any loss or damage arising from the use of this website and any information published (including any indirect or consequential loss, any data loss or data corruption). If the law prohibits this exclusion, Kalkine Pty Ltd hereby limits its liability, to the extent permitted by law to the resupply of services. There may be a product disclosure statement or other offer document for the securities and financial products we write about in Kalkine Reports. You should obtain a copy of the product disclosure statement or offer document before making any decision about whether to acquire the security or product. The link to our Terms & Conditions has been provided please go through them and also have a read of the Financial Services Guide. On the date of publishing this report (mentioned on the website), employees and/or associates of Kalkine Pty Ltd do not hold positions in any of the stocks covered on the website. These stocks can change any time and readers of the reports should not consider these stocks as advice or recommendations.
 Please wait processing your request...