
Company Overview: Malibu Boats, Inc. is a designer, manufacturer and marketer of performance sport boats. The Company's segments include the U.S. and Australia. Each segment is engaged in the manufacturing, distribution, marketing and sale of performance sport boats. Its U.S. segment serves markets in North America, South America, Europe and Asia. Its Australia segment serves the Australian and New Zealand markets. The Company's boats are used for water sports, including water skiing, wakeboarding and wake surfing, as well as general recreational boating. The Company sells its boats under Malibu and Axis Wake Research (Axis) brand names. The Company's boats are constructed of fiberglass, equipped with inboard propulsion systems and available in a range of sizes and hull designs. The Company also offers various accessories and aftermarket parts. The Company's boat models include Malibu M Series, Malibu Wakesetter, Malibu Response and Axis.
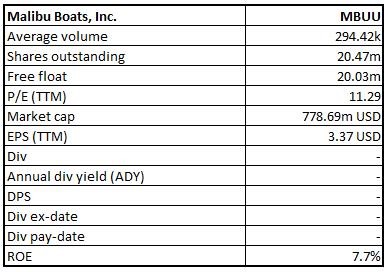
MBUU Details
Product Innovation Leading to Dominant Market Share: Malibu Boats, Inc. (NASDAQ: MBUU) is engaged in the manufacturing, distribution and marketing of a wide range of recreational powerboats. Its key products include performance sport boats, sterndrive and outboard boats. The company designs products that appeal to a wider range of recreational boaters, fisherman and water sports enthusiasts who explore boating. On October 15, 2018, MBUU successfully completed 100% acquisition of assets of the Pursuit Boats division of S2 Yachts, Inc., for a price consideration of $100.1 million, which was funded with cash and borrowings, pursuant to an asset purchase agreement.
New product development and operational excellence initiatives differentiate the company enabling its outperformance as compared to the industry. Unparalleled vertical integration coupled with several strategies supported manufacturing flexibility and agility to respond quickly to macro dynamics. In FY19, net revenue stood at $684.02 million, posting a growth of 37.6% as compared to $497.002 million during FY18. Net profit of the company stood at $69.7 million, which grew 125.1% on y-o-y basis. Looking at the past performance, MBUU delivered a CAGR growth of ~31.5% in revenue over the period of FY15 to FY19, while net profit posted a CAGR growth of ~31.7% over the same period.
Going forward, Malibu Boats, Inc. is well placed for continued growth, increasing profitability, and delivering long-term value to the shareholders. Differentiation of products through the continuous emphasis on new product development, operational efficiencies, unparalleled vertical integration strategy to support manufacturing flexibility augur well for the future growth of the business.
.png)
Five-Year Income Statement (Source: Company Reports)
Revenue Recognition and Segments: The company recognizes its revenue through its two segments – (a) Boat and Trailer Sales and, (b) Parts and Other Sales. Boat and Trailer Sales segment consists of sales of boats and trailers to the Company's dealer network, net of sales returns, discounts, rebates, and free flooring incentives. It also includes optional boat features. Part and Other Sales Segment primarily constitutes parts and accessories sales, royalty income and clothing sales. This segment includes replacement and aftermarket boat parts and accessories sold to the Company's dealer network.
Leading Market Share Position: As per the SSI data, MBUU has the highest market share in the U.S. The business has grown in this category through the Malibu and Axis brands from ~24.5% in 2010 to ~31.3% in 2018. Moreover, MBUU holds the number one market share position in the 24’—29’ segment of the sterndrive boat category through the Cobalt brand according. Cobalt has expanded its market share in this segment from 14.2% in 2010 to 32.3% in 2018. With the Pursuit brand, the company holds the number two market share position in the offshore boat category for CY2018. Pursuit has expanded its market share in its respective segment to 19.0% in CY2018 from 17.7% in CY2010.
Industry-leading Product Design and Innovation: The innovation in the design of new boat models and new features, which has aided the company to its success. The company has introduced several integrated Surf Platform, which includes patented Surf Gate and Power Wedge technology along with Swim Step. Additionally, by introducing new boat models across the portfolio of brands in a range of price points, sizes, bow and hull designs, engine propulsion, and optional performance features, the company believes that it has enhanced consumers’ ability to select a boat suited to their individual preferences.
Q1FY20 Financial Highlights for the period ending 30 June 2019: The company continued to post a decent set of numbers, driven by innovative product portfolio and operational excellence initiatives to drive the growth. MBUU reported a y-o-y increase of 39.4% to $172.1 million in its top-line. Net sales per unit on pcp terms increased 22.3%, aided by the acquisition of Pursuit, price increment of its product and product-mix of larger models.
.png)
Q1FY20 Income Statement (Source: Company Resource)
Net Sales and Volume: MBUU reported net sales for its first-quarter results, wherein the company reported revenue of $172.1 million, grew 39.4% from Q1FY19 of $123.48 million. During the quarter, the business posted 13.9% growth in its unit volume to 1,727 units as compared to the previous corresponding period. The increase in net sales and unit volumes was aided by the acquisition of Pursuit in October 2018 as well as increased demand for Malibu and Axis brands coupled with year-over-year price increases across Malibu, Axis and Cobalt brands.
.png)
Q1FY20 Net Sales and Volume (Source: Company reports)
Cost of Sales: During the quarter, cost of sales stood at $132.1 million, grew 42% on y-o-y basis, driven by incremental costs contributed by Pursuit since its acquisition in October 2018 and an increase in unit volumes at Malibu business. Cost of sales represented 76.8% of the total revenue as compared to 75.3% in the previous corresponding quarter.
Gross Profit: MBUU reported its gross profit at $40.0 million, up 31.1% as compared to Q1FY19. The increase in gross profit was mainly due to higher unit volumes. Gross margin during the quarter decreased 150 basis points from 24.7% to 23.2% in the prior corresponding period on account of the acquisition of Pursuit.
.png)
.png)
Q1FY20 Gross Profit and Gross Margin (Source: Company Reports)
Selling and Marketing Expenses: The company reported its selling and marketing expenses at $5.06 million, depicting an increase of 44.8% on y-o-y basis, primarily due to the incremental expenses attributable to Pursuit. As a percentage of sales, selling and marketing expenses represented 2.9% of the total sales as compared to 2.8% on Q1FY19.
General and Administrative Expenses: MBUU posted general and administrative expenses at $10.7 million as compared to $8.97 million, aided by the incremental expenses attributable to Pursuit. This represented 6.2% of the total revenue as compared to 7.3% in the previous corresponding quarter.
Amortization expense: The quarter saw amortization expenses at $1.58 million as compared to $1.28 million in Q1FY19, primarily due to the additional amortization expense related to intangibles acquired as part of the Pursuit acquisition.
Adjusted EBITDA during the first quarter of FY20 stood at $28.4 million as compared to $22.9 million in Q1FY19, posting an increase of 24% (yoy), while adjusted EBITDA margin decreased to 16.5% from 18.5% during the same time period. Net income for the first quarter of FY20 increased 38.8% on y-o-y basis to $16.7 million from $12.0 million in Q1 FY19, and net income margin remained flat at 9.7% in the first quarter of FY20.
.png)
Q1FY20 Adjusted EBITDA (Source: Company Reports)
.png)
Segment-wise Revenue (Source: Company Reports)
The business derives the major revenue from its domestic market, i.e., the U.S., while a part of revenue also comes from exports. Revenue from the U.S. stood at $159.9 million, representing 92.94% of the total revenue, while the international segment derived 7.06% of the total revenue at $12.15 million.
Top 10 Shareholders: The top 10 shareholders have been highlighted in the table, which together form around 48.17% of the total shareholding. BlackRock Institutional Trust Company, N.A. and Lord, Abbett & Co. LLC hold the maximum interests in the company at 7.06% and 6.50%, respectively.
.png)
Top 10 Shareholders (Source: Thomson Reuters)
Key Metrics: The Company posted decent margins during the first quarter of FY20. Pretax margin for Q1FY20 stood at 12.5%, higher than the industry median of 7.9%. Operating and net margin for Q1FY20 came in at 13.2% and 9.7%, higher than the industry median of 10.3% and 7.1%, respectively. Return on Equity (ROE) during the quarter stood at 7.7%, higher than the industry median of 4%.
.png)
Key Ratios Metrics (Source: Thomson Reuters)
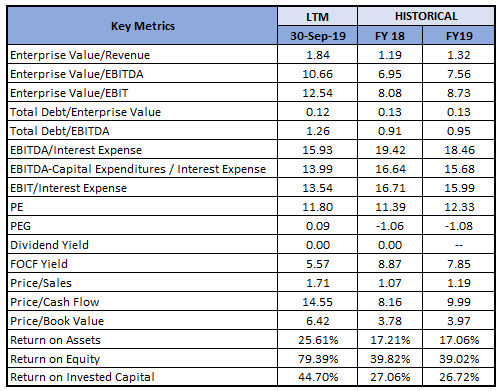
Key Valuation Metrics (Source: Thomson Reuters)
Guidance: As per the outlook for FY20, the business expects consolidated net sales to grow at mid-to-high single-digit on percentage terms. Gross margin is expected to improve slightly, excluding the impact of UAW strike. MBUU expects adjusted EBITDA margin to be down slightly for FY20, owing to the impact of UAW strike. Capital expenditure is expected to come in between $40 million to $45 million, while MBUU expects a hit of $3 million in its profitability due to UAW strike impact.
Valuation Methodologies:
Method 1:Price to Earnings Multiple Approach:
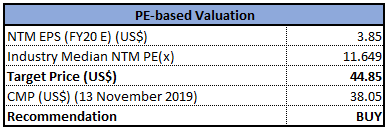
PE Based Valuation (Source: Thomson Reuters), *NTM-Next Twelve Months
Method 2: Price to Cash Flow Multiple Approach:
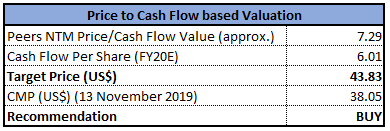
Price to Cash Flow Based Valuation (Source: Thomson Reuters), *NTM-Next Twelve Months
Method 3: Enterprise Value to EBITDA Multiple Approach:
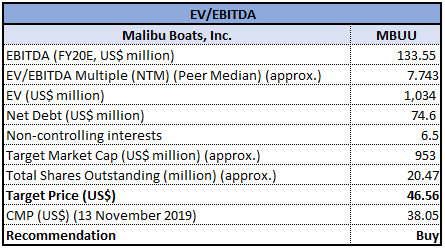
EV/EBITDA Based Valuation (Source: Thomson Reuters), *NTM-Next Twelve Months
Note: All forecasted figures and peers have been taken from Thomson Reuters, *NTM-Next Twelve Months
Stock Recommendation: At the market close, the stock of MBUU closed at $38.05 with a price to earnings multiple of 11.29x and market capitalization of ~$778.69 million. MBUU has a pleasant track record of expanding the market share due to new product development, improved distribution, new models, and innovative features. The company is enhancing product development combined with diligent management of the Cobalt and Pursuit dealer networks to improve the share of the sterndrive and outboard markets over time. Considering the aforesaid facts, we have valued the stock, using three relative valuation methods, i.e., Price to Earnings Multiple, Price to Cash Flow multiple, and Enterprise Value to EBITDA Multiple, and arrived at a target price of lower double-digit growth (in % term). Hence, we recommend a “Buy” rating on the stock at the closing price of $38.05, down 0.68% on 13 November 2019.
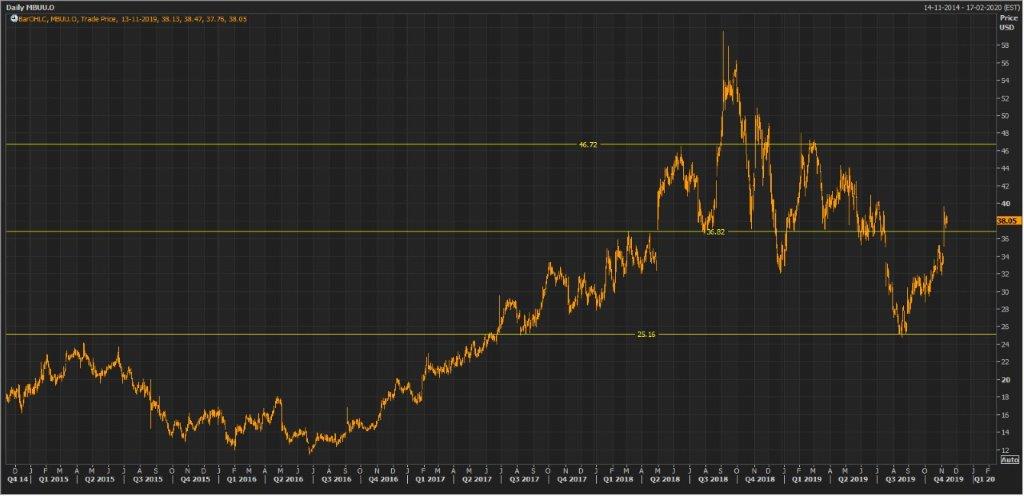
MBUU Daily Technical Chart (Source: Thomson Reuters)
Disclaimer
The advice given by Kalkine Pty Ltd and provided on this website is general information only and it does not take into account your investment objectives, financial situation or needs. You should therefore consider whether the advice is appropriate to your investment objectives, financial situation and needs before acting upon it. You should seek advice from a financial adviser, stockbroker or other professional (including taxation and legal advice) as necessary before acting on any advice. Not all investments are appropriate for all people. Kalkine.com.au and associated websites are published by Kalkine Pty Ltd ABN 34 154 808 312 (Australian Financial Services License Number 425376). The information on this website has been prepared from a wide variety of sources, which Kalkine Pty Ltd, to the best of its knowledge and belief, considers accurate. You should make your own enquiries about any investments and we strongly suggest you seek advice before acting upon any recommendation. Kalkine Pty Ltd has made every effort to ensure the reliability of information contained in its newsletters and websites. All information represents our views at the date of publication and may change without notice. To the extent permitted by law, Kalkine Pty Ltd excludes all liability for any loss or damage arising from the use of this website and any information published (including any indirect or consequential loss, any data loss or data corruption). If the law prohibits this exclusion, Kalkine Pty Ltd hereby limits its liability, to the extent permitted by law to the resupply of services. There may be a product disclosure statement or other offer document for the securities and financial products we write about in Kalkine Reports. You should obtain a copy of the product disclosure statement or offer document before making any decision about whether to acquire the security or product. The link to our Terms & Conditions has been provided please go through them and also have a read of the Financial Services Guide. On the date of publishing this report (mentioned on the website), employees and/or associates of Kalkine Pty Ltd do not hold positions in any of the stocks covered on the website. These stocks can change any time and readers of the reports should not consider these stocks as advice or recommendations.
 Please wait processing your request...