

Shopify Inc.
Section1: Company Overview
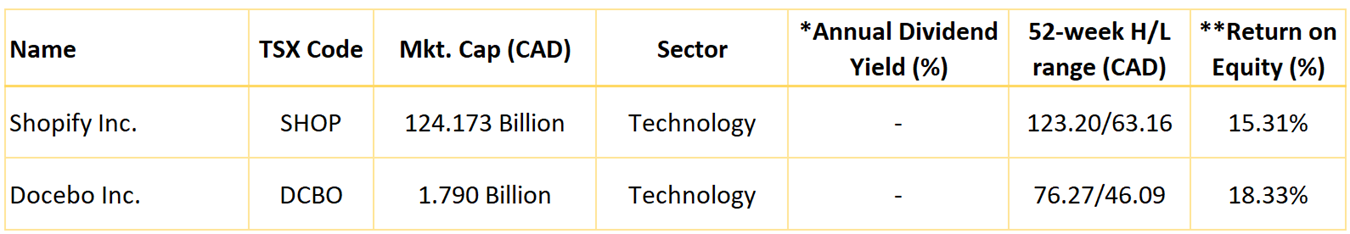
Shopify Inc. (TSX: SHOP) offers an e-commerce platform primarily to small and midsize businesses. The firm has two segments: subscription solutions and merchant solutions, The subscription solutions segment allows Shopify merchants to conduct e-commerce on a variety of platforms, including the company's website, physical stores, pop-up stores, kiosks, social networks (Facebook), and Amazon. Merchant solutions are add-on products for the platform that facilitate e-commerce and include Shopify Payments, Shopify Shipping, and Shopify Capital.
This Report covers the Investment Highlights, Key Financial Metrics, Risks, Technical Analysis along with the Valuation, Target Price, and Recommendation on the stock.
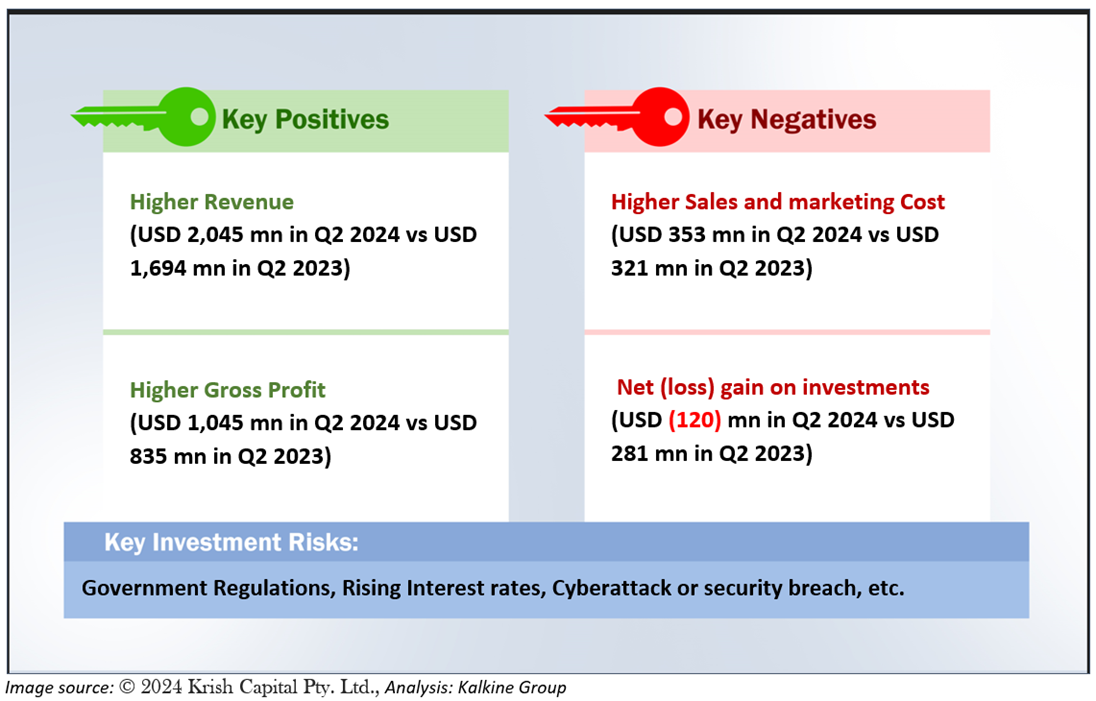
1.1 The Key Positives, Negatives, Investment Highlights, and Risks
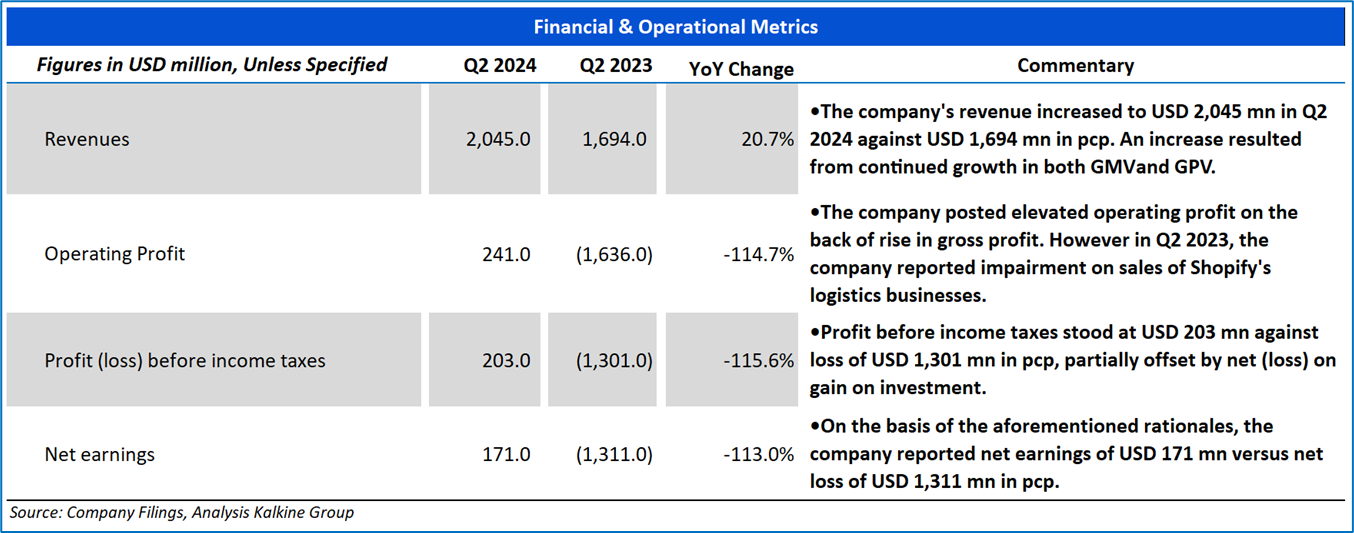
Section2: Financial Highlights
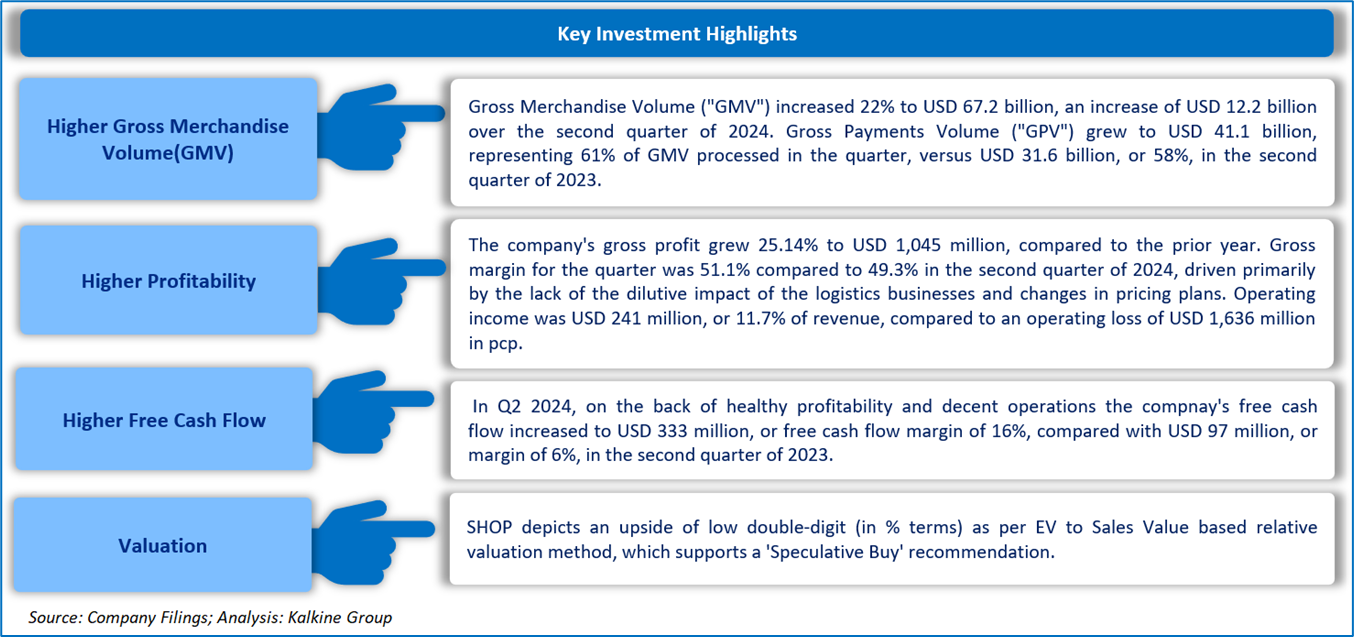
2.1 Key Financial Highlights
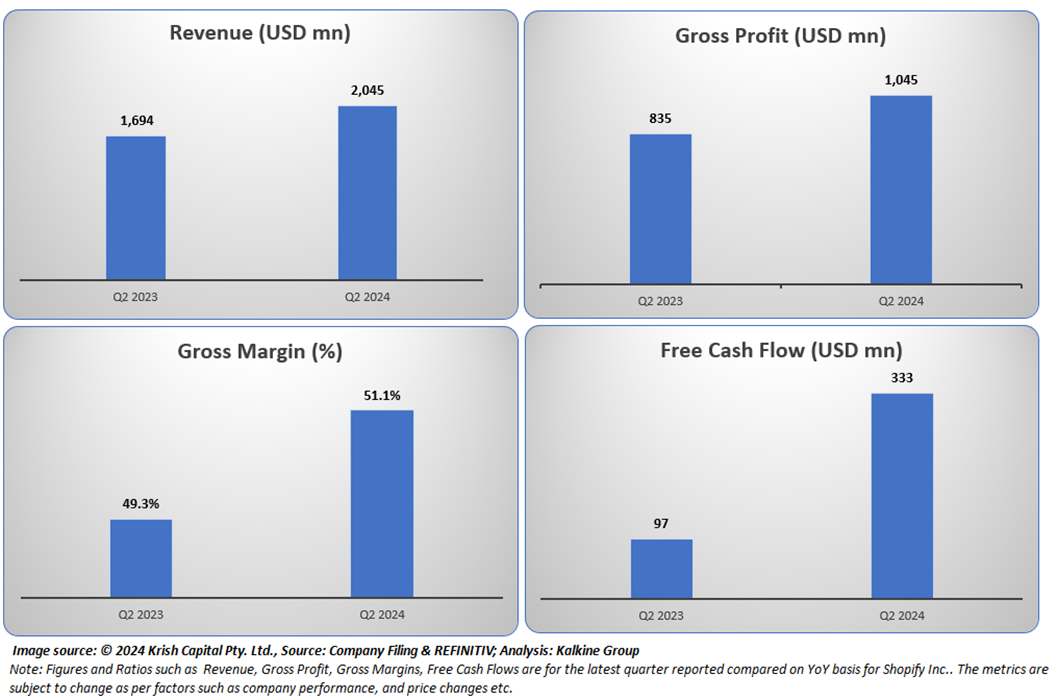
Section 3: Key Metrics
Below charts depict the change in Revenue, Gross Profit, Gross Margin and Free Cash Flow of the Company for the latest reported quarter.
Section 4: Stock Recommendation Summary
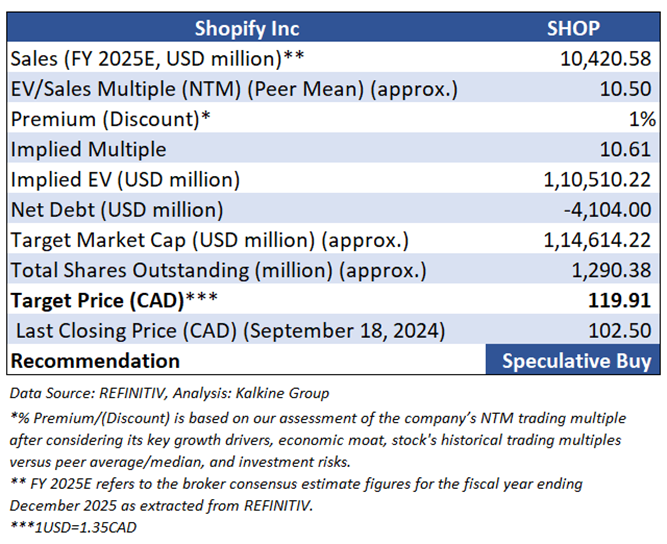
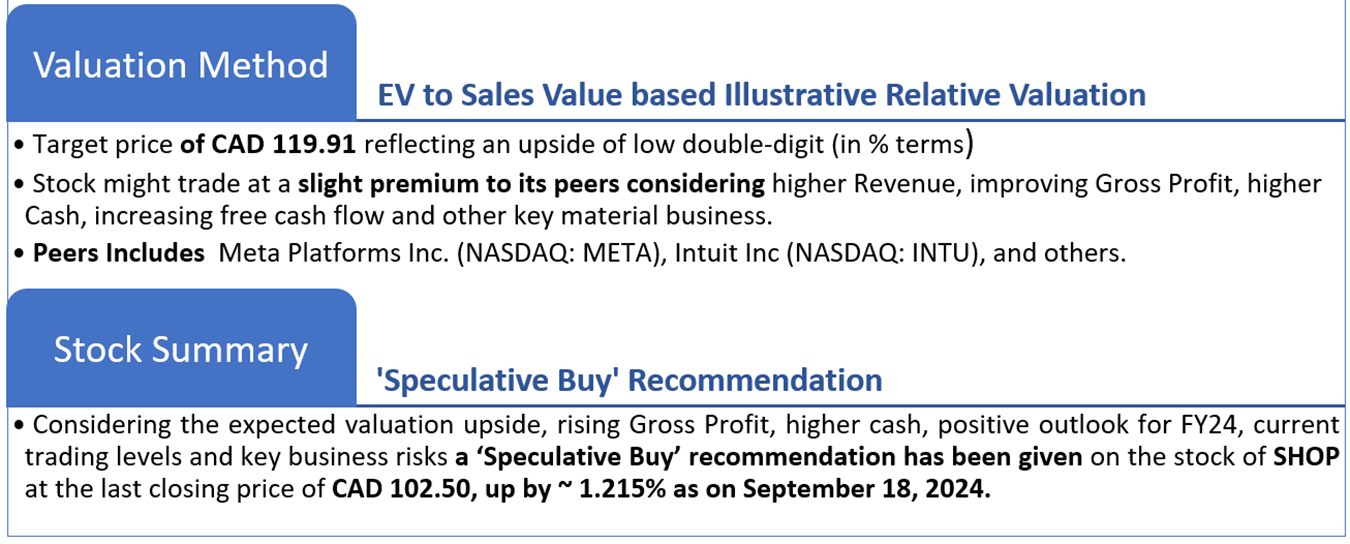
4.1 Valuation Methodology
Valuation Methodology (Illustrative): EV to Sales based.
4.2 Price Performance and Stock Recommendation

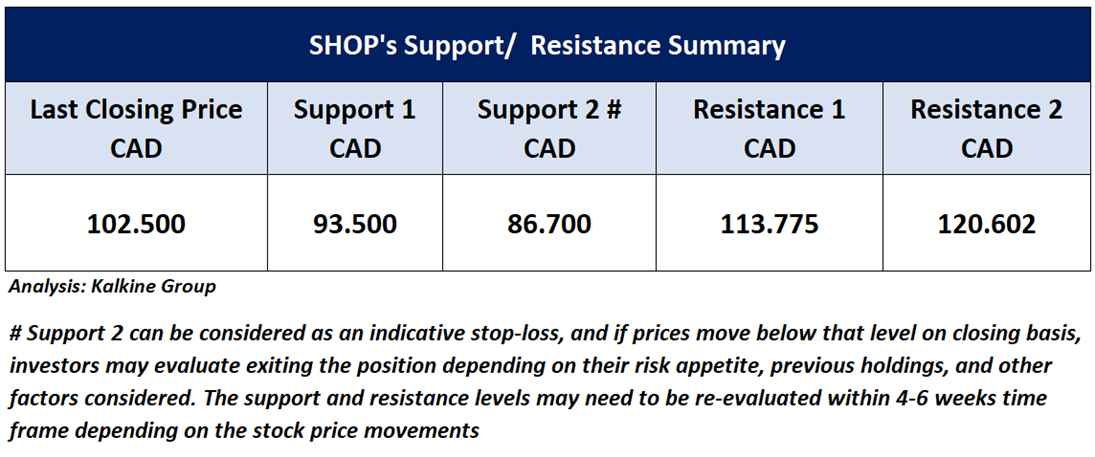
The stock has witnessed an upside of ~5.59% in 1 week and ~16.06% over the last 3 months respectively. Moreover, the stock is trading above the average 52-week high price of CAD 123.20 and 52-week low price of CAD 63.16 providing an opportunity to ride the trend.
4.3 One-Year Technical Price Chart
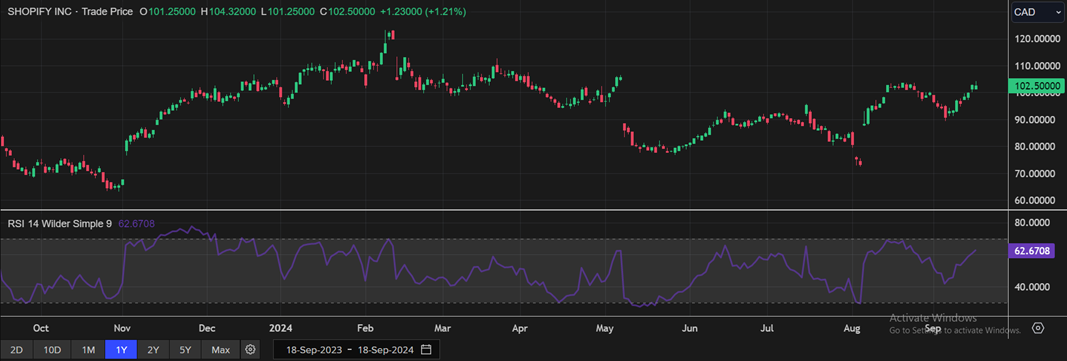
One-Year Technical Price Chart (as of September 18, 2024). Source: REFINITIV, Analysis: Kalkine Group
4.4 Technical Summary
Docebo Inc.
Section1: Company Overview
Docebo Inc. (TSX: DCBO) offers cloud-based learning platform for both internal and external enterprise learning with real time tracking of training results, optimizing time, and reducing costs associated with traditional learning methods. Geographically, it holds presence in five offices around the world, including locations in Europe, Asia and North America. The firm derives its revenues from two main sources: software as-a-service application (SaaS); and professional services revenue.
This Report covers the Investment Highlights, Key Financial Metrics, Risks, Technical Analysis along with the Valuation, Target Price, and Recommendation on the stock.
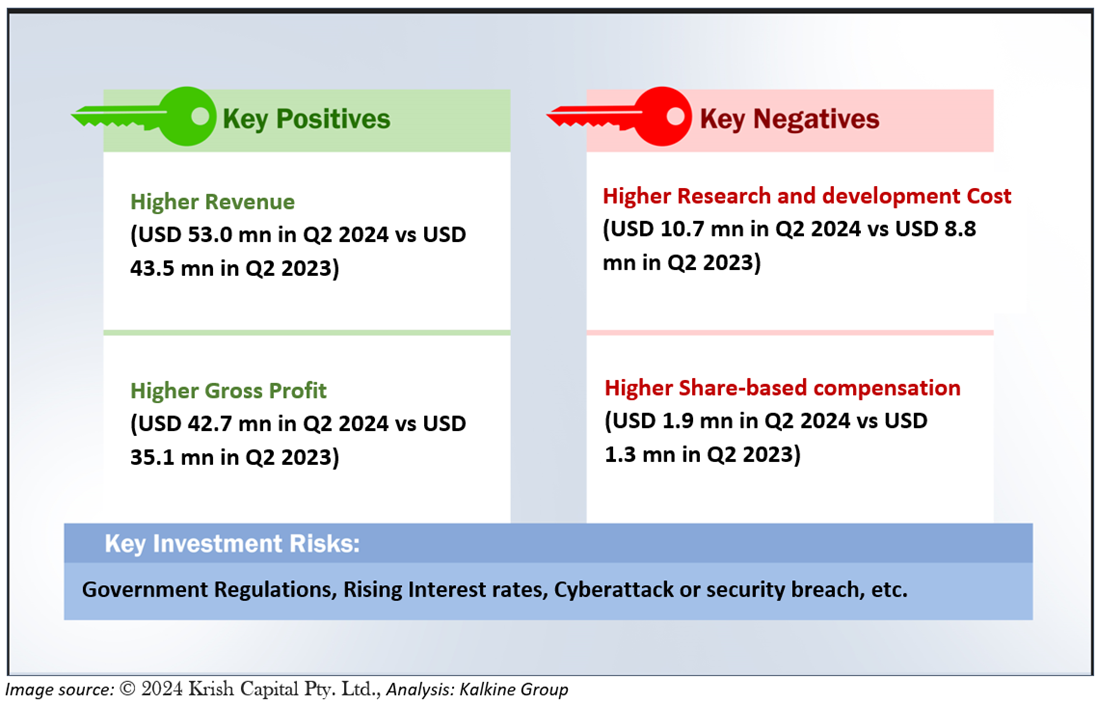
1.2 The Key Positives, Negatives, Investment Highlights, and Risks
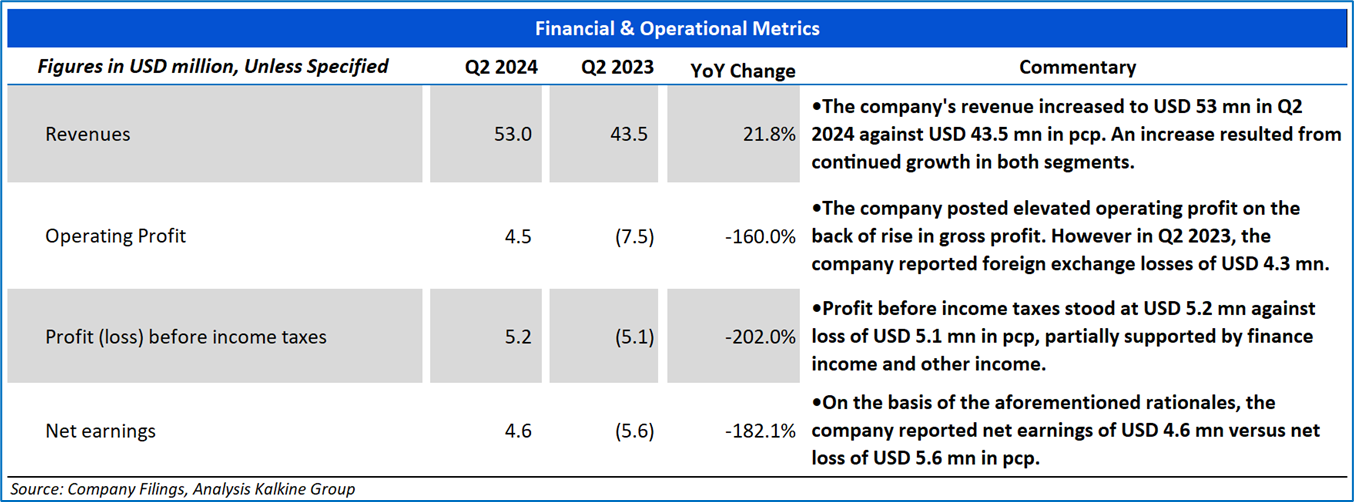
Section2: Financial Highlights
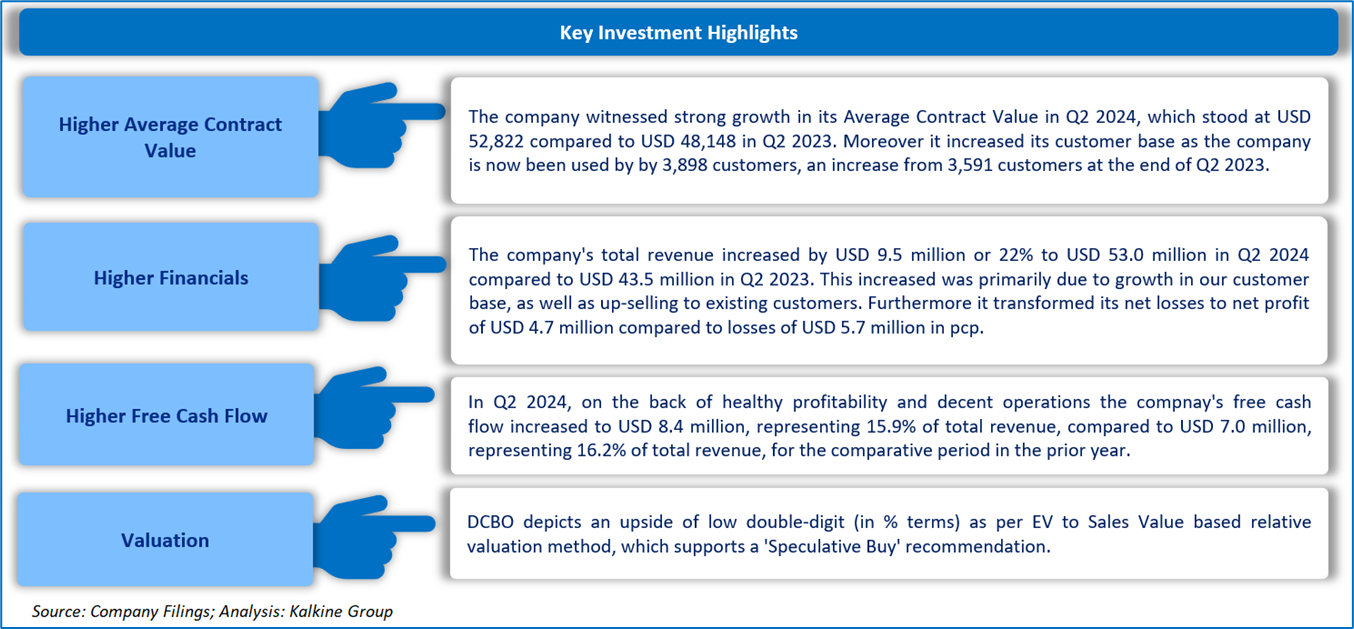
2.1 Key Financial Highlights
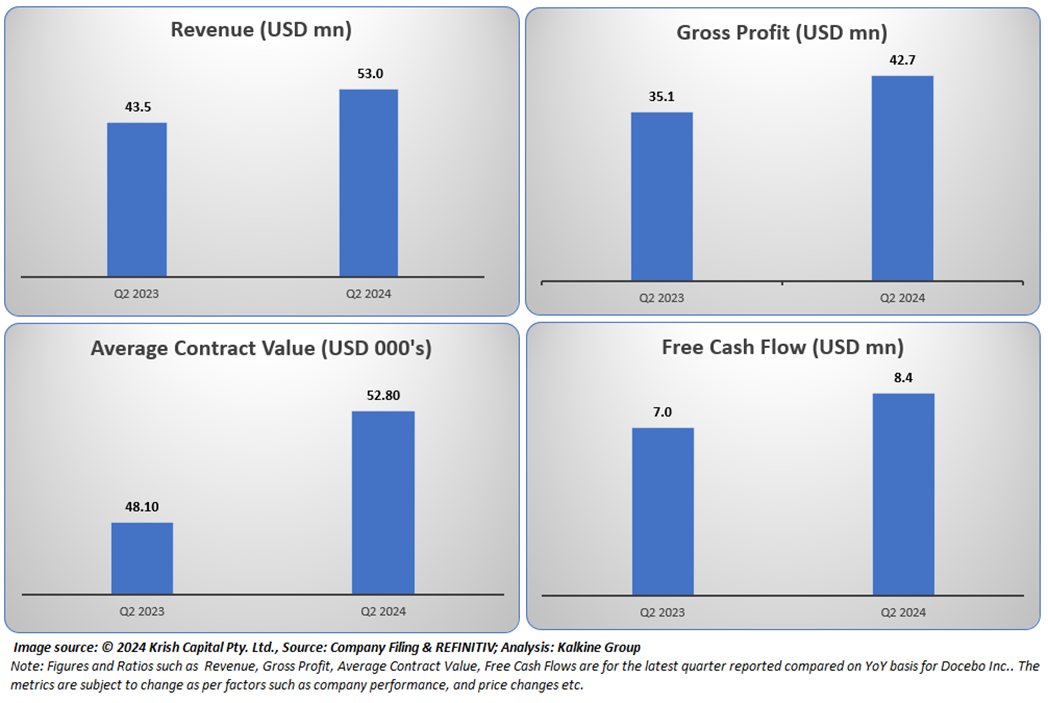
Section 3: Key Metrics
Below charts depict the change in Revenue, Gross Profit, Average Contract Value and Free Cash Flow of the Company for the latest reported quarter.
Section 4: Stock Recommendation Summary
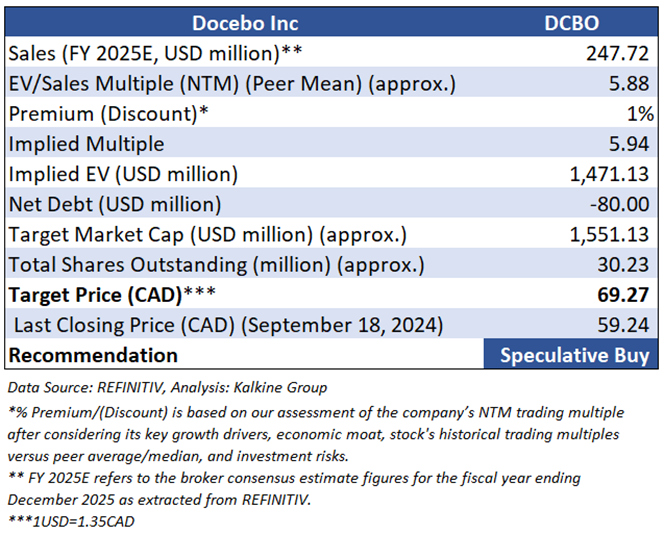
4.1 Valuation Methodology
Valuation Methodology (Illustrative): EV to Sales based.
4.2 Price Performance and Stock Recommendation

The stock has witnessed an upside of ~5.72% in 1 week and ~2.54% over the last 1 month respectively. Moreover, the stock is trading below the average 52-week high price of CAD 76.27 and 52-week low price of CAD 46.09 providing an opportunity to accumulate the stock.

4.3 One-Year Technical Price Chart
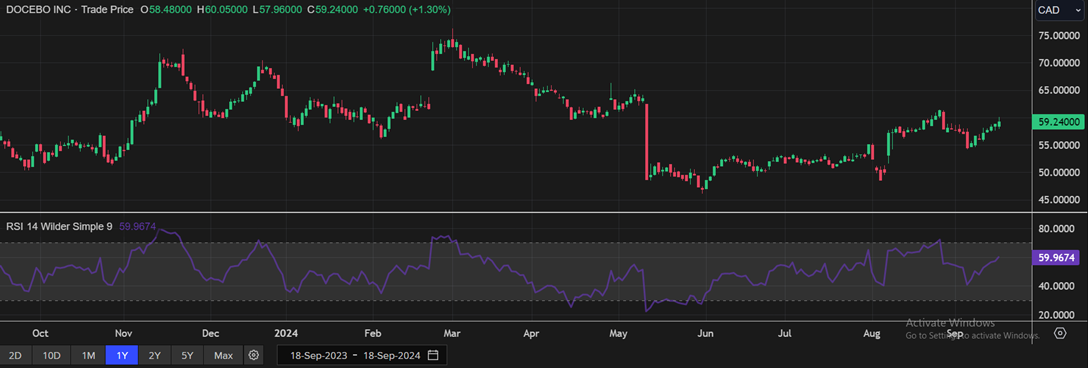
One-Year Technical Price Chart (as of September 18, 2024). Source: REFINITIV, Analysis: Kalkine Group
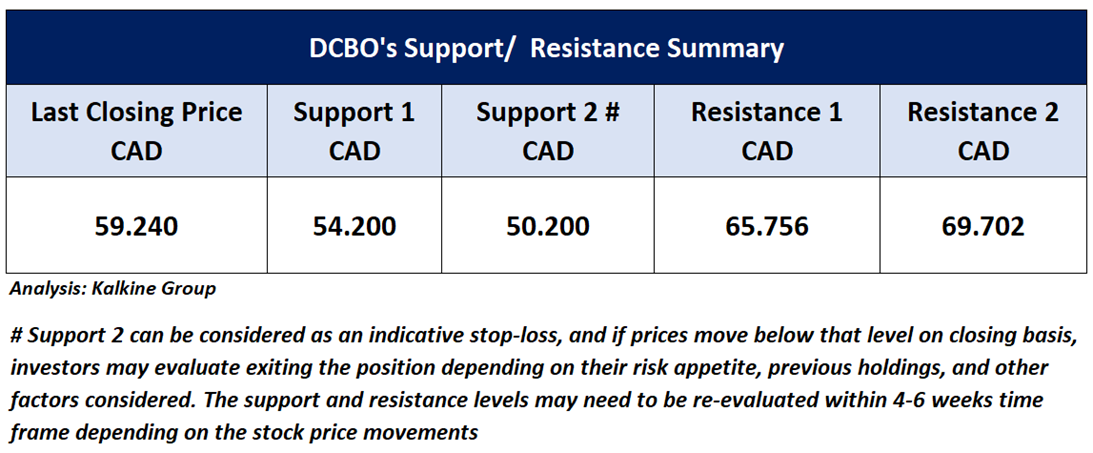
4.4 Technical Summary
Note 1: Past performance is not a reliable indicator of future performance.
Note 2: The reference date for all price data, currency, technical indicators, support, and resistance levels as on September 18, 2024. The reference data in this report has been partly sourced from REFINITIV.
Note 3: Investment decisions should be made depending on an individual's appetite for upside potential, risks, holding duration, and any previous holdings. An 'Exit' from the stock can be considered if the Target Price mentioned as per the Valuation and or the technical levels provided has been achieved and is subject to the factors discussed above.
Note 4: Dividend Yield may vary as per the stock price movement.
Technical Indicators Defined: -
Support: A level at which the stock prices tend to find support if they are falling, and a downtrend may take a pause backed by demand or buying interest.
Resistance: A level at which the stock prices tend to find resistance when they are rising, and the uptrend may take a pause due to profit booking or selling interest.
Stop-loss: In general, it is a level to protect further losses in case of any unfavorable movement in the stock prices.
The advice given by Kalkine Canada Advisory Services Inc. and provided on this website is general information only and it does not take into account your investment objectives, financial situation and the particular needs of any particular person. You should therefore consider whether the advice is appropriate to your investment objectives, financial situation and needs before acting upon it. You should seek advice from a financial adviser, stockbroker or other professional (including taxation and legal advice) as necessary before acting on any advice. Not all investments are appropriate for all people. The website www.kalkine.ca is published by Kalkine Canada Advisory Services Inc. The link to our Terms & Conditions has been provided please go through them. On the date of publishing this report (mentioned on the website), employees and/or associates of Kalkine do not hold positions in any of the stocks covered on the website. These stocks can change any time and readers of the reports should not consider these stocks as advice or recommendations later.
 Please wait processing your request...