

Shopify Inc.
Section1: Company Overview
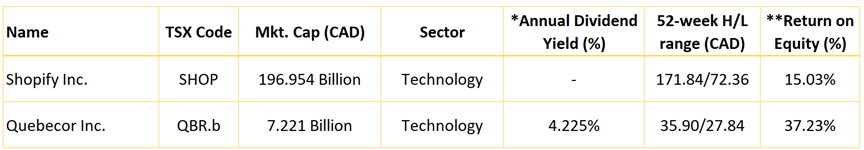
Shopify Inc. (TSX: SHOP) offers an e-commerce platform primarily to small and midsize businesses. The firm has two segments: subscription solutions and merchant solutions, The subscription solutions segment allows Shopify merchants to conduct e-commerce on a variety of platforms, including the company's website, physical stores, pop-up stores, kiosks, social networks (Facebook), and Amazon. Merchant solutions are add-on products for the platform that facilitate e-commerce and include Shopify Payments, Shopify Shipping, and Shopify Capital.
This Report covers the Investment Highlights, Key Financial Metrics, Risks, Technical Analysis along with the Valuation, Target Price, and Recommendation on the stock.
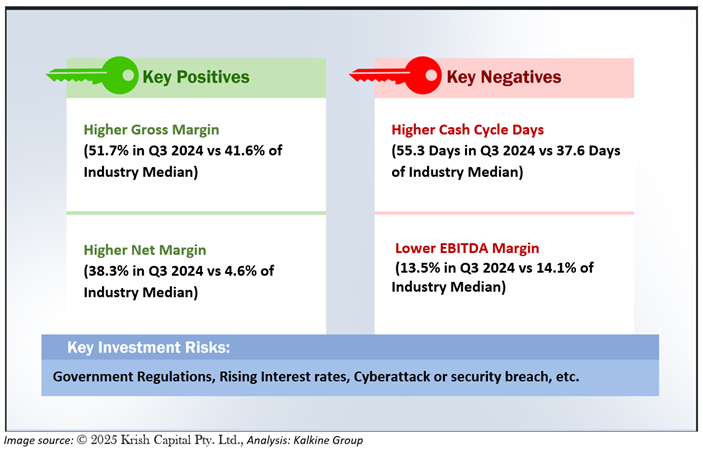
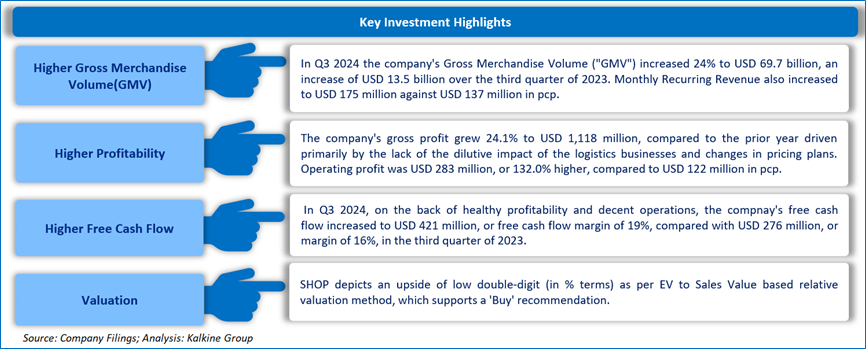
1.1 The Key Positives, Negatives, Investment Highlights, and Risks
Section2: Financial Highlights
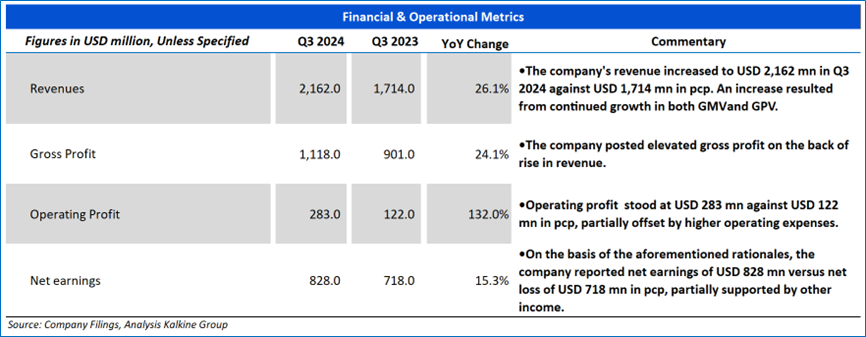
2.1 Key Financial Highlights
Section 3: Key Metrics
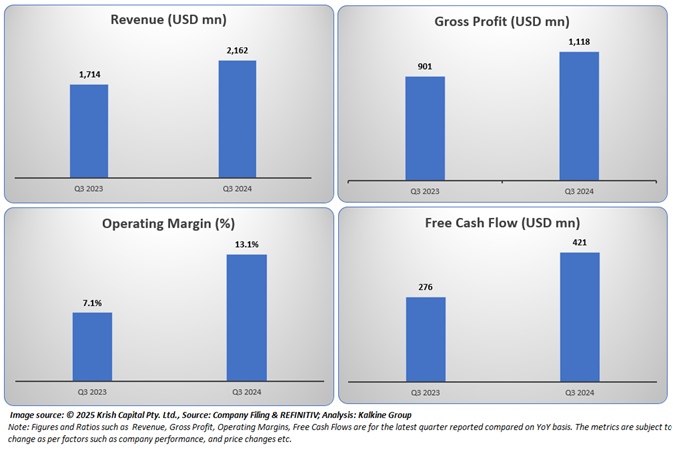
Below charts depict the change in Revenue, Gross Profit, Operating Margin and Free Cash Flow of the Company for the latest reported quarter.
Section 4: Stock Recommendation Summary
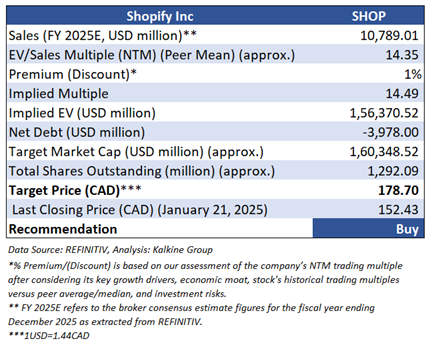
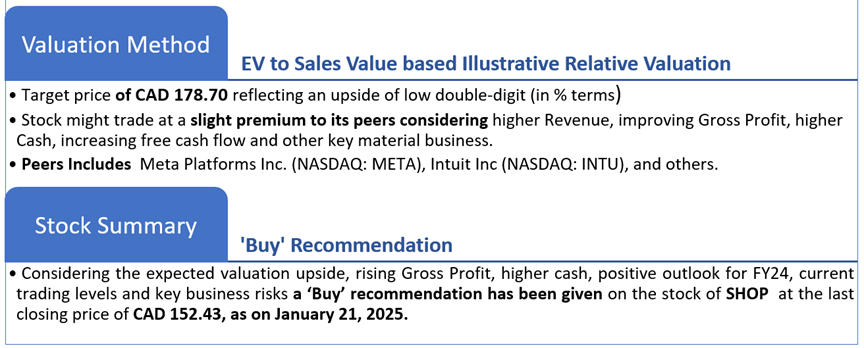
4.1 Valuation Methodology
Valuation Methodology (Illustrative): EV to Sales based.
4.2 Price Performance and Stock Recommendation

The stock has witnessed an upside of ~4.53% in 1 week and a downside of ~2.73% over the last 1 month respectively. Moreover, the stock is trading above the average 52-week high price of CAD 171.84 and 52-week low price of CAD 72.36 providing an opportunity to ride the trend.
4.3 One-Year Technical Price Chart
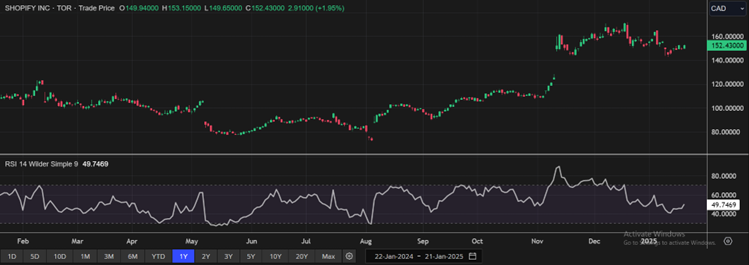
One-Year Technical Price Chart (as of January 21, 2025). Source: REFINITIV, Analysis: Kalkine Group
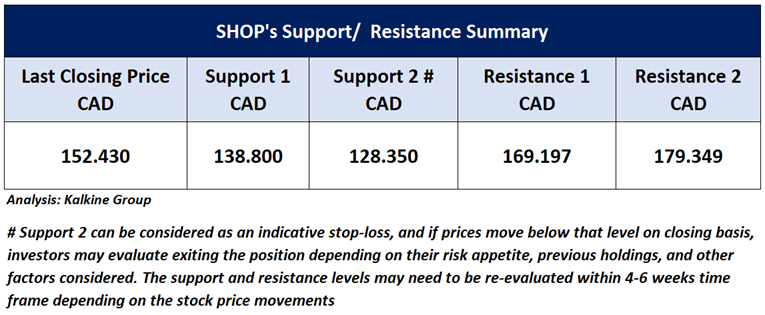
4.4 Technical Summary
Quebecor Inc.
Section1: Company Overview
Quebecor Inc. (TSX: QBR.b) primarily provides mobile and fixed-line telecom services in Quebec where it is the leading telecom provider. With more than 1.8 million internet subscribers Quebecor provides internet service to more than 60% of the homes its network passes. It also has about 1.6 million mobile subscribers representing more than 20% wireless market share in Quebec.
This Report covers the Investment Highlights, Key Financial Metrics, Risks, Technical Analysis along with the Valuation, Target Price, and Recommendation on the stock.
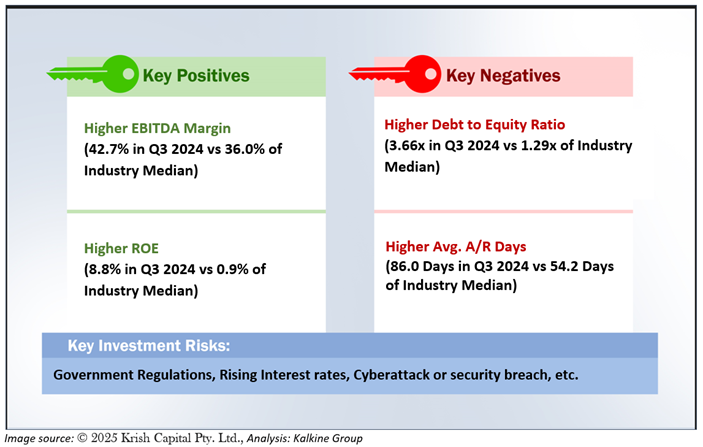
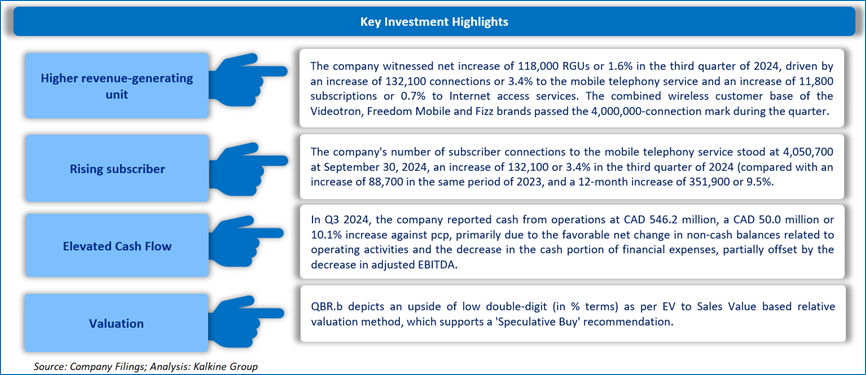
1.2 The Key Positives, Negatives, Investment Highlights, and Risks
Section2: Financial Highlights
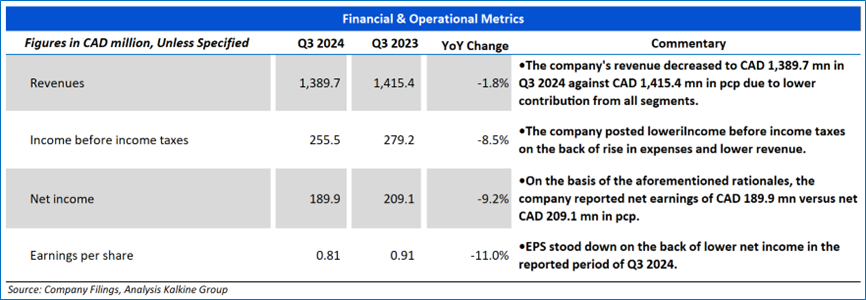
2.1 Key Financial Highlights
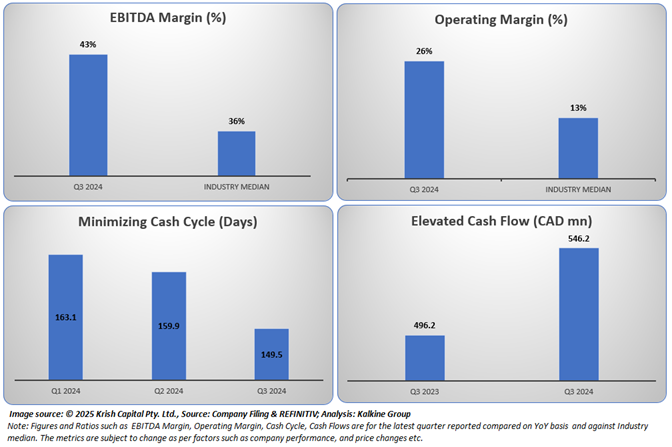
Section 3: Key Metrics
Below charts depict the comparison in EBITDA Margin and Operating Margin against the Industry Median along the minimizing cash cycle days and higher Cash Flow for the latest reported quarter against the pcp.
Section 4: Stock Recommendation Summary
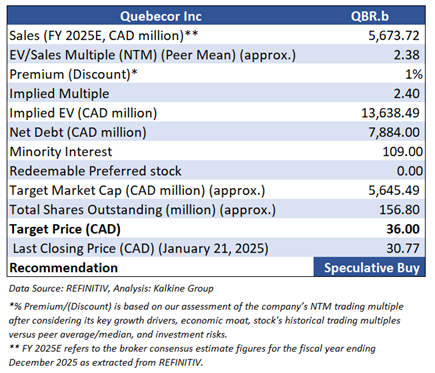
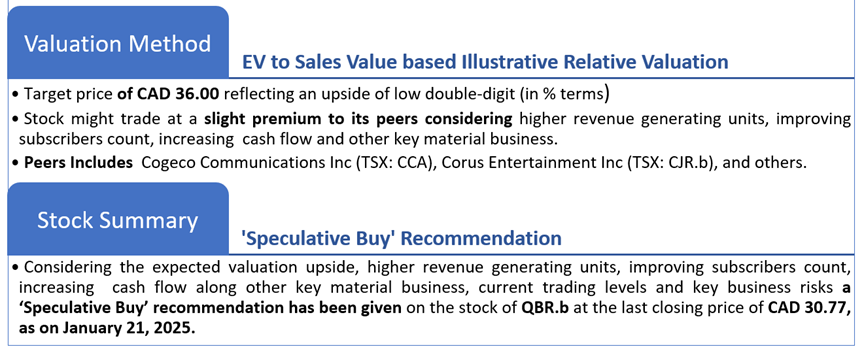
4.1 Valuation Methodology
Valuation Methodology (Illustrative): EV to Sales based.
4.2 Price Performance and Stock Recommendation

The stock has witnessed a downside of ~2.19% in 1 week and ~1.28% over the last 1 month respectively. Moreover, the stock is trading below the average 52-week high price of CAD 35.90 and 52-week low price of CAD 27.84 providing an opportunity to accumulate the stock.
4.3 One-Year Technical Price Chart
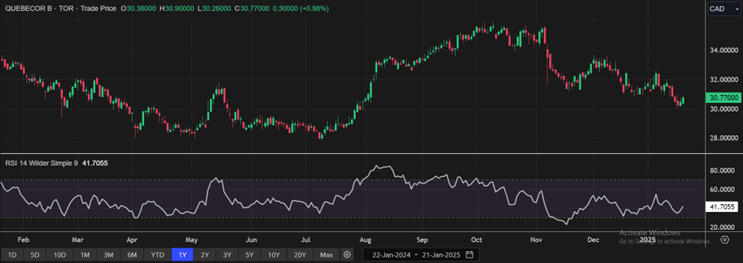
One-Year Technical Price Chart (as of January 21, 2025). Source: REFINITIV, Analysis: Kalkine Group
4.4 Technical Summary
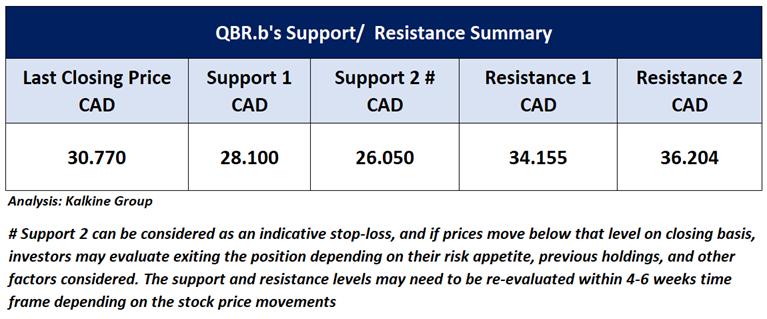
Note 1: Past performance is not a reliable indicator of future performance.
Note 2: The reference date for all price data, and currency as of January 21, 2025. The reference data in this report has been partly sourced from REFINITIV.
Note 3: Investment decisions should be made depending on an individual's appetite for upside potential, risks, holding duration, and any previous holdings. An 'Exit' from the stock can be considered if the Target Price mentioned as per the Valuation and or the technical levels provided has been achieved and is subject to the factors discussed above.
Note 4: Dividend Yield may vary as per the stock price movement.
Note 5: Kalkine reports are prepared based on the stock prices captured either from REFINITIV or Trading View. Typically, REFINITIV or Trading View may reflect stock prices with a delay which could be a lag of 25-30 minutes. There can be no assurance that future results or events will be consistent with the information provided in the report. The information is subject to change without any prior notice.
The advice given by Kalkine Canada Advisory Services Inc. and provided on this website is general information only and it does not take into account your investment objectives, financial situation and the particular needs of any particular person. You should therefore consider whether the advice is appropriate to your investment objectives, financial situation and needs before acting upon it. You should seek advice from a financial adviser, stockbroker or other professional (including taxation and legal advice) as necessary before acting on any advice. Not all investments are appropriate for all people. The website www.kalkine.ca is published by Kalkine Canada Advisory Services Inc. The link to our Terms & Conditions has been provided please go through them. On the date of publishing this report (mentioned on the website), employees and/or associates of Kalkine do not hold positions in any of the stocks covered on the website. These stocks can change any time and readers of the reports should not consider these stocks as advice or recommendations later.
 Please wait processing your request...