SolarEdge Technologies, Inc.
SEDG Details
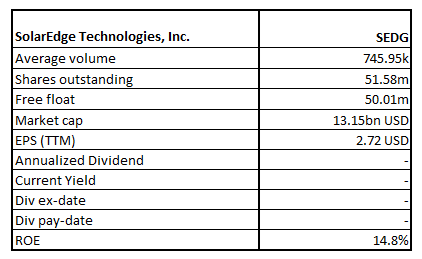
Established in 2006, SolarEdge Technologies, Inc. (NASDAQ: SEDG) develops the DC optimized inverter solution that has changed the way the power is harvested as well as managed in the photovoltaic (PV) systems. The inverter solution optimizes power generation and reduces the cost of energy produced by the PV system. The company has a market capitalization of ~US$13.15 billion as on 21st April 2021.
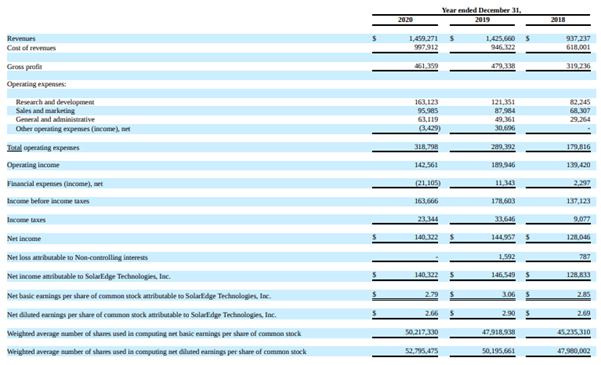
Result Performance – For the Year Ended 31 December 2020 – (FY20)
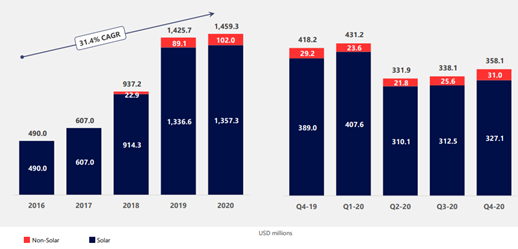
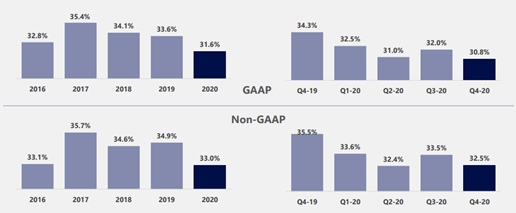
For the year ended 31 December 2020, the revenue of the company increased by 2.4% to $1,459.3 million versus $1,425.7 million in FY19 led by an increase in solar segment revenues by 1.5% YoY to $1,357.3 million, followed by rise in all other segments by 15.5% YoY to $102.8 million. Further, GAAP net income was $140.3 million, down 4% YoY while Non-GAAP net income was $224.4 million, down 4% YoY.
Key Data (Source: Company Reports)
Recent Updates
Risks:
The solar energy industry is evolving rapidly and is very competitive in nature which makes it difficult to assess prospects of the business. The company’s performance is vulnerable to slower demand growth for solar power. In line with this, any decrease in the retail price of electricity resulting from the utility grid or from other energy sources could impact the business, financial condition, results of operations, and prospects. The market for the company’s products faces intense competition and the company anticipates increased competition as new and existing players introduce power optimizers, inverters, solar PV system monitoring and other smart energy products, which could adversely affect the company’s market share.
Outlook:
The company is riding on a strong industry outlook that estimates energy consumption per capita to increase 23% by 2050 and solar energy generation is estimated to rise by a factor of 60 from 2015 to 2050. By 2050 ~⅓rd of the global electricity requirement is estimated to be fulfilled by renewable energy sources.
To capitalize on opportunities, the company has cemented its complete range of residential solutions such as PV, storage, smart energy, and EV charging. The solutions provided by the company are smart energy products, monitoring platforms, smart modules with pre-assembled power optimizers, inverters, and StorEdge, which indicates a complete range of products offering under one umbrella.
Importantly, the company is looking forward to expanding its geographical reach, product segment development, market share, and increase in ARPI in the future.
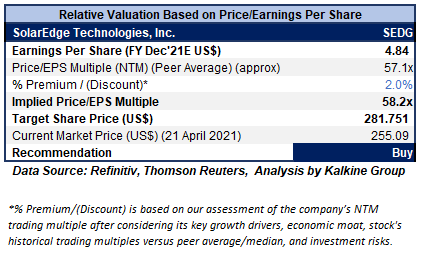
Valuation Methodology: Price/Earnings Per Share Multiple Based Relative Valuation (Illustrative)
Technical Overview:
Weekly Chart –
Source: Refinitiv (Thomson Reuters)
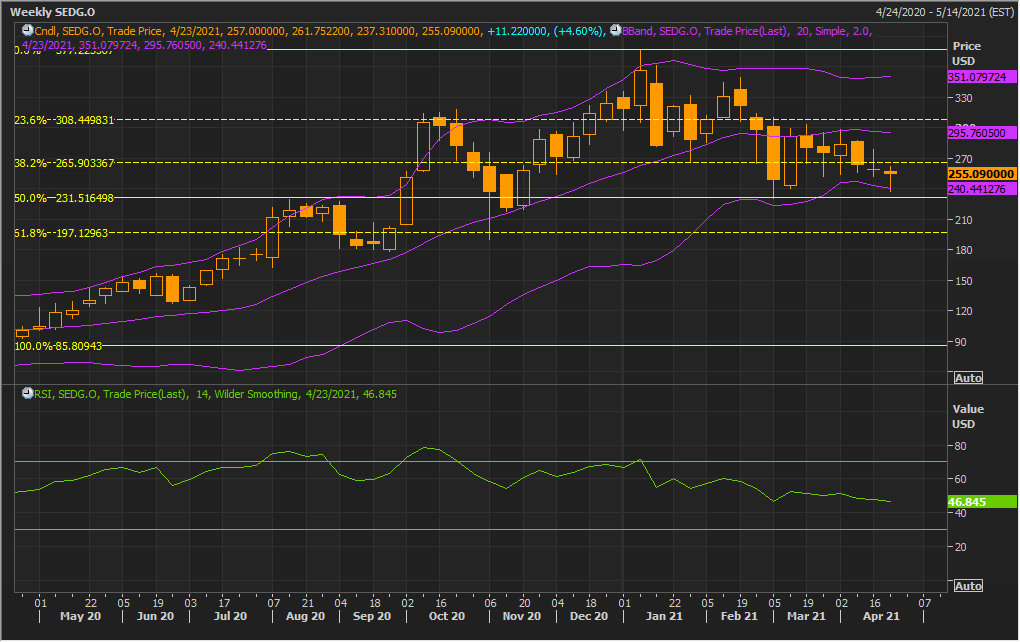
Note: Purple colour lines are Bollinger Bands® with the upper band suggesting overbought status while the lower band oversold status, and yellow lines are Fibonacci retracement lines which measure price rebound and backtrack. https://www.bollingerbands.com/
The stock though has given a softer close for the ongoing week, but it is with a ‘Hammer’ formed on the weekly chart which signals short-term bullish reversal. The technical indicator RSI with a reading around 47 indicates gaining of bullish momentum for the stock.
Going forward, the stock may have resistance around 20 periods SMA of $295.76 whereas support could be around 50% retracement level of $231.52.
Stock Recommendation:
The stock has witnessed a fall of ~14.1% in 3 months and over the last 6 months, it has decreased by ~8.76%. However, the stock reported an increase of ~45.22% in 9 months and an increase of triple digit ~194.25% in 1 year.
The stock has made a 52-week low and high of US$85.69 and US$377.00, respectively and is currently trading above the average of 52-week high-low range.
Considering the aforesaid facts, we have valued the stock using a P/E multiple-based illustrative relative valuation and have arrived at a target price which reflects a rise of low double-digit (in % terms). We believe the company can trade at a slight premium to its P/E Multiple (NTM) (Peer Average) considering the decent liquidity position which could help the company meet its capital requirements in the process of development.
However, the investors should keep an eye on risks related to the competitive nature of the solar industry and sustained pressure on margin.
Considering the aforesaid facts, we give a “Buy” recommendation on the stock at the current market price of US$255.09 per share, up by 4.6% on 21st April 2021.
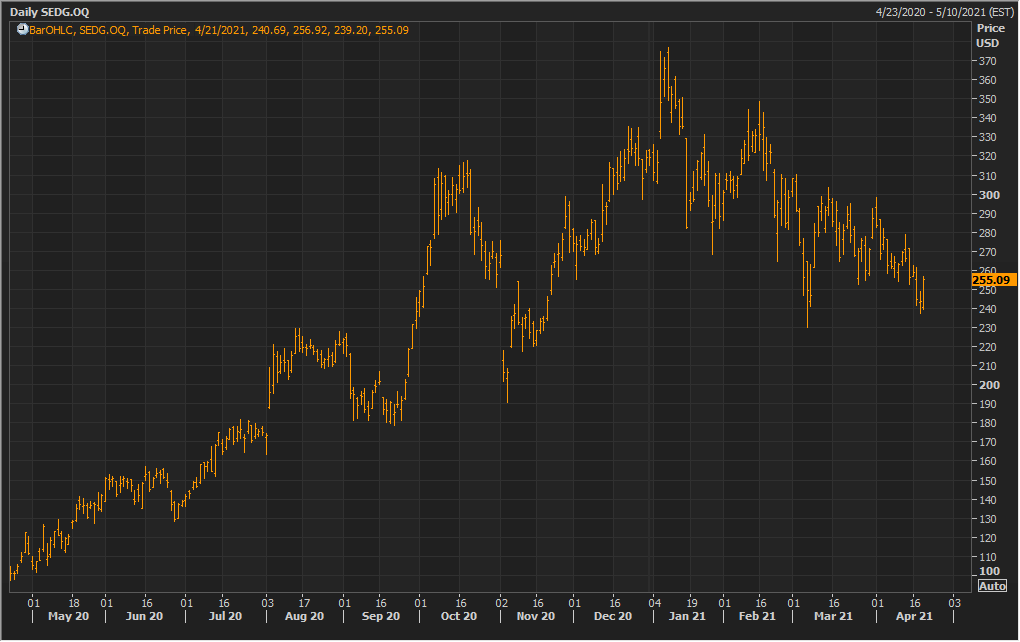
SEDG Daily Technical Chart (Source: Refinitiv (Thomson Reuters))
Array Technologies, Inc.
ARRY Details
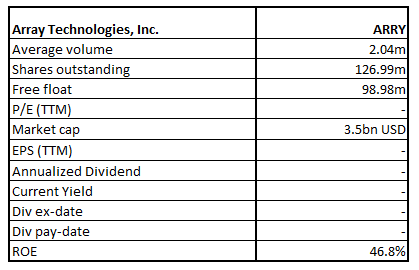
Array Technologies, Inc. (NASDAQ: ARRY) is one of the world’s largest manufacturers and suppliers of ground-mounting systems that is used in solar energy projects. It is an integrated system of steel supports, electric motors, gearboxes and electronic controllers to maintain an optimal orientation to the sun, which phenomenally boosts energy production. The company has a market capitalization of ~US$3.5 billion as on 21st April 2021.
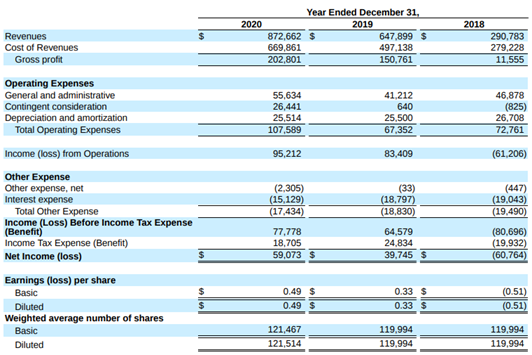
Result Performance – For the Year Ended 31 December 2020 – (FY20)
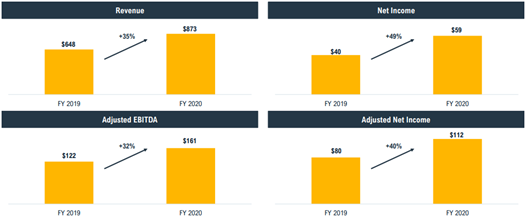
For the year ended 31 December 2020, the revenue of the company jumped by 34.7% to $872.7 million versus $647.9 million in FY19 led by an increase in over-time revenues by 43.9% YoY to $863.3 million while point in time revenues fell by 80.6% YoY to $9.3 million. From the perspective of the geographical segment, the USA reported a rise of 43.0% YoY to $805.1 million, while revenue from Australia and the Rest of the World fell by 12.3% and 32.6% YoY, respectively.
Key Data (Source: Company Reports)
Recent Updates
Risks:
The growth of the company is directly linked with the growth momentum of solar energy projects and hence, any adverse impact will directly affect the business of the company. The feasibility and demand for solar energy are impacted by cost competitiveness, consistency and presentation of solar energy systems compared to non-solar renewable energy, government subsidies, and prices of traditional carbon-based energy sources. Further, any loss of significant customers could harm the business and adversely impact the revenue. In line with this, a slide in the price of electricity resulting from the utility grid or alternative energy sources may adversely impact the business. Importantly, any interruption in the flow of raw materials from international vendors could disrupt the supply chain.
Outlook:
The management is optimistic about its product offering such as mounting system that rotates during the day to align the solar panel at an accurate angle to the sun to make the best use of power production. Further, the fixed tilt system has no moving parts and the angle of the solar panel to the sun is static at the time of installation. In line with this, the tracker system reverberates with customers across major IPPs and utilities, large developers and EPCs. Importantly, the solar systems are faster to construct and less inconsistent than wind and becoming the preferred source of generation in many geographies. The company is focused on expanding its reach in the US market, international expansion, acquisition and product innovation to boost its top-line growth perspective for future periods.
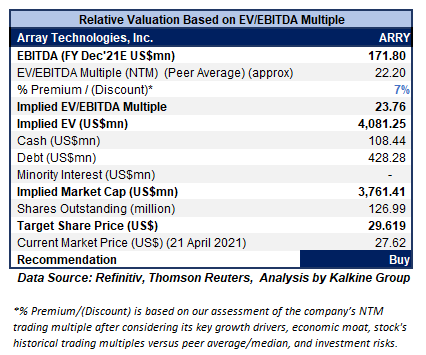
Valuation Methodology: EV/EBITDA Multiple Based Relative Valuation (Illustrative)
Technical Overview:
Weekly Chart –
Source: Refinitiv (Thomson Reuters)
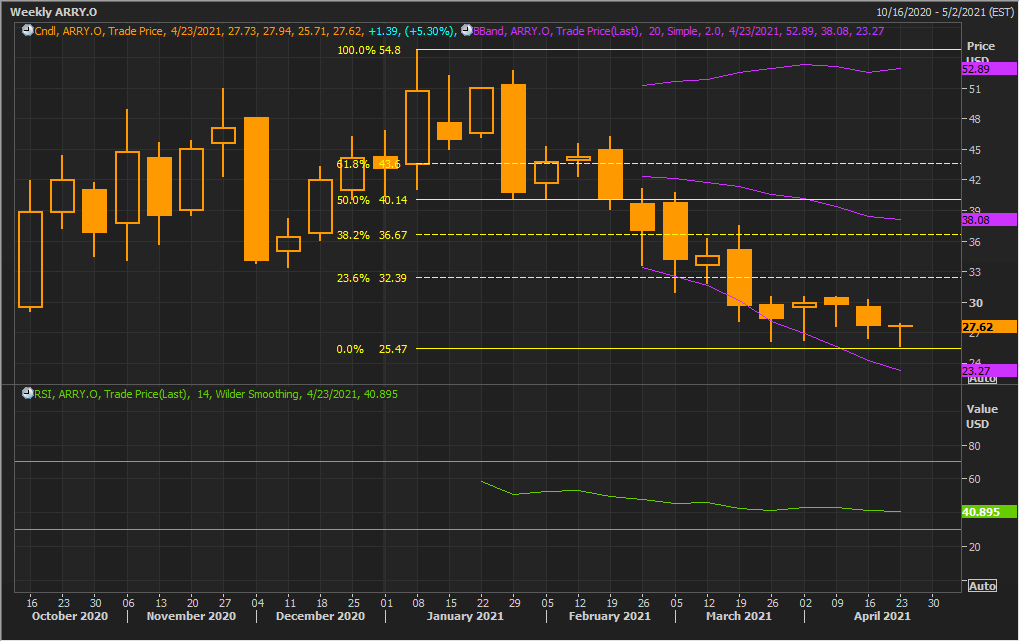
Note: Purple colour lines are Bollinger Bands® with the upper band suggesting overbought status while the lower band oversold status, and yellow lines are Fibonacci retracement lines which measure price rebound and backtrack. https://www.bollingerbands.com/
The stock though has given a softer close for the ongoing week, but with ‘Dragon Fly’ candle formed on the weekly chart which signal a potential bullish reversal in a down trending market. The technical indicator RSI with a reading around 41 suggests neutral momentum for the stock.
Going forward, the stock may have resistance around the 23.6% retracement level of $32.39 whereas support could be around the weekly low of $25.71.
Stock Recommendation:
The stock has witnessed a fall of ~42.69% in 3 months and over the last 6 months, it has decreased by ~29.79%. The stock has made a 52-week low and high of US$26.02 and US$54.78, respectively and is currently trading below the average of 52-week high-low range.
Considering the aforesaid facts, we have valued the stock using an EV/EBITDA multiple-based illustrative relative valuation and have arrived at a target price which reflects a rise of high single-digit (in % terms). We believe the company can trade at a slight premium to its EV/EBITDA Multiple (NTM) (Peer Average) considering stable margin, high returns, and availability of sufficient liquidity to cover short-term funding needs.
However, the investors should keep an eye on related risks like the rapidly evolving and competitive nature of the solar industry and sustained government regulations.
Considering the aforesaid facts, we give a “Buy” recommendation on the stock at the current market price of US$27.62 per share, up by 5.3% on 21st April 2021.
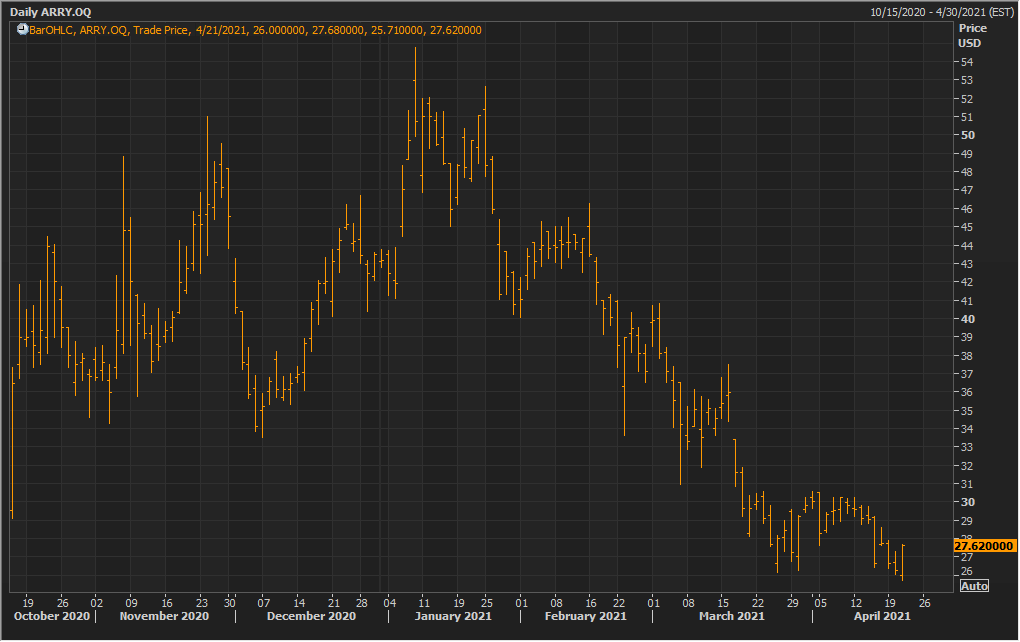
ARRY Daily Technical Chart (Source: Refinitiv (Thomson Reuters))
Note: Investment decision should be made depending on the investors’ appetite on upside potential, risks, holding duration, and any previous holdings. Investors can consider exiting from the stock if the Target Price mentioned as per the Valuation has been achieved and subject to the factors discussed above.
Disclaimer
The advice given by Kalkine Canada Advisory Services Inc. and provided on this website is general information only and it does not take into account your investment objectives, financial situation and the particular needs of any particular person. You should therefore consider whether the advice is appropriate to your investment objectives, financial situation and needs before acting upon it. You should seek advice from a financial adviser, stockbroker or other professional (including taxation and legal advice) as necessary before acting on any advice. Not all investments are appropriate for all people. The website www.kalkine.ca is published by Kalkine Canada Advisory Services Inc. The link to our Terms & Conditions has been provided please go through them. On the date of publishing this report (mentioned on the website), employees and/or associates of Kalkine do not hold positions in any of the stocks covered on the website. These stocks can change any time and readers of the reports should not consider these stocks as advice or recommendations later.
 Please wait processing your request...