SolarEdge Technologies, Inc.
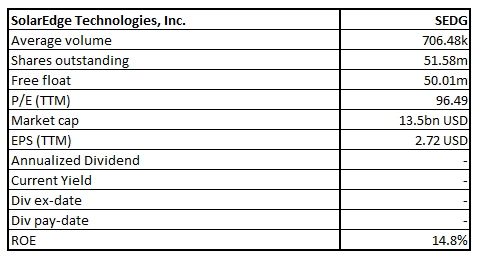
SEDG Details
Established in 2006, SolarEdge Technologies, Inc. (NASDAQ: SEDG) developed the DC optimized inverter solution which changed the way the power is harvested as well as managed in the photovoltaic (PV) systems. The company has a market capitalization of ~US$13.5 billion as on 7th April 2021.
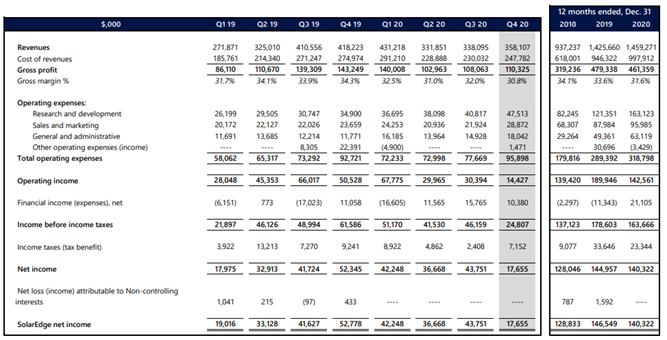
Result Performance – For the Financial Year and Quarter Ended 31 December 2020 – (FY20 and Q4FY20)
The company has garnered revenue of $358.1 million in Q4FY20 which translated into a revenue generation of $1.46 billion in FY20. The company witnessed significant revenue from solar products of $1.36 billion in FY20. Further, the gross margin reduced to 31.6% in FY20 from 33.6% in FY19 in GAAP terms. Finally, the GAAP net income decreased by 4% YoY to $140.3 million.
Key Data (Source: Company Reports)
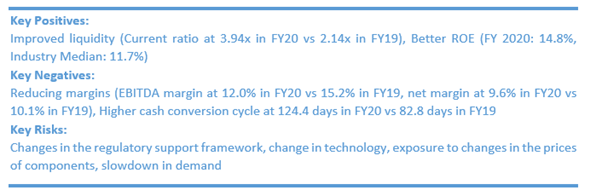
Risks:
The company is in the industry where competition is high and the industry rapidly evolves which places the company at a tight spot to continuously evaluate future prospects. Also, if the demand for the solar energy solutions does not continue to grow or the demand grows at the slower rate, the business as well as results of operations would suffer.
In line with this, any decrease in retail price of electricity resulting from the utility grid or from other energy sources could impact business, financial condition, results of operations, and prospects.
The market for the company’s products faces intense competition and the company anticipates increased competition as new and existing players introduce power optimizers, inverters, solar PV system monitoring and other smart energy products, which could adversely affect the company’s market share.
Outlook:
The company expects that its revenue in Q1FY21 would be in the range of $385 million to $405 million and revenue from solar products is expected to be between $360 million to $375 million. Further, it expects its gross margin in Non-GAAP terms to be between 34% to 36%.
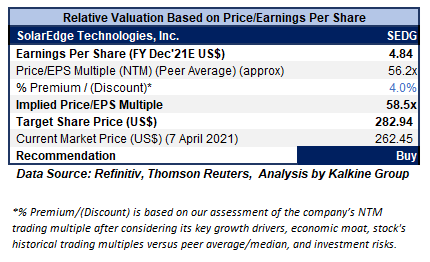
Valuation Methodology: Price/Earnings Per Share Multiple Based Relative Valuation (Illustrative)
Stock Recommendation:
The stock has witnessed a fall of ~24.6% in 3 months and over the last 6 months, it has decreased by ~14.0%. However, the stock reported an increase of ~66.2% in 9 months and an increase of triple digit ~195.5% in 1 year.
The stock has made a 52-week low and high of US$85.69 and US$377.00, respectively and is currently trading above the average of 52-week high-low range.
Considering the aforesaid facts, we have valued the stock using a P/E multiple-based illustrative relative valuation and have arrived at a target price which reflects a rise of high single-digit (in % terms). We believe the company can trade at a slight premium to its Price/EPS Multiple (NTM) (Peer Average) considering the decent liquidity position which could help the company in navigating tough conditions.
However, the investors should keep an eye on related risks like the rapidly evolving and competitive nature of the solar industry and sustained pressure on margin.
Considering the aforesaid facts, we give a “Buy” recommendation on the stock at the current market price of US$262.45 per share, down by 5.34% on 7th April 2021.
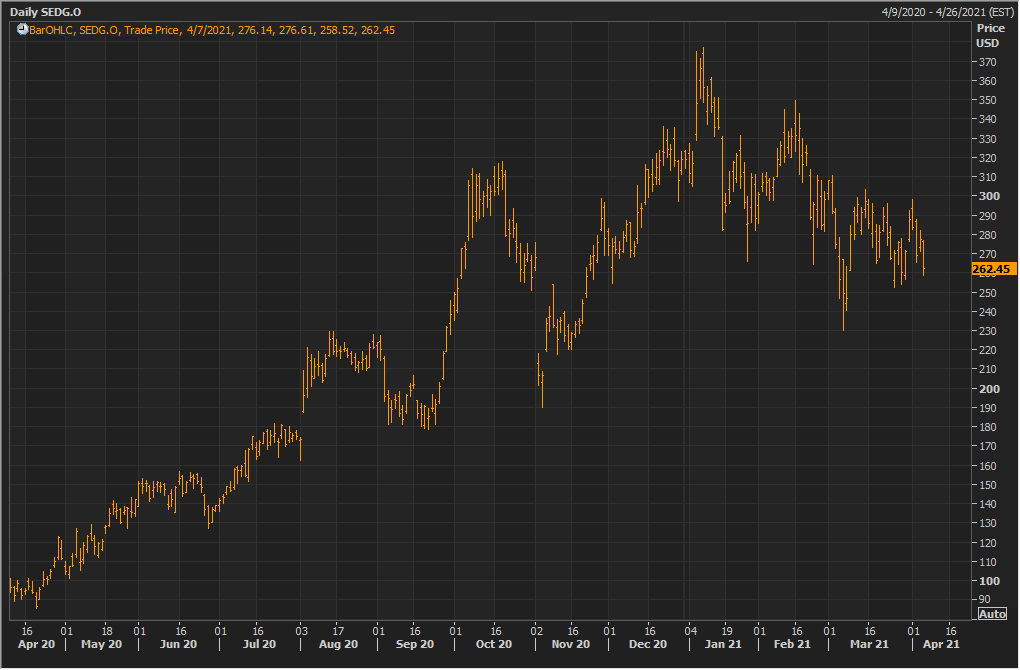
SEDG Daily Technical Chart (Source: Refinitiv (Thomson Reuters))
Note: Investment decision should be made depending on the investors’ appetite on upside potential, risks, holding duration, and any previous holdings. Investors can consider exiting from the stock if the Target Price mentioned as per the Valuation has been achieved and subject to the factors discussed above.
Disclaimer
The advice given by Kalkine Canada Advisory Services Inc. and provided on this website is general information only and it does not take into account your investment objectives, financial situation and the particular needs of any particular person. You should therefore consider whether the advice is appropriate to your investment objectives, financial situation and needs before acting upon it. You should seek advice from a financial adviser, stockbroker or other professional (including taxation and legal advice) as necessary before acting on any advice. Not all investments are appropriate for all people. The website www.kalkine.ca is published by Kalkine Canada Advisory Services Inc. The link to our Terms & Conditions has been provided please go through them. On the date of publishing this report (mentioned on the website), employees and/or associates of Kalkine do not hold positions in any of the stocks covered on the website. These stocks can change any time and readers of the reports should not consider these stocks as advice or recommendations later.
 Please wait processing your request...