
SolarEdge Technologies, Inc.
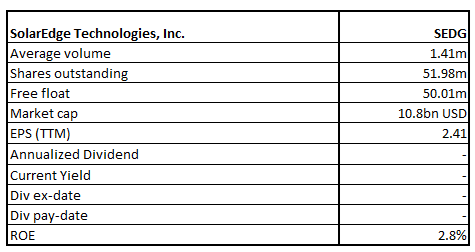
SEDG Details
SolarEdge Technologies, Inc. (NASDAQ: SEDG) is a top global player in smart energy technology. It caters to the requirements of various energy market segments through the diversified product offerings such as through its PV, storage, EV charging, batteries, UPS, electric vehicle powertrains, and grid services solutions.
Annual Performance (For the Year Ended 31 December 2020)
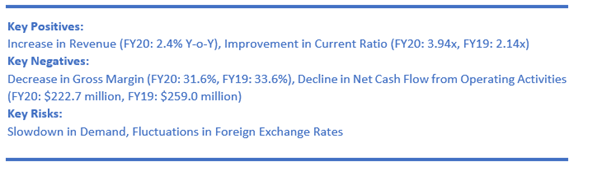
The company has witnessed a 6% increase in revenue to $358.1 million in Q4FY20 which contributed to a record revenue generation of $1.46 billion in FY20, an increase of 2.4% YoY. Record revenue of $1.36 billion was generated from solar products in FY20. However, operating income in FY20 declined by 25% YoY to $142.6 million in GAAP terms. Resultantly, GAAP net income of the company in FY20 decreased by 3.2% to $140.3 million.
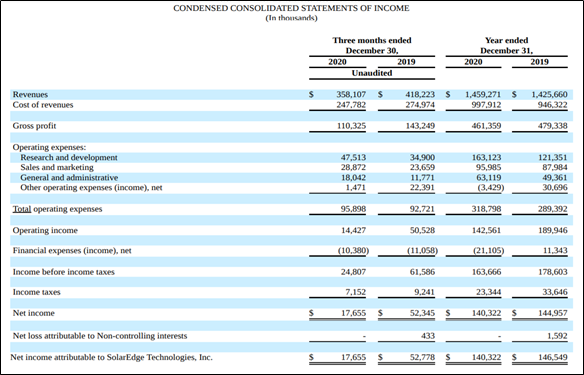
Consolidated Condenses Income Statement (Source: Company Reports)
Q1FY21 Results Performance (For the Quarter Ended March 31, 2021)
SEDG has recorded a 13% QoQ growth in revenues to $405.5 million as against $358.1 million in the prior quarter but it declined by 6% YoY as compared to the same quarter last year. Revenue from the sale of solar products increased by 15% to $376.4 million on QoQ but decreased by 8% YoY against the same quarter last year. In GAAP terms, operating income increased by 206% to $44.1 million on QoQ but declined by 35% YoY on the same quarter previous year. GAAP net income increased by 70% QoQ to $30.1 million but declined by 29% YoY on the same quarter last year.
Key Risk
The company is exposed to the risk of the rapidly evolving and competitive nature of the solar industry and sustained pressure on gross margin.
Outlook
SEDG has provided guidance for Q2FY21 whereby it expects revenues in Q2FY21 to stay in between $445 million to $465 million with revenues from solar products to remain in the range of $405 million to $420 million. Further, it has also provided guidance on the gross margin in Non-GAAP terms to be in the range of 32% to 34%.
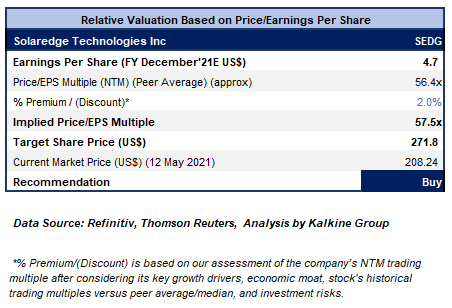
Valuation Methodology: Price/Earnings Per Share Multiple Based Relative Valuation (Illustrative)
Technical Overview:
Weekly Chart –
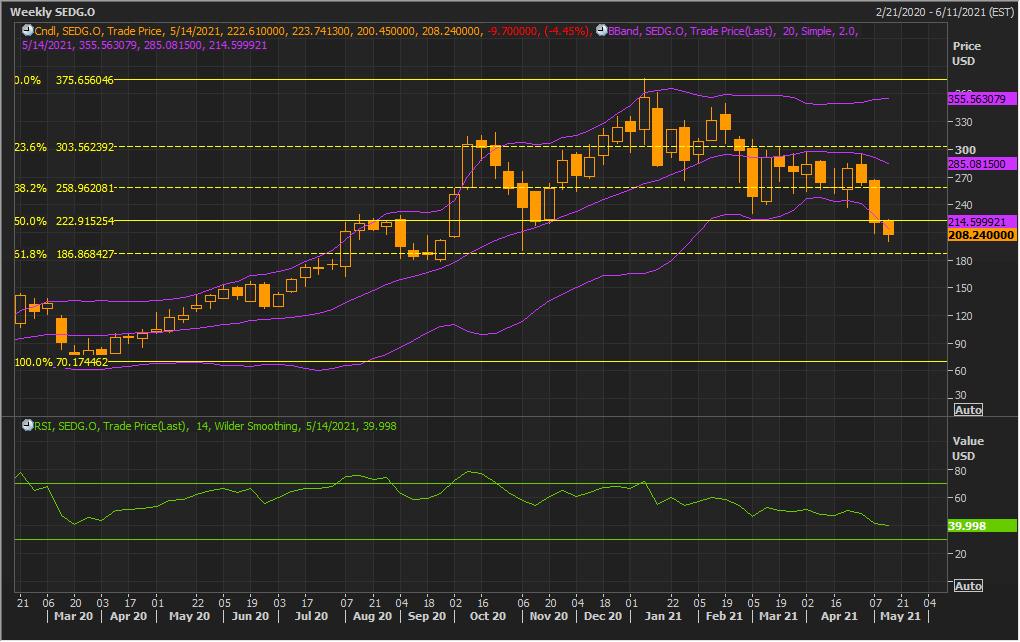
Source: Refinitiv (Thomson Reuters)
Note: Purple colour lines are Bollinger Bands® with the upper band suggesting overbought status while the lower band oversold status, and yellow lines are Fibonacci retracement lines which measure price rebound and backtrack. https://www.bollingerbands.com/
The ongoing week is proving to be third consecutive weeks of the stock sell-off having given close around its weekly low of $200.45 at $208.24. The technical indicator RSI with a reading around 40 and a flattish curve at the end, suggests flattening of bearish momentum. Thus, we see divergence in price movements and the performance of advance indicator of RSI that signals at reversal in the direction of stock price.
Going forward, the stock may have resistance around the 38.2% retracement level of $258.96 whereas support could be around the 61.8% retracement level of $186.86.
Stock Recommendation
The company’s Q1FY21 results reflect on further strengthening of growth momentum which was built during Q4FY20. It continued to witness growth in the solar business across geographies and segments. Driven by the operational performance in Q1FY21, it is expecting to meet the sustained rise in demand for the residential and commercial products worldwide.
The stock declined by ~11.4% in 6 months and by ~35% in 3 months. It has made a 52-week low and high of $112.01 and $377.00, respectively.
Considering the aforesaid facts, we have valued the stock using a P/E multiple-based illustrative relative valuation and have arrived at a target price which reflects a rise of low double-digit (in % terms). We believe the company can trade at a slight premium to its P/E Multiple (NTM) (Peer Average) considering the better liquidity position and growth in revenue.
Considering the sustained focus towards growing in new markets, healthy liquidity position, and decent outlook, we give a “Buy” recommendation at the current market price of US$208.24 per share, down by 4.45% on 12th May 2021.
Note: Investment decision should be made depending on the investors’ appetite on upside potential, risks, holding duration, and any previous holdings. Investors can consider exiting from the stock if the Target Price mentioned as per the Valuation has been achieved and subject to the factors discussed above.
Disclaimer
The advice given by Kalkine Canada Advisory Services Inc. and provided on this website is general information only and it does not take into account your investment objectives, financial situation and the particular needs of any particular person. You should therefore consider whether the advice is appropriate to your investment objectives, financial situation and needs before acting upon it. You should seek advice from a financial adviser, stockbroker or other professional (including taxation and legal advice) as necessary before acting on any advice. Not all investments are appropriate for all people. The website www.kalkine.ca is published by Kalkine Canada Advisory Services Inc. The link to our Terms & Conditions has been provided please go through them. On the date of publishing this report (mentioned on the website), employees and/or associates of Kalkine do not hold positions in any of the stocks covered on the website. These stocks can change any time and readers of the reports should not consider these stocks as advice or recommendations later.
 Please wait processing your request...