
SolarEdge Technologies
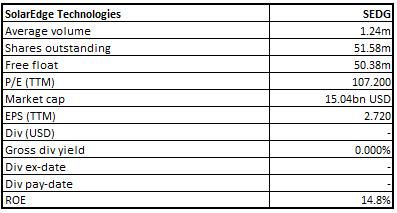
SEDG Details
Global leader in smart energy, SolarEdge Technologies (NASDAQ: SEDG) creates smart energy solutions that drive future progress by leveraging world-class engineering capabilities and with emphasis on innovation. Its market capitalization as on March 3, 2021, stood at ~$15.04 billion.
Results Performance (Year ended 31 December 2020)
The company reported record revenue of $1.46 billion, up 2% compared to $1.43 billion in the previous year, mainly driven by revenues of $1.36 billion from solar products. GAAP gross margin of the company for the full year stood at 31.6%. GAPP Net income for the full year period stood at $140.3 million, down 4% compared with $146.5 million in the prior year. GAAP net diluted earnings per share for the period stood at $2.66. The cash flow from operating activities stood at $222.7 million, down from $259 million the previous year.
For the fourth quarter, the company reported revenue of $358.1 million, up 6% on QoQ but down 14% on YoY basis. Revenues from solar products for the period stood at $327.1 million, up 5% on QoQ but down 16% on YoY basis. GAAP net income for the period stood at $17.7 million, down 60% on QoQ and down 67% on YoY basis. GAPP net income was impacted by a rise in GAPP operating expenses by 15% on QoQ and YoY basis.
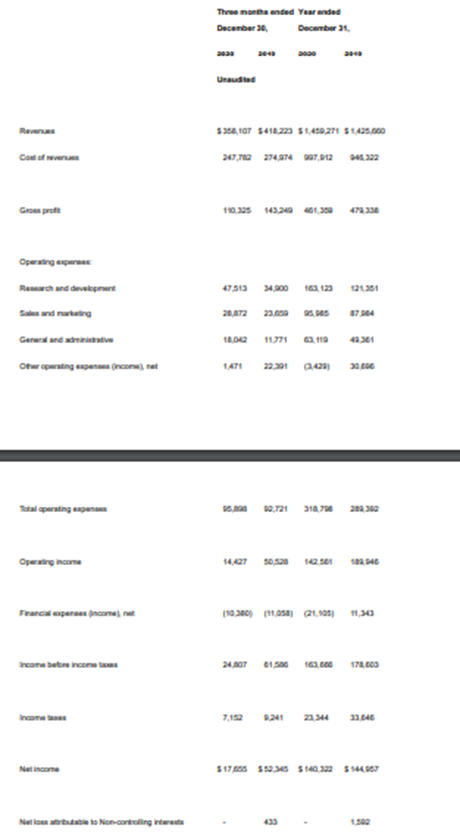
Income Statement (Source: Company Reports)
Outlook
The company anticipates that its first quarter (ending March 31, 2021) revenues to be within the range of $385 million to $405 million, with revenues from solar products to be within the range of $360 million to $375 million. Non-GAAP gross margin is expected to be within the range of 34% to 36%, with Non-GAAP gross margin from the sale of solar products expected to be within the range of 36% to 38%.
Valuation Methodology: PE Multiple Based Relative Valuation (illustrative)
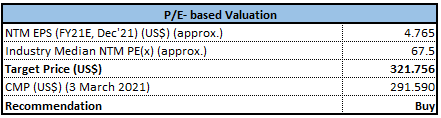
PE Multiple Based Relative Valuation (Source: Refinitiv (Thomson Reuters))
Note: All forecasted figures and peers have been taken from Thomson Reuters, NTM-Next Twelve Months
Technical Overview:
Weekly Chart –
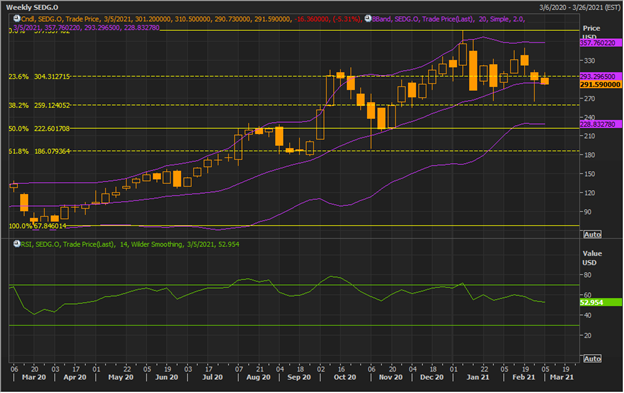
Source: Refinitiv (Thomson Reuters)
Note: Purple colour lines are Bollinger Bands® with the upper band suggesting overbought status while the lower band oversold status, and yellow lines are Fibonacci retracement lines which measure price rebound and backtrack. https://www.bollingerbands.com/
The stock for the ongoing week has given close below the 23.6% retracement level of $304.31 at $291.59. The technical indicator RSI with a reading around 53 and a curve at the end pointing down, suggests a weakening of bullish momentum.
Going forward, the stock may have resistance around $330 whereas support could be around the 38.2% retracement level of $259.12.
Stock Recommendation:
The company’s net margin for FY20 stood at 9.6%, better than the industry median of 8.9%. ROE for FY20 stood at 14.8%, better than the industry median of 10.5%, implying that the company generated a better return for its shareholders than its peer group. The current ratio for FY20 stood at 3.94x, better than the industry median of 3.14x, implying that the company possesses better capabilities to meet its short-term obligations than its peer group. Its Return on Invested Capital (ROIC) for the period stood at 9.2%, better than the FY19 result of 16.1%.
Considering the aforesaid facts, we give a “Buy” recommendation on the stock at the current market price of US$291.59 per share down 5.31% as on March 3, 2021.
.png)
SEDG Daily Technical Chart (Source: Refinitiv (Thomson Reuters))
Disclaimer
The advice given by Kalkine Canada Advisory Services Inc. and provided on this website is general information only and it does not take into account your investment objectives, financial situation and the particular needs of any particular person. You should therefore consider whether the advice is appropriate to your investment objectives, financial situation and needs before acting upon it. You should seek advice from a financial adviser, stockbroker or other professional (including taxation and legal advice) as necessary before acting on any advice. Not all investments are appropriate for all people. The website www.kalkine.ca is published by Kalkine Canada Advisory Services Inc. The link to our Terms & Conditions has been provided please go through them. On the date of publishing this report (mentioned on the website), employees and/or associates of Kalkine do not hold positions in any of the stocks covered on the website. These stocks can change any time and readers of the reports should not consider these stocks as advice or recommendations later.
 Please wait processing your request...