

Section1: Company Overview
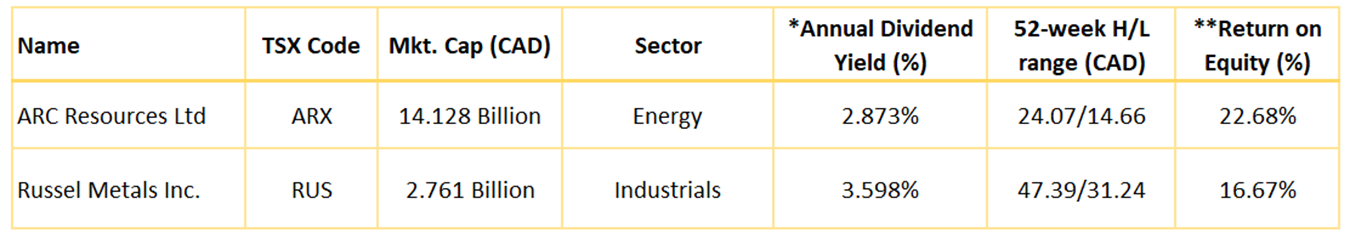
ARC Resources (TSX: ARX) is an independent energy company engaged in the acquisition, exploration, development, and production of conventional oil and natural gas in Western Canada. The company produces light, medium, and heavy crude, condensate, natural gas liquids, and natural gas. This Report covers the Investment Highlights, Key Financial Metrics, Risks, Technical Analysis along with the Valuation, Target Price, and Recommendation on the stock.
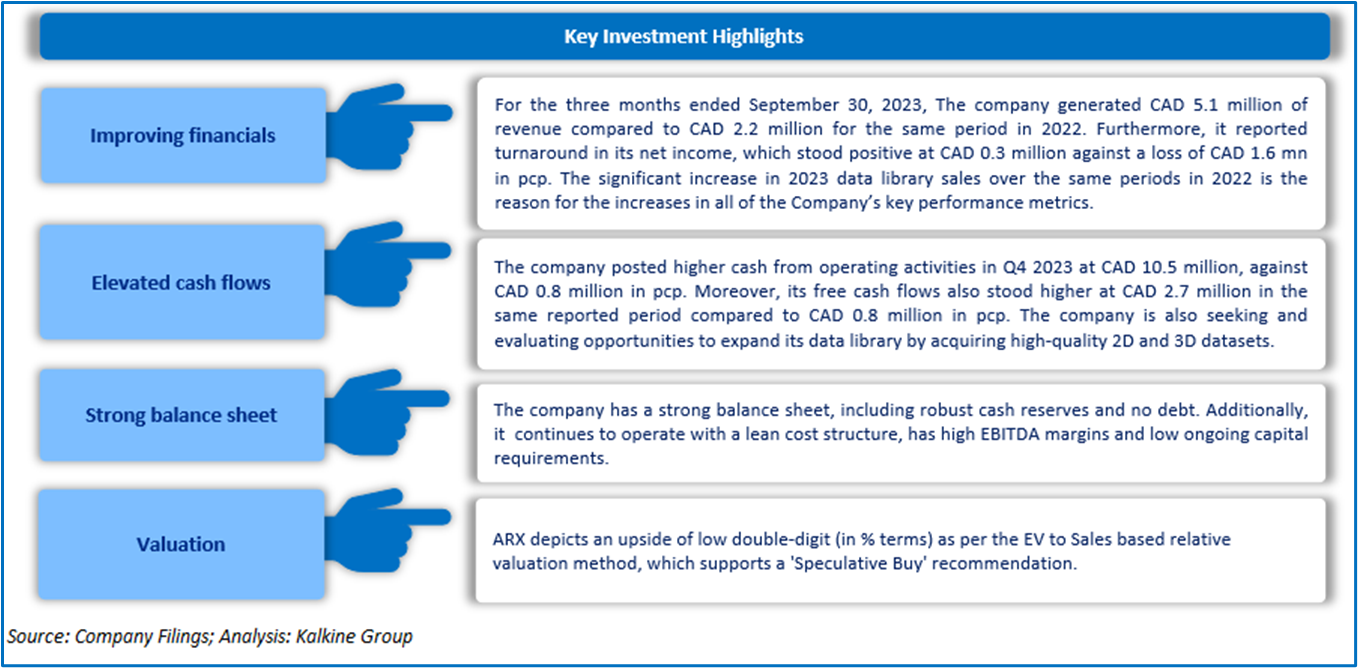
1.1 The Key Positives, Negatives, Investment Highlights, and Risks

Section 2: Stock Recommendation Summary
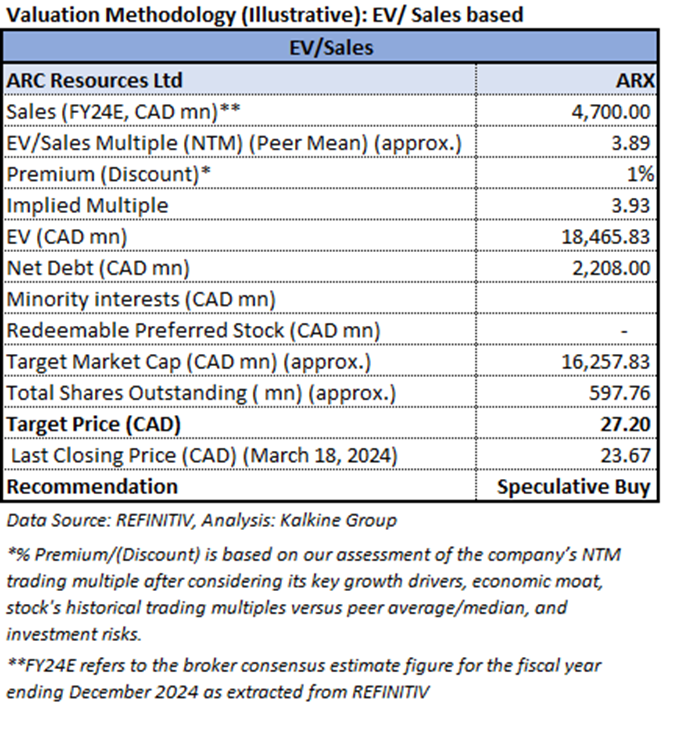
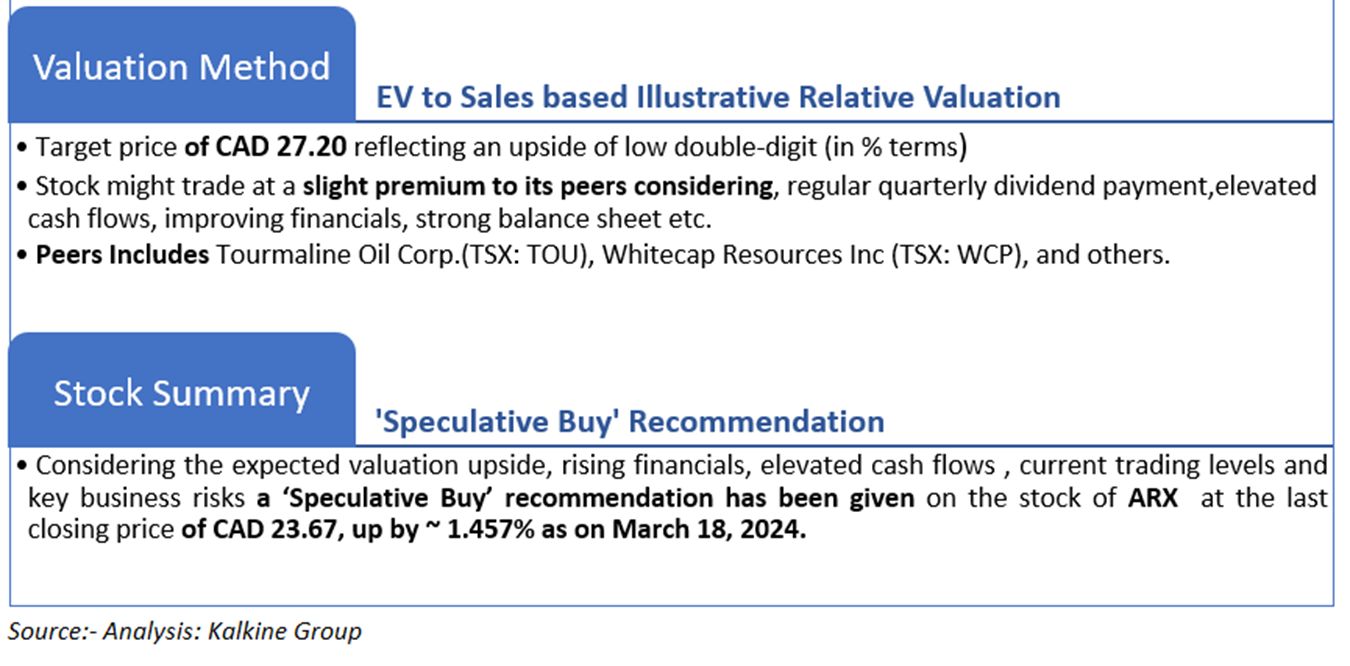
2.1 Valuation Methodology
2.2 Price Performance and Stock Recommendation

The stock has witnessed an upside of ~5.66% in 1 month and an upside of ~21.94% over the last 3 months. Moreover, the stock is trading above the average 52-week high price of CAD 24.07 and 52-week low price of CAD 14.66 providing an opportunity to ride the trend.
3.3 One-Year Technical Price Chart
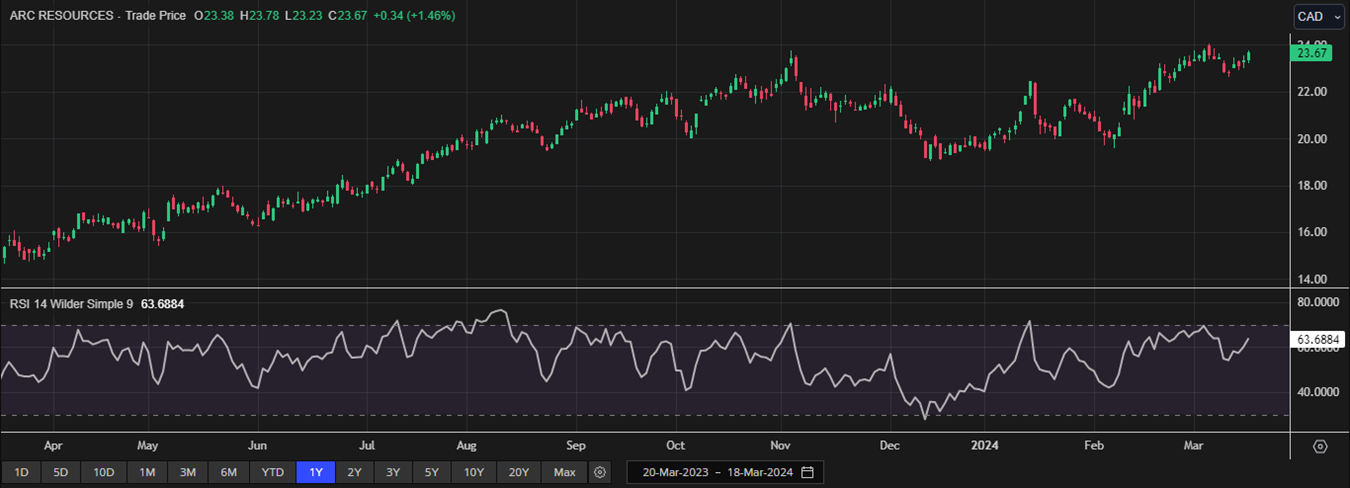
One-Year Technical Price Chart (as of March 15, 2024). Source: REFINITIV, Analysis: Kalkine Group
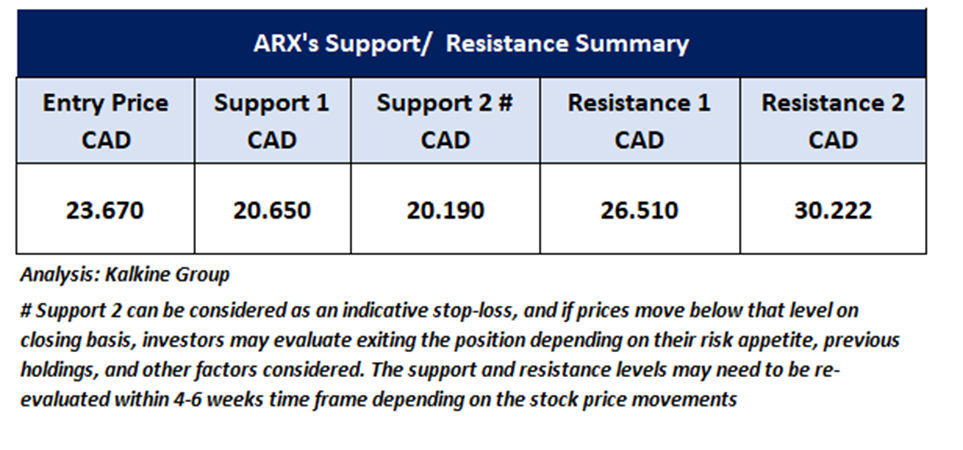
3.4 Technical Summary
Note 1: Past performance is not a reliable indicator of future performance.
Note 2: The reference date for all price data, currency, technical indicators, support, and resistance levels as on March 18, 2024. The reference data in this report has been partly sourced from REFINITIV.
Note 3: Investment decisions should be made depending on an individual's appetite for upside potential, risks, holding duration, and any previous holdings. An 'Exit' from the stock can be considered if the Target Price mentioned as per the Valuation and or the technical levels provided has been achieved and is subject to the factors discussed above.
Note 4: Dividend Yield may vary as per the stock price movement.
Technical Indicators Defined: -
Support: A level at which the stock prices tend to find support if they are falling, and a downtrend may take a pause backed by demand or buying interest.
Resistance: A level at which the stock prices tend to find resistance when they are rising, and the uptrend may take a pause due to profit booking or selling interest.
Stop-loss: In general, it is a level to protect further losses in case of any unfavourable movement in the stock prices.
Section1: Company Overview
Russel Metals Inc (TSX: RUS) is a Canada-based metal distribution company. The company conducts business primarily through three metals distribution segments: metals service centers; energy products; and steel distributors. This Report covers the Investment Highlights, Key Financial Metrics, Risks, Technical Analysis along with the Valuation, Target Price, and Recommendation on the stock.
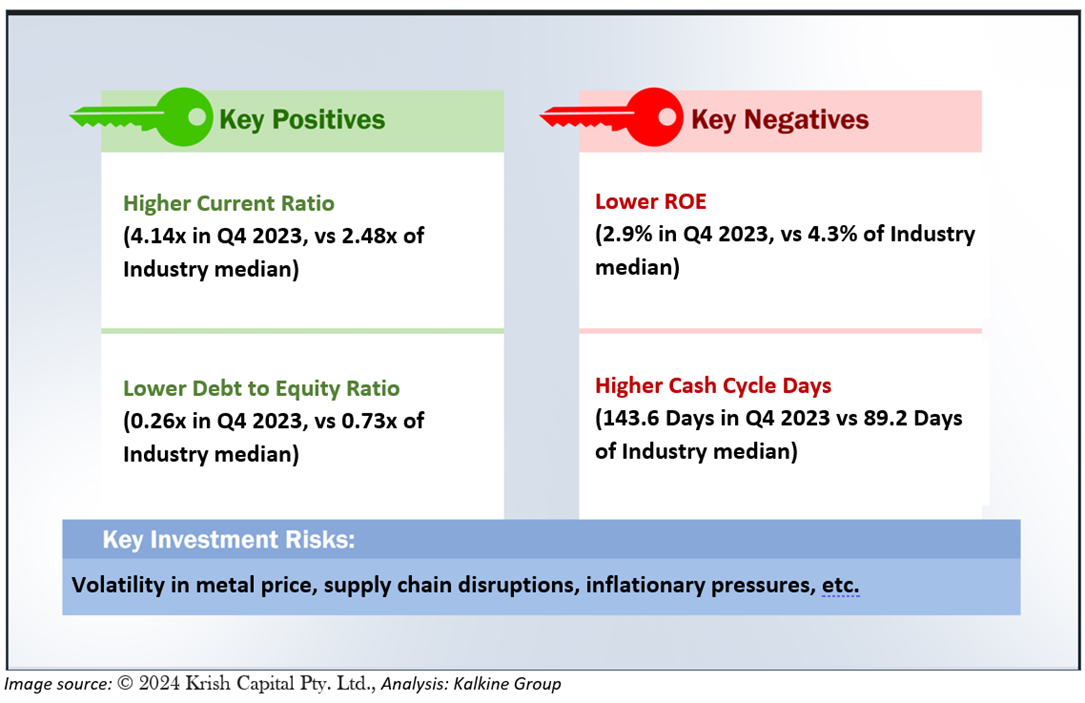
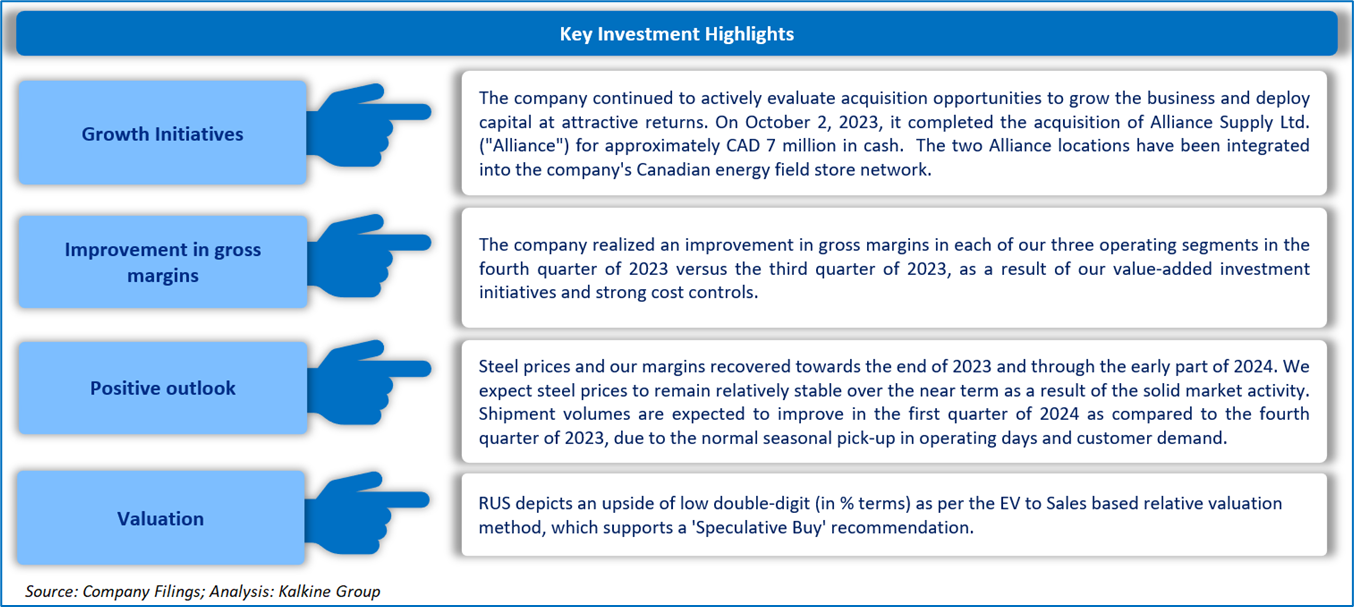
1.2 The Key Positives, Negatives, Investment Highlights, and Risks
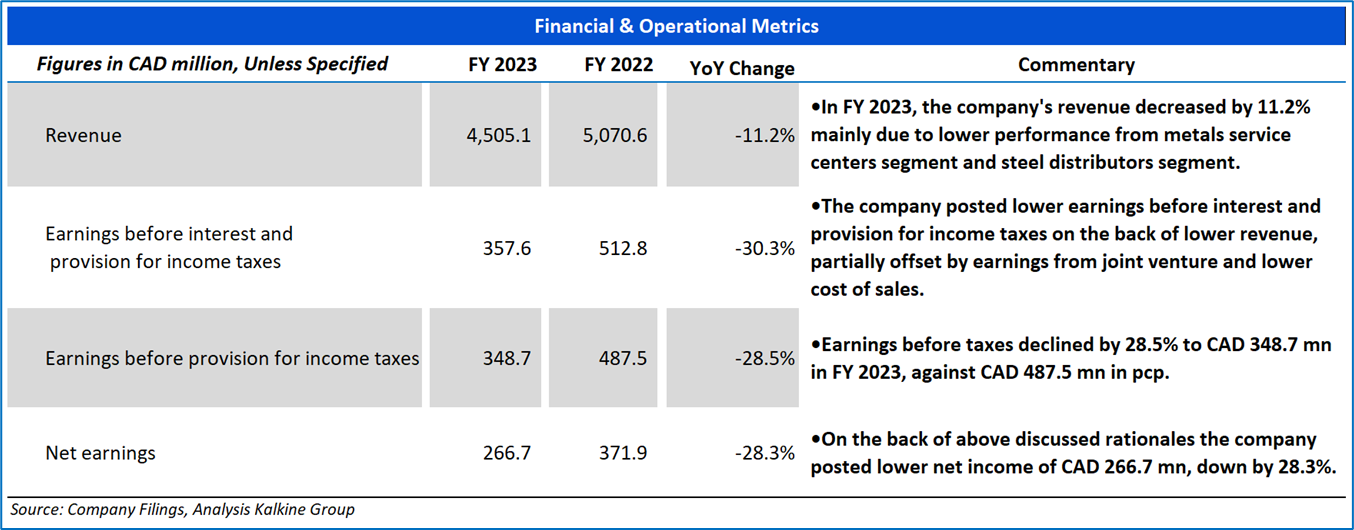
Section2: Financial Highlights
2.1 Key Financial Highlights
Section 3: Stock Recommendation Summary
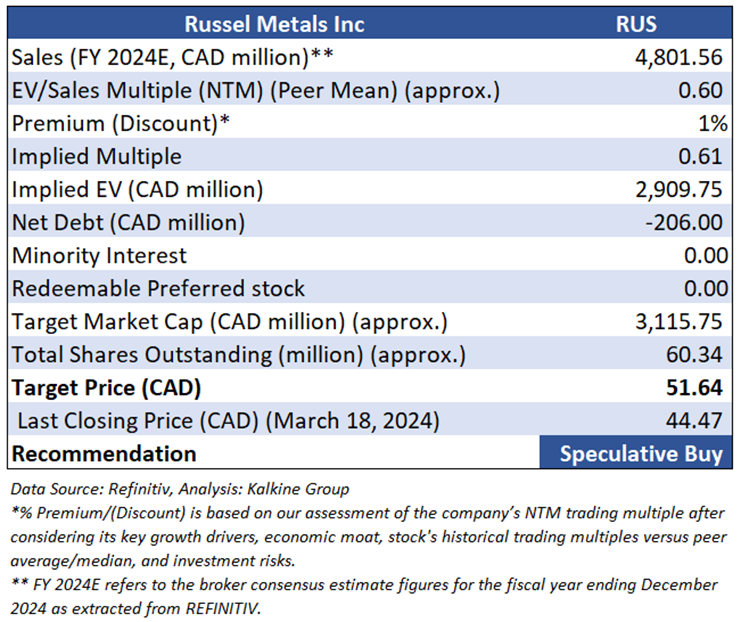
3.1 Valuation Methodology
Valuation Methodology (Illustrative): EV to Sales based
3.2 Price Performance and Stock Recommendation

The stock has witnessed an upside of ~2.60% and a downside of ~4.34% over the last 1 week and 1 month respectively. Moreover, the stock is trading above the average 52-week high price of CAD 47.39 and 52-week low price of CAD 31.24 providing an opportunity to ride the trend. Russel Metals Inc (TSX: RUS) was last covered on 15th February 2024.

3.3 One-Year Technical Price Chart
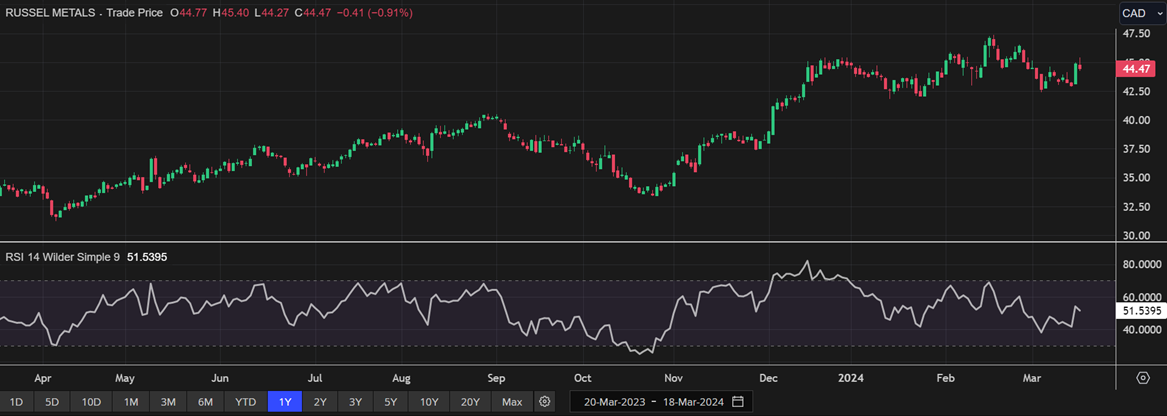
One-Year Technical Price Chart (as of March 18, 2024). Source: REFINITIV, Analysis: Kalkine Group
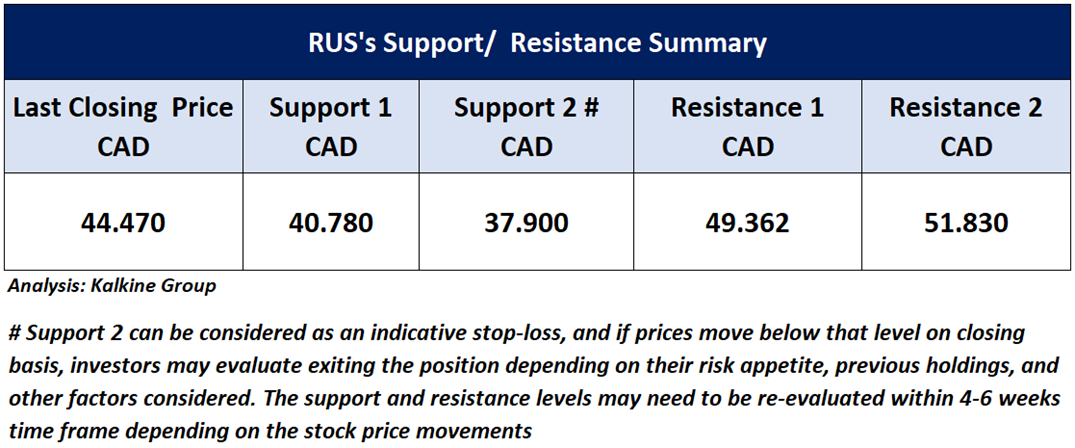
3.4 Technical Summary
Note 1: Past performance is not a reliable indicator of future performance.
Note 2: The reference date for all price data, currency, technical indicators, support, and resistance levels as on March 18, 2024. The reference data in this report has been partly sourced from REFINITIV.
Note 3: Investment decisions should be made depending on an individual's appetite for upside potential, risks, holding duration, and any previous holdings. An 'Exit' from the stock can be considered if the Target Price mentioned as per the Valuation and or the technical levels provided has been achieved and is subject to the factors discussed above.
Note 4: Dividend Yield may vary as per the stock price movement.
Technical Indicators Defined: -
Support: A level at which the stock prices tend to find support if they are falling, and a downtrend may take a pause backed by demand or buying interest.
Resistance: A level at which the stock prices tend to find resistance when they are rising, and the uptrend may take a pause due to profit booking or selling interest.
Stop-loss: In general, it is a level to protect further losses in case of any unfavourable movement in the stock prices.
The advice given by Kalkine Canada Advisory Services Inc. and provided on this website is general information only and it does not take into account your investment objectives, financial situation and the particular needs of any particular person. You should therefore consider whether the advice is appropriate to your investment objectives, financial situation and needs before acting upon it. You should seek advice from a financial adviser, stockbroker or other professional (including taxation and legal advice) as necessary before acting on any advice. Not all investments are appropriate for all people. The website www.kalkine.ca is published by Kalkine Canada Advisory Services Inc. The link to our Terms & Conditions has been provided please go through them. On the date of publishing this report (mentioned on the website), employees and/or associates of Kalkine do not hold positions in any of the stocks covered on the website. These stocks can change any time and readers of the reports should not consider these stocks as advice or recommendations later.
 Please wait processing your request...