Section 1: Company Fundamentals
1.1 Company Overview and Performance summary
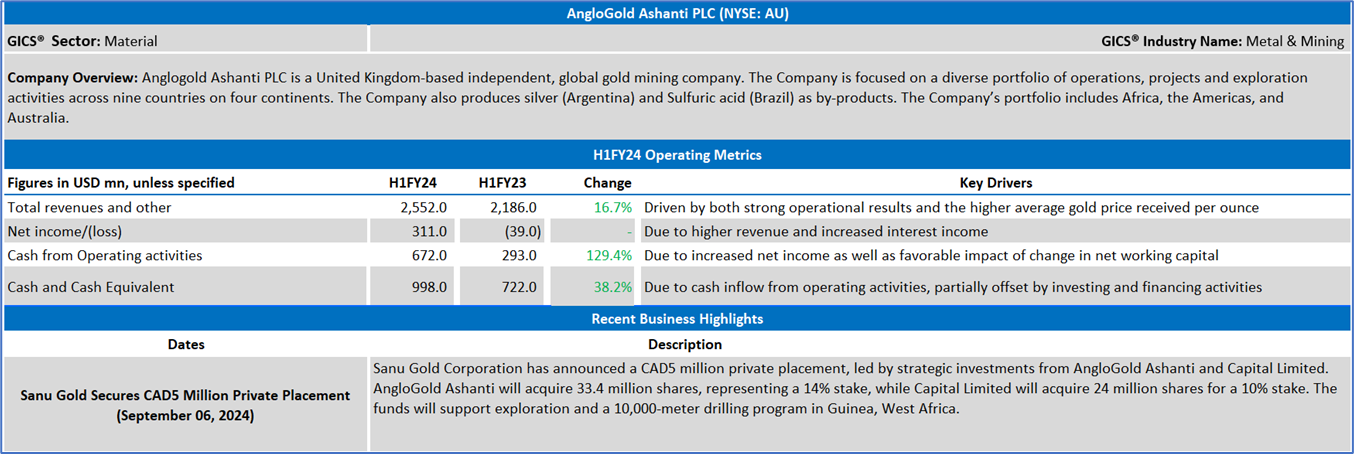
Company Overview:
Anglogold Ashanti PLC (NYSE: AU) is a United Kingdom-based independent, global gold mining company. The Company is focused on a diverse portfolio of operations, projects and exploration activities across nine countries on four continents. The Company also produces silver (Argentina) and Sulfuric acid (Brazil) as by-products. The Company’s portfolio includes Africa, the Americas, and Australia.
This US Inflation Report covers the Company Overview & Price performance, Summary table, Key positives & negatives, Key metrics, Company details, technical guidance & Stock recommendation, and Price chart.
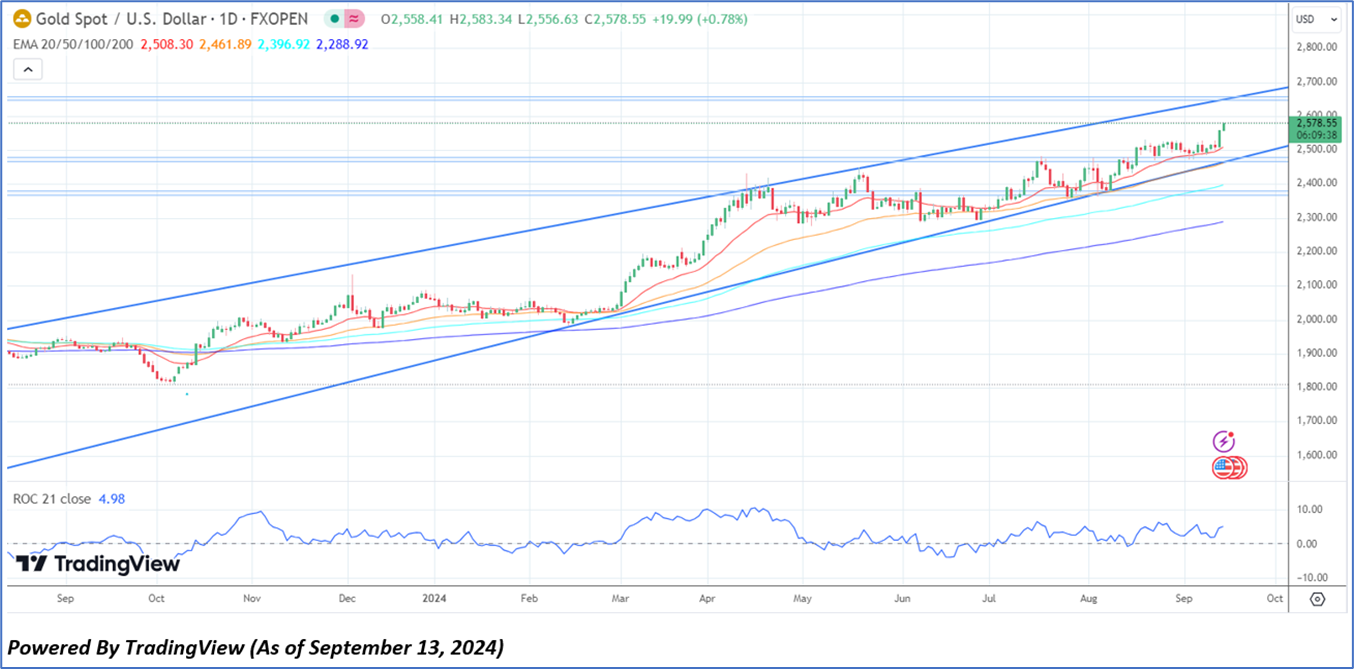
Price Performance:
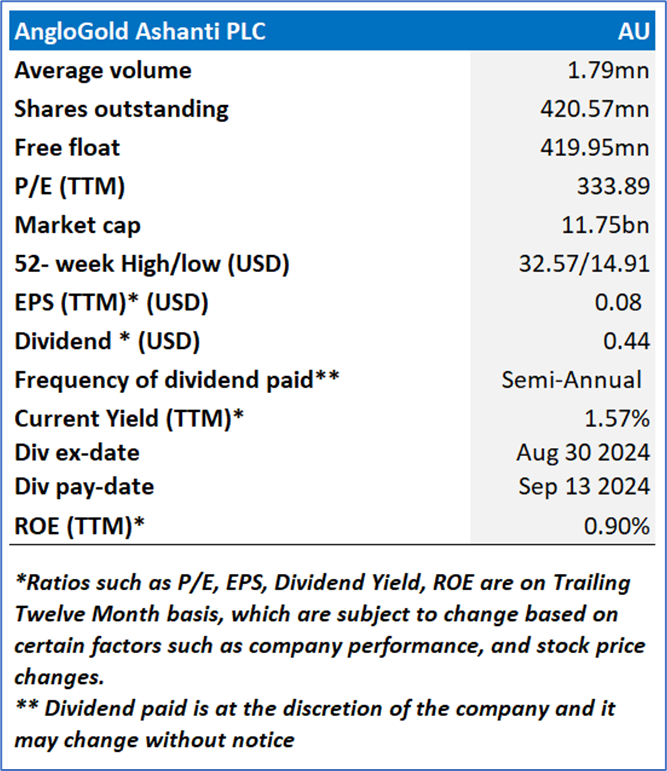
1.2 Summary Table
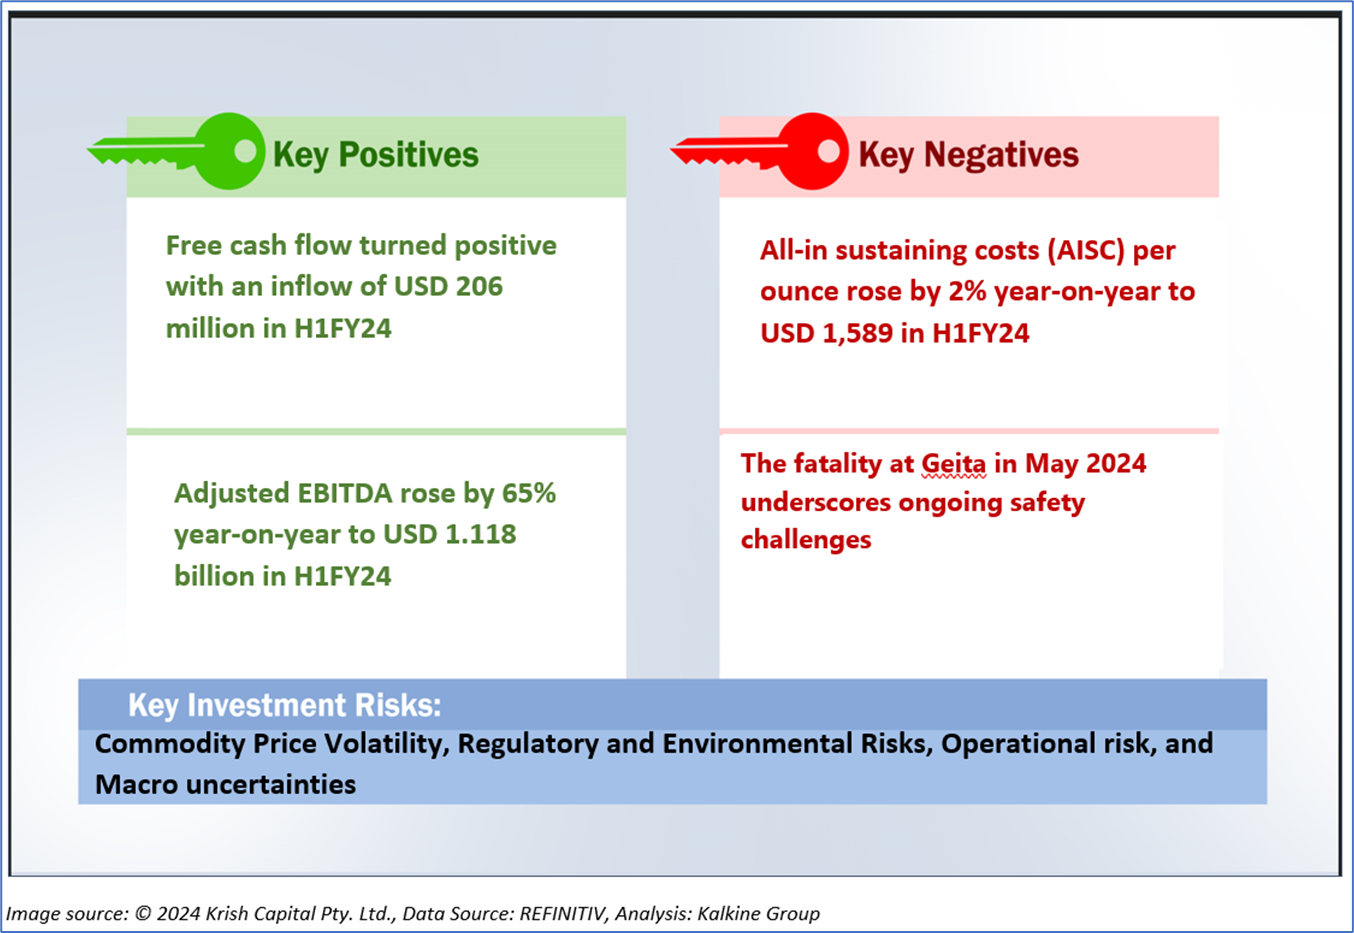
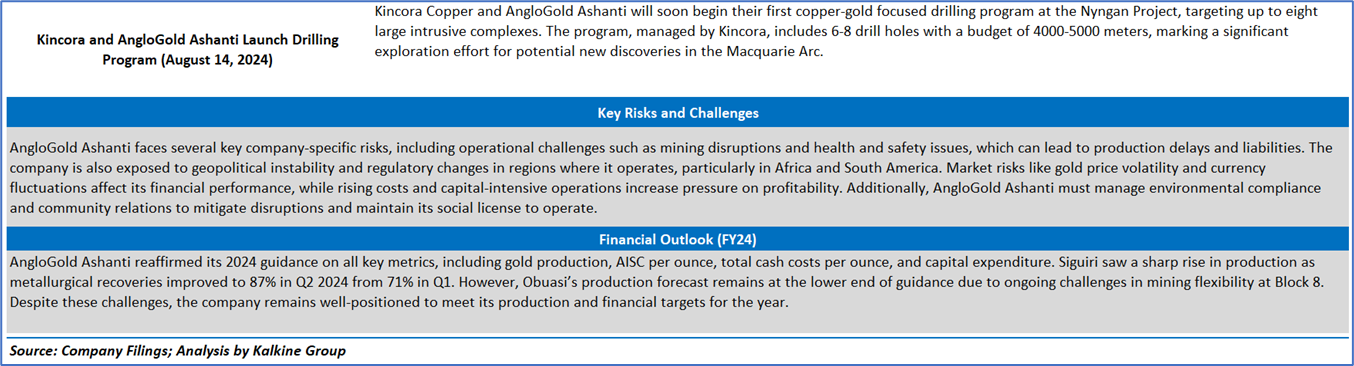
1.3 The Key Positives & Negatives
1.4 Underlying Commodity Analysis (Gold)
Gold prices surged to approximately USD 2,560 per ounce, achieving a record high. This ascent was driven by a combination of a weakened dollar and declining bond yields. The increase in gold prices was prompted by recent economic data that intensified speculation of more decisive action by the Federal Reserve in the forthcoming interest rate cuts. The data revealed a rise in initial jobless claims in the US from the prior week, indicating a softening labor market, compounded by weaker August payroll figures. Additionally, US producer prices in August slightly exceeded expectations due to elevated service costs; however, the broader inflationary trend suggested a continued easing. Market expectations, as indicated by the CME FedWatch tool, now foresee a 59% probability of a 25 basis points rate cut and a 41% chance of a 50 basis points reduction. Concurrently, the European Central Bank (ECB) reduced rates by 25 basis points as anticipated, reflecting a growing confidence among policymakers that inflation is on a sustainable downward trajectory.
Section 2: AngloGold Ashanti PLC (NYSE: AU) (“Buy” at the current market price of USD 28.06, as of September 13, 2024, at 07:05 am PDT)
2.1 Company Details
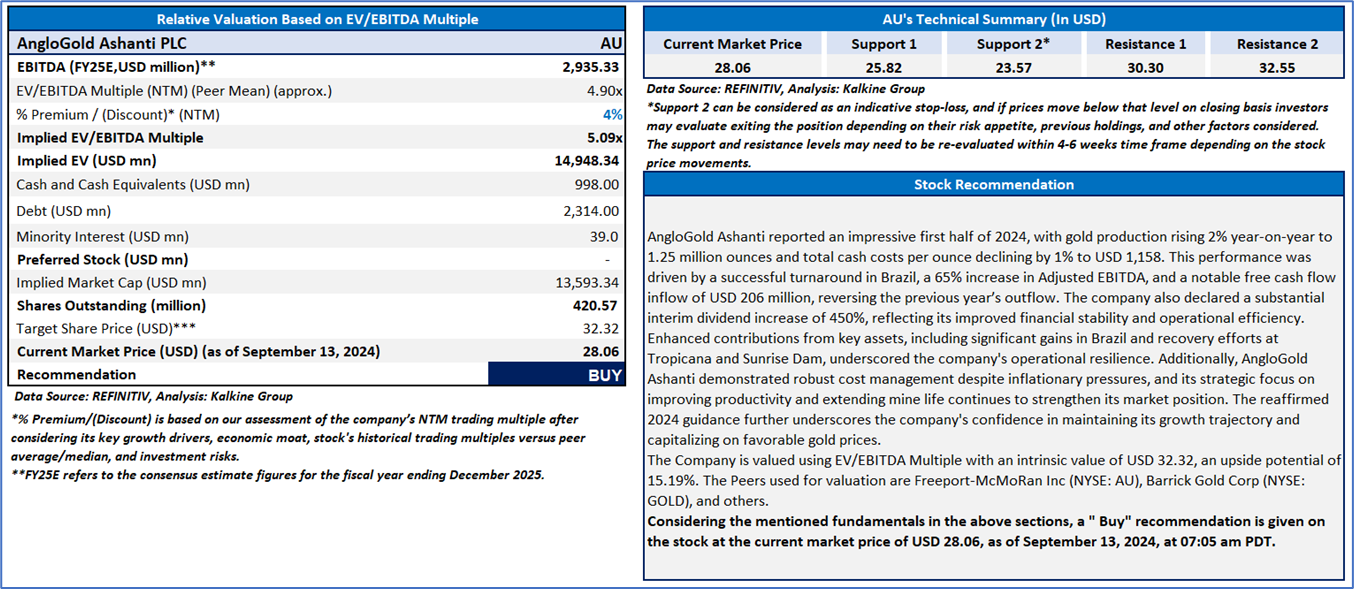
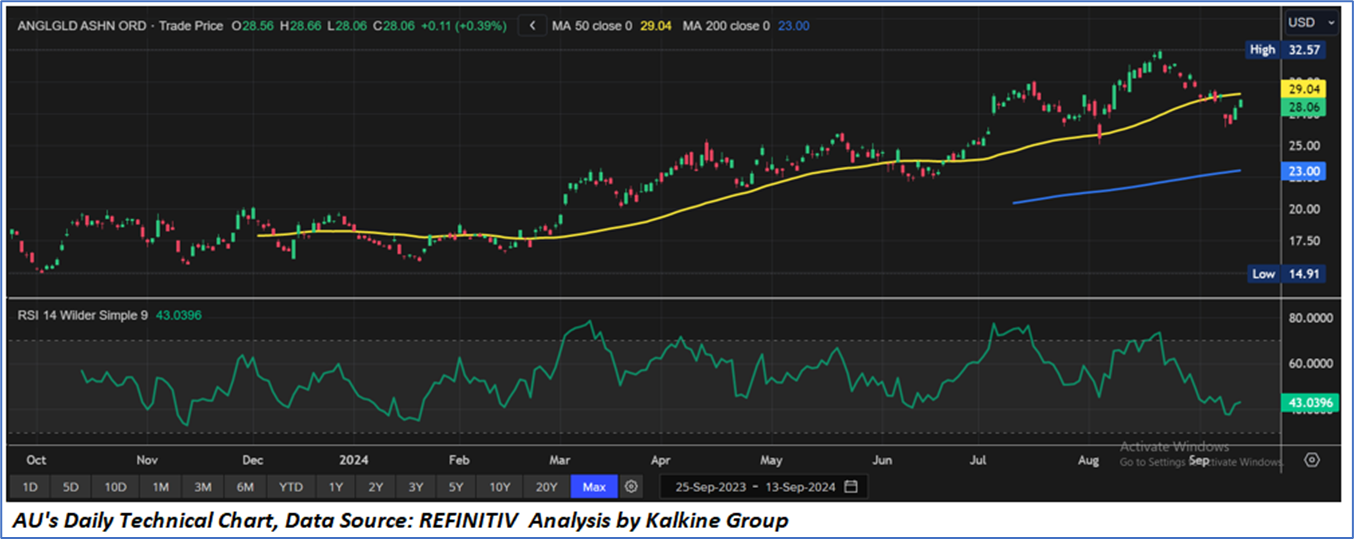
2.2 Technical Guidance and Stock Recommendation
Markets are trading in a highly volatile zone currently due to certain macroeconomic issues and geopolitical tensions prevailing. Therefore, it is prudent to follow a cautious approach while investing.
Note 1: Past performance is not a reliable indicator of future performance.
Note 2: The reference date for all price data, currency, technical indicators, support, and resistance levels is September 13, 2024. The reference data in this report has been partly sourced from REFINITIV.
Note 3: Investment decisions should be made depending on an individual's appetite for upside potential, risks, holding duration, and any previous holdings. An 'Exit' from the stock can be considered if the Target Price mentioned as per the Valuation and or the technical levels provided has been achieved and is subject to the factors discussed above.
Note 4: The report publishing date is as per the Pacific Time Zone.
Technical Indicators Defined: -
Support: A level at which the stock prices tend to find support if they are falling, and a downtrend may take a pause backed by demand or buying interest. Support 1 refers to the nearby support level for the stock and if the price breaches the level, then Support 2 may act as the crucial support level for the stock.
Resistance: A level at which the stocks prices tend to find resistance when they are rising, and an uptrend may take a pause due to profit booking or selling interest. Resistance 1 refers to the nearby resistance level for the stock and if the price surpasses the level, then Resistance 2 may act as the crucial resistance level for the stock.
Stop-loss: It is a level to protect against further losses in case of unfavorable movement in the stock prices.
The advice given by Kalkine Canada Advisory Services Inc. and provided on this website is general information only and it does not take into account your investment objectives, financial situation and the particular needs of any particular person. You should therefore consider whether the advice is appropriate to your investment objectives, financial situation and needs before acting upon it. You should seek advice from a financial adviser, stockbroker or other professional (including taxation and legal advice) as necessary before acting on any advice. Not all investments are appropriate for all people. The website www.kalkine.ca is published by Kalkine Canada Advisory Services Inc. The link to our Terms & Conditions has been provided please go through them. On the date of publishing this report (mentioned on the website), employees and/or associates of Kalkine do not hold positions in any of the stocks covered on the website. These stocks can change any time and readers of the reports should not consider these stocks as advice or recommendations later.
 Please wait processing your request...