Section 1: Company Fundamentals
1.1 Company Overview and Performance summary
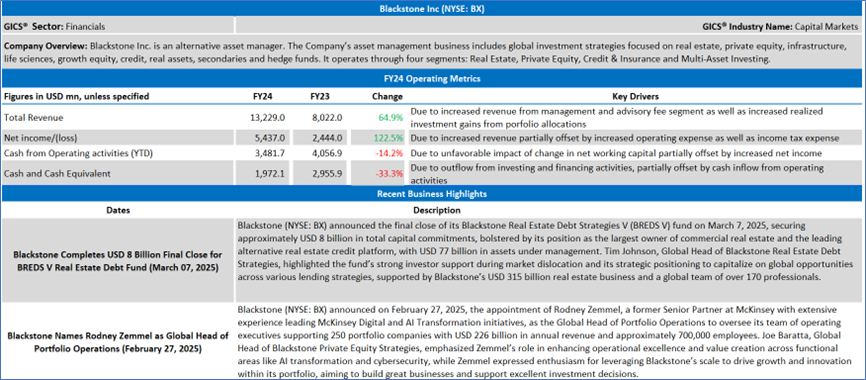
Company Overview:
Blackstone Inc. (NYSE: BX) is an alternative asset manager. The Company’s asset management business includes global investment strategies focused on real estate, private equity, infrastructure, life sciences, growth equity, credit, real assets, secondaries and hedge funds. It operates through four segments: Real Estate, Private Equity, Credit & Insurance and Multi-Asset Investing.
This US Inflation Report covers the Company Overview & Price performance, Summary table, Key positives & negatives, Key metrics, Company details, technical guidance & Stock recommendation, and Price chart.
Price Performance:
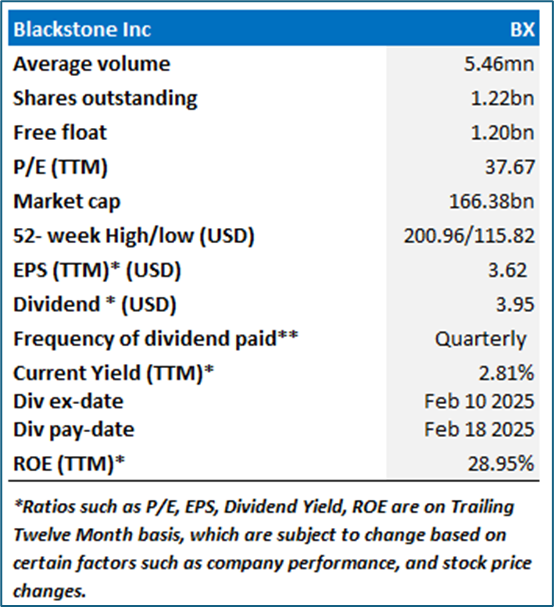
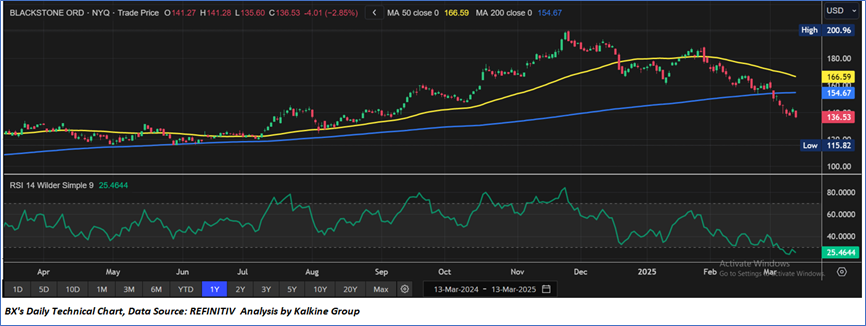
- BX's share price has fallen by 28.25% in the past three months. On the other hand, in the long term, the stock has given a return of 8.27% over the past year.
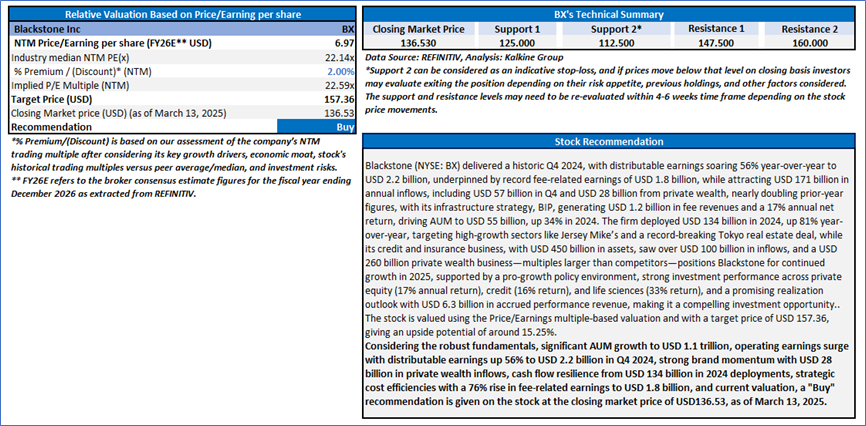
- The stock is currently trading near to the lower end of its 52-week range of USD 200.96 and 52-week low price of USD 115.82, with the expectations of an upside movement if the price sustains above an important support level of USD 125.00-USD 130.00.
- The price is currently below both its short-term (50-day) SMA and long-term (200-day) SMA, with the current RSI of around 25.46.
1.2 Summary Table
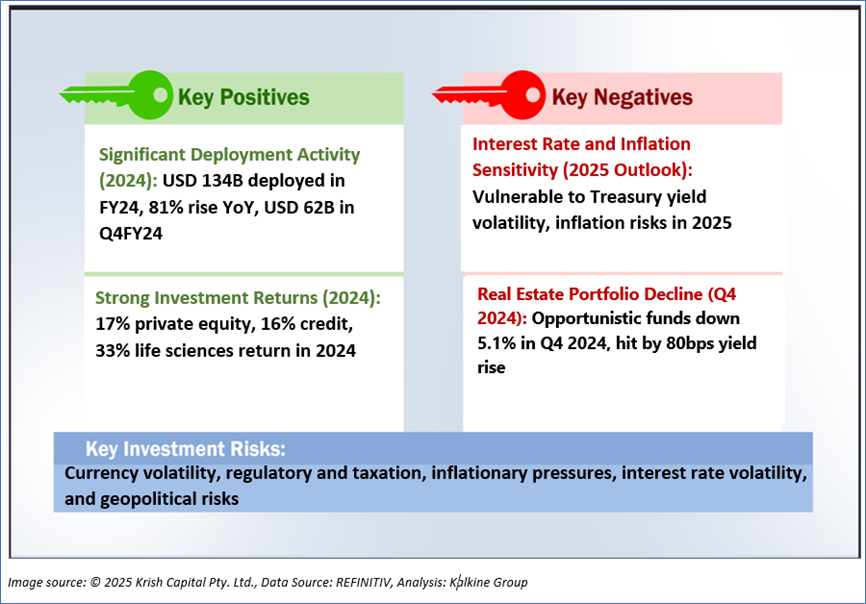
1.3 The Key Positives & Negatives
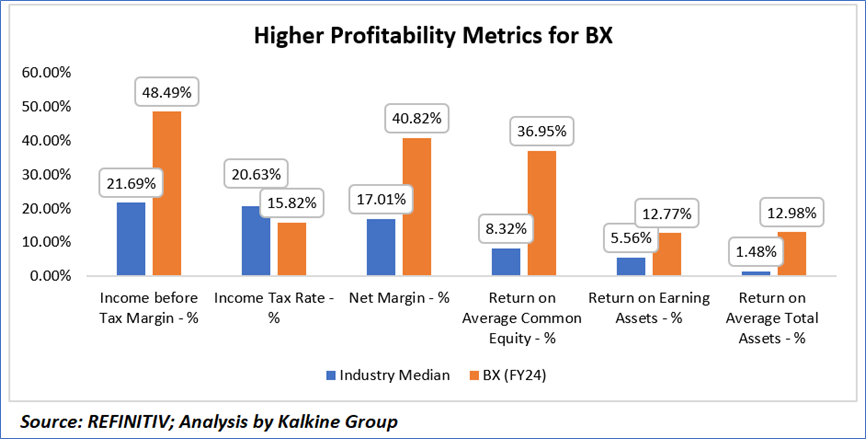
1.4 Key Metrics
In FY24, Blackstone (BX) significantly outperformed industry medians across key profitability metrics, achieving an income before tax margin of 48.49% compared to the industry’s 21.69%, a net margin of 40.82% against 17.01%, a return on average common equity of 36.95% versus 8.32%, a return on earning assets of 12.77% compared to 5.56%, and a return on average total assets of 12.98% against 1.48%, despite a lower net tax rate of 15.82% versus the industry’s 20.63%. These figures underscore Blackstone’s exceptional operational efficiency and profitability, driven by its record-breaking fee-related earnings of USD 1.8 billion in Q4 2024, a 56% increase in distributable earnings to USD 2.2 billion, and strong investment performance across private equity (17% return) and credit (16% return), positioning the firm as a leader in the alternative asset management space with a compelling investment profile, even amidst real estate challenges and interest rate volatility.
Section 2: Blackstone Inc. (NYSE: BX) (“Buy” at the closing price of 136.53, as of March 13, 2025)
2.1 Company Details
2.2 Technical Guidance and Stock Recommendation
Markets are trading in a highly volatile zone currently due to certain macroeconomic issues and geopolitical tensions prevailing. Therefore, it is prudent to follow a cautious approach while investing.
Note 1: Past performance is not a reliable indicator of future performance.
Note 2: The reference date for all price data, currency, technical indicators, support, and resistance levels is March 13, 2025. The reference data in this report has been partly sourced from REFINITIV.
Note 3: Investment decisions should be made depending on an individual's appetite for upside potential, risks, holding duration, and any previous holdings. An 'Exit' from the stock can be considered if the Target Price mentioned as per the Valuation and or the technical levels provided has been achieved and is subject to the factors discussed above.
Note 4: The report publishing date is as per the Pacific Time Zone.
Technical Indicators Defined: -
Support: A level at which the stock prices tend to find support if they are falling, and a downtrend may take a pause backed by demand or buying interest. Support 1 refers to the nearby support level for the stock and if the price breaches the level, then Support 2 may act as the crucial support level for the stock.
Resistance: A level at which the stocks prices tend to find resistance when they are rising, and an uptrend may take a pause due to profit booking or selling interest. Resistance 1 refers to the nearby resistance level for the stock and if the price surpasses the level, then Resistance 2 may act as the crucial resistance level for the stock.
Stop-loss: It is a level to protect against further losses in case of unfavorable movement in the stock prices.
Past performance is not a reliable indicator of future performance.
 Please wait processing your request...