Section 1: Company Fundamentals
1.1Company Overview and Performance summary
Company Overview:
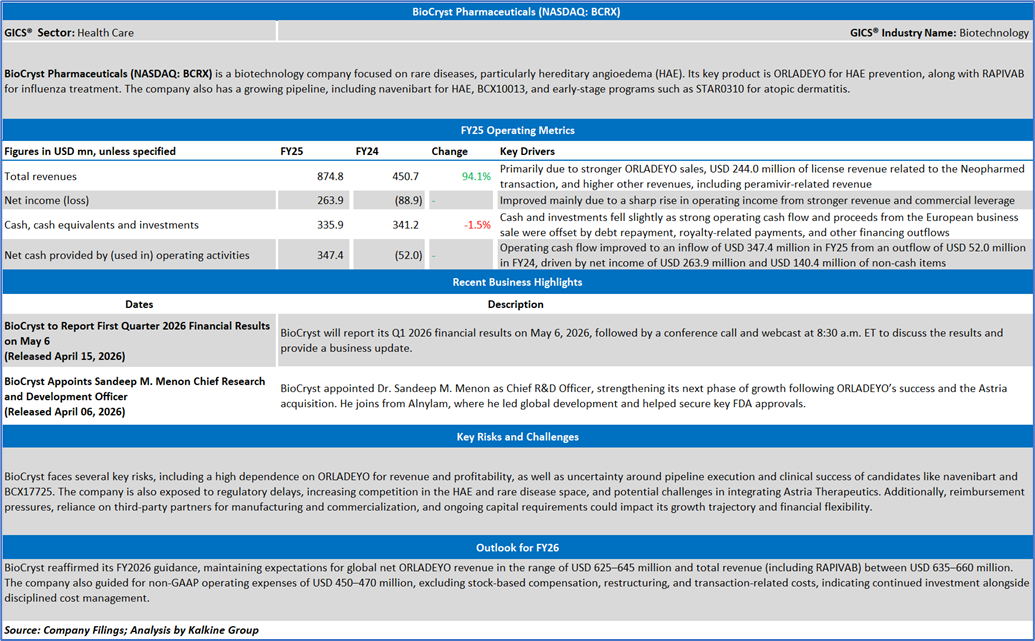
BioCryst Pharmaceuticals (NASDAQ: BCRX) is a biotechnology company focused on rare diseases, particularly hereditary angioedema (HAE). Its key product is ORLADEYO for HAE prevention, along with RAPIVAB for influenza treatment. The company also has a growing pipeline, including navenibart for HAE, BCX10013, and early-stage programs such as STAR0310 for atopic dermatitis.
This US Inflation Report covers the Company Overview & Price performance, Summary table, Key positives & negatives, Key metrics, Company details, technical guidance & Stock recommendation, and Price chart.
Price Performance:
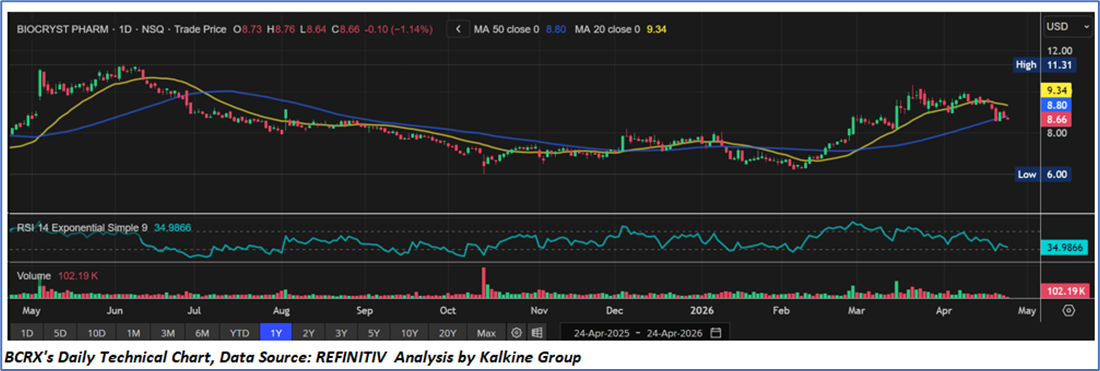
- Stock showed a recovery from February lows with higher highs and higher lows, but momentum has recently weakened.
- Currently trading below both the 20-day (USD 9.34) and 50-day (USD 8.80), indicating a short-term bearish bias.
- RSI near 35 suggests weakening momentum and approaching oversold conditions, but no clear reversal signal yet.
- Relatively low volumes indicate limited buying conviction.
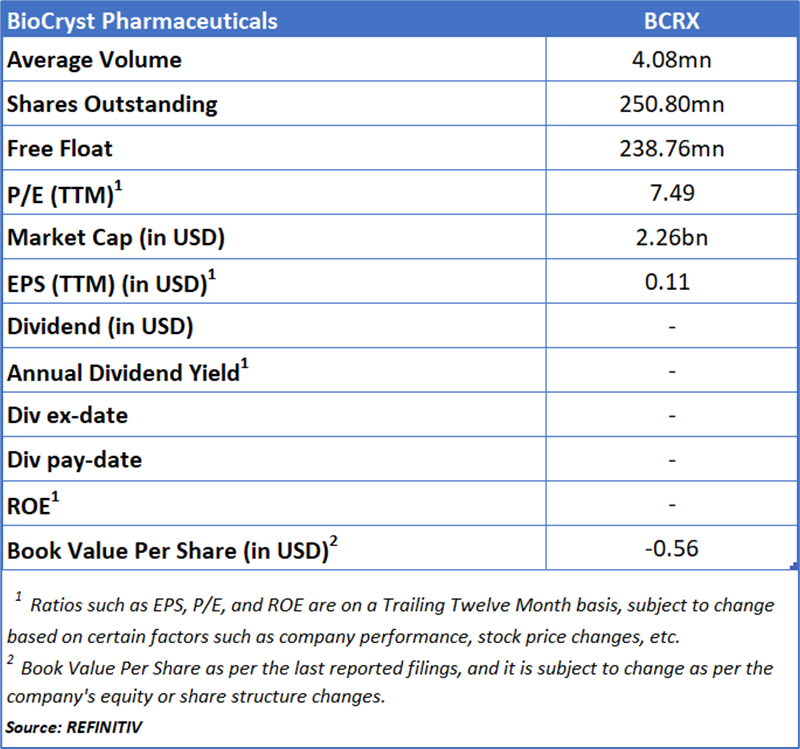
1.2 Summary Table
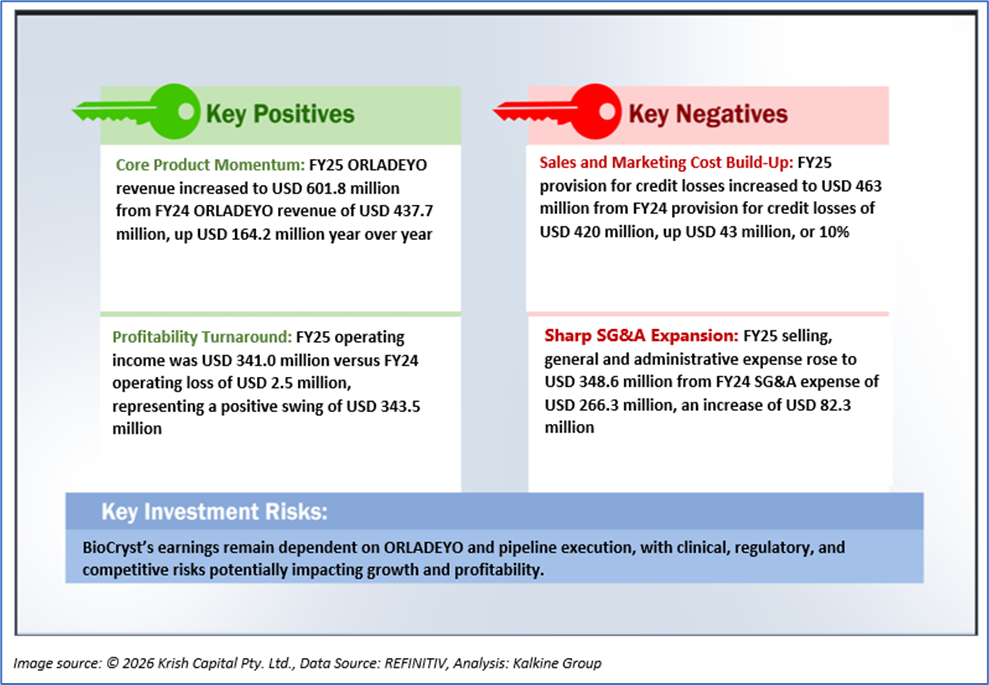
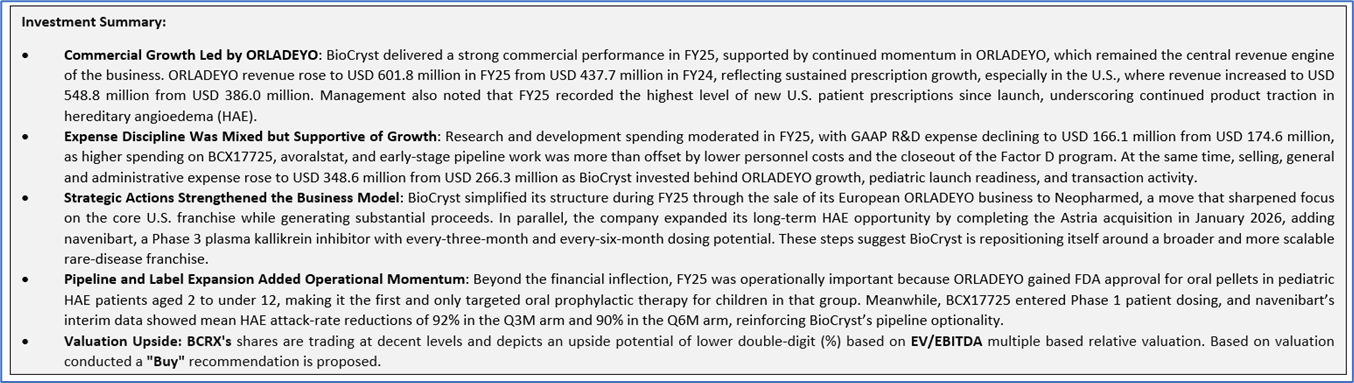
1.3 The Key Positives & Negatives
1.4 Key Metrics
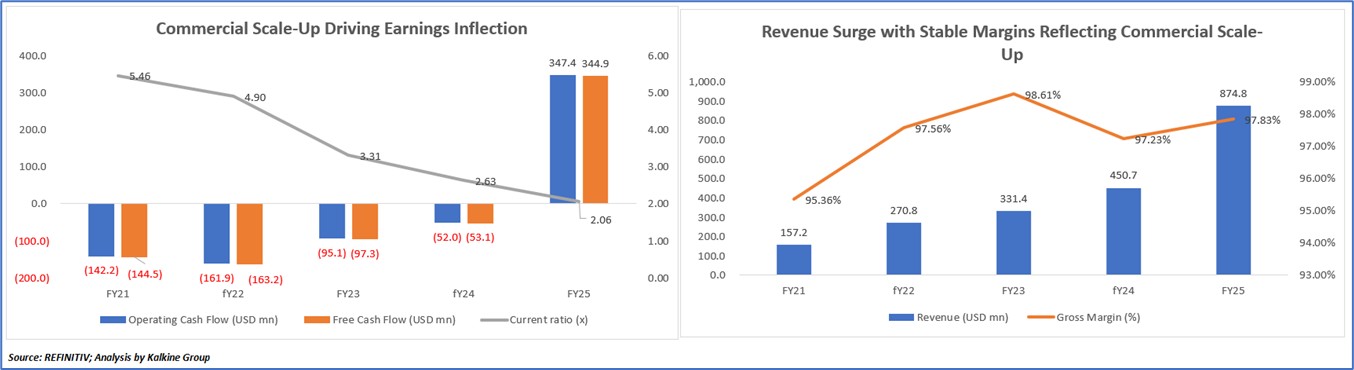
Commercial Scale-Up Driving Earnings Inflection
- The liquidity trend reflected in the chart is primarily driven by BioCryst’s transition from a development-stage biotech to a commercially scaled, profitable rare-disease company.
- The sharp uptrend in revenue is largely attributable to strong ORLADEYO adoption, with sustained prescription growth in the U.S. and expanding global penetration. This was further amplified in FY25 by one-time license revenue from the sale of the European ORLADEYO business, which created a step-change in total revenue.
- The inflection to profitability and improved margins stems from operating leverage, as higher product sales absorbed fixed costs, alongside relatively controlled R&D spending. However, elevated SG&A and commercialization costs—linked to pediatric launch support, distribution expansion, and scaling operations—partly offset margin expansion.
- The significant improvement in operating cash flow reflects the shift to positive net income and strong commercial cash generation, although cash balances remained relatively stable due to offsetting outflows such as debt repayment and financing obligations.
- In parallel, the current ratio trend indicates improving liquidity over the period, driven by stronger cash generation and a more robust balance sheet, although it may have moderated slightly following debt settlements and strategic transactions.
Revenue Surge with Stable Margins Reflecting Commercial Scale-Up
- The top line chart highlights a strong revenue uptrend from FY21 to FY25, rising from USD 157.2 million to USD 874.8 million, primarily driven by the rapid commercialization and adoption of ORLADEYO, which became the company’s core growth engine. The sharp acceleration in FY25 is further supported by one-time licensing revenue from the European ORLADEYO divestiture, in addition to continued prescription growth and geographic expansion.
- Despite this scale-up, gross margins remained consistently high (95%–99%), reflecting the attractive economics of rare-disease therapies, strong pricing power, and a favorable product mix led by ORLADEYO. The slight margin fluctuation—peaking in FY23 (~98.6%), dipping in FY24 (~97.2%), and stabilizing in FY25 (~97.8%)—can be attributed to higher commercialization costs, distribution expenses, and scaling of operations, including pediatric launch investments and transition-related costs.
Section 2: BioCryst Pharmaceuticals (NASDAQ: BCRX) (“Buy” at the current market price of USD 8.66, as of April 24,2026 at 6:48 am PDT)
2.1 Company Details
2.2 Technical Guidance and Stock Recommendation
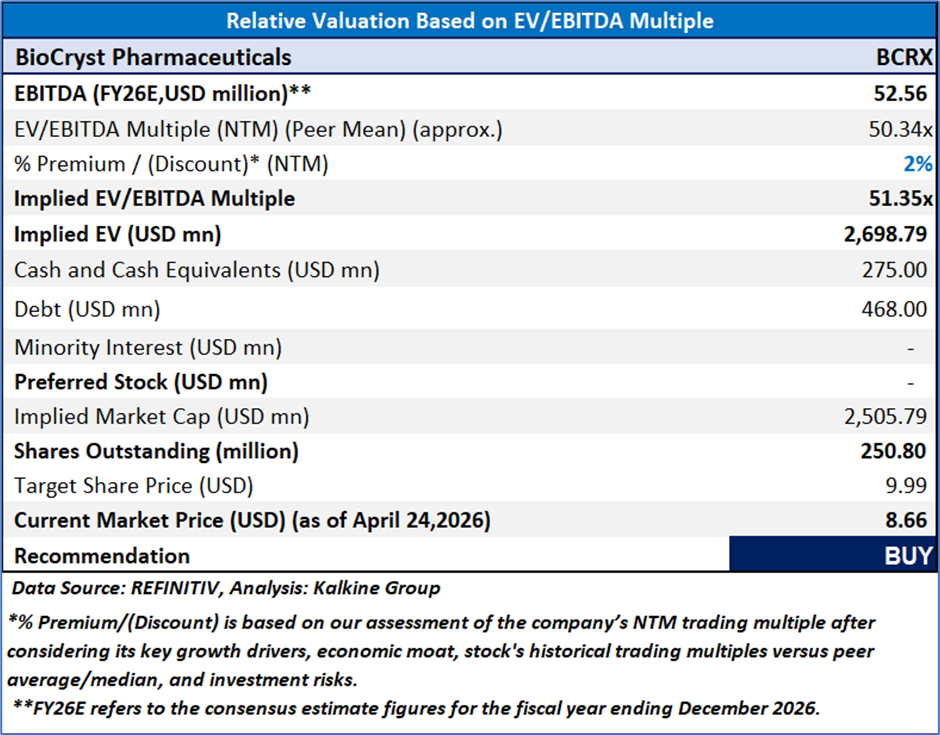
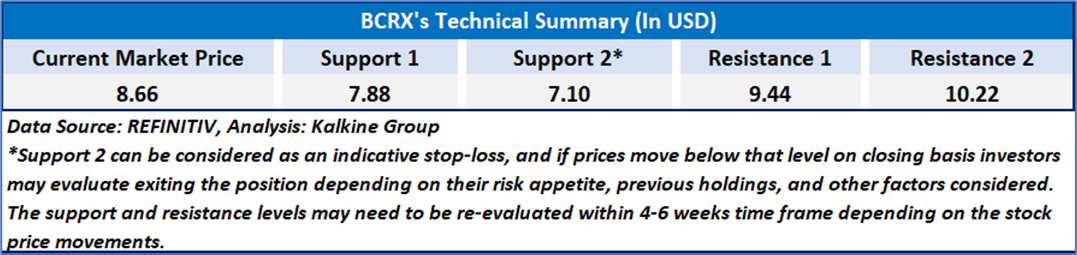
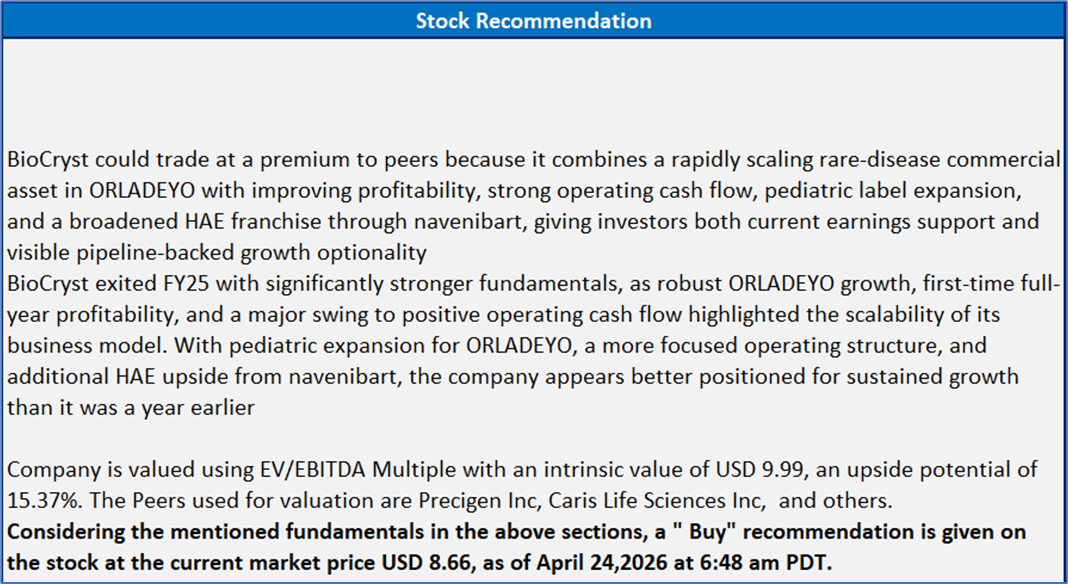
Markets are trading in a highly volatile zone currently due to certain macroeconomic issues and geopolitical tensions prevailing. Therefore, it is prudent to follow a cautious approach while investing.
Note 1: Past performance is not a reliable indicator of future performance.
Note 2: The reference date for all price data, currency, technical indicators, support, and resistance levels is April 24, 2026. The reference data in this report has been partly sourced from REFINITIV.
Note 3: Investment decisions should be made depending on an individual's appetite for upside potential, risks, holding duration, and any previous holdings. An 'Exit' from the stock can be considered if the Target Price mentioned as per the Valuation and or the technical levels provided has been achieved and is subject to the factors discussed above.
Note 4: The report publishing date is as per the Pacific Time Zone.
Technical Indicators Defined: -
Support: A level at which the stock prices tend to find support if they are falling, and a downtrend may take a pause backed by demand or buying interest. Support 1 refers to the nearby support level for the stock and if the price breaches the level, then Support 2 may act as the crucial support level for the stock.
Resistance: A level at which the stocks prices tend to find resistance when they are rising, and an uptrend may take a pause due to profit booking or selling interest. Resistance 1 refers to the nearby resistance level for the stock and if the price surpasses the level, then Resistance 2 may act as the crucial resistance level for the stock.
Stop-loss: It is a level to protect against further losses in case of unfavorable movement in the stock prices.
Past performance is not a reliable indicator of future performance.

 NZ
 UK
 US
 AU
 IND

 CA

 Please wait processing your request...