Section 1: Company Fundamentals
1.1 Company Overview and Performance summary
Company Overview:
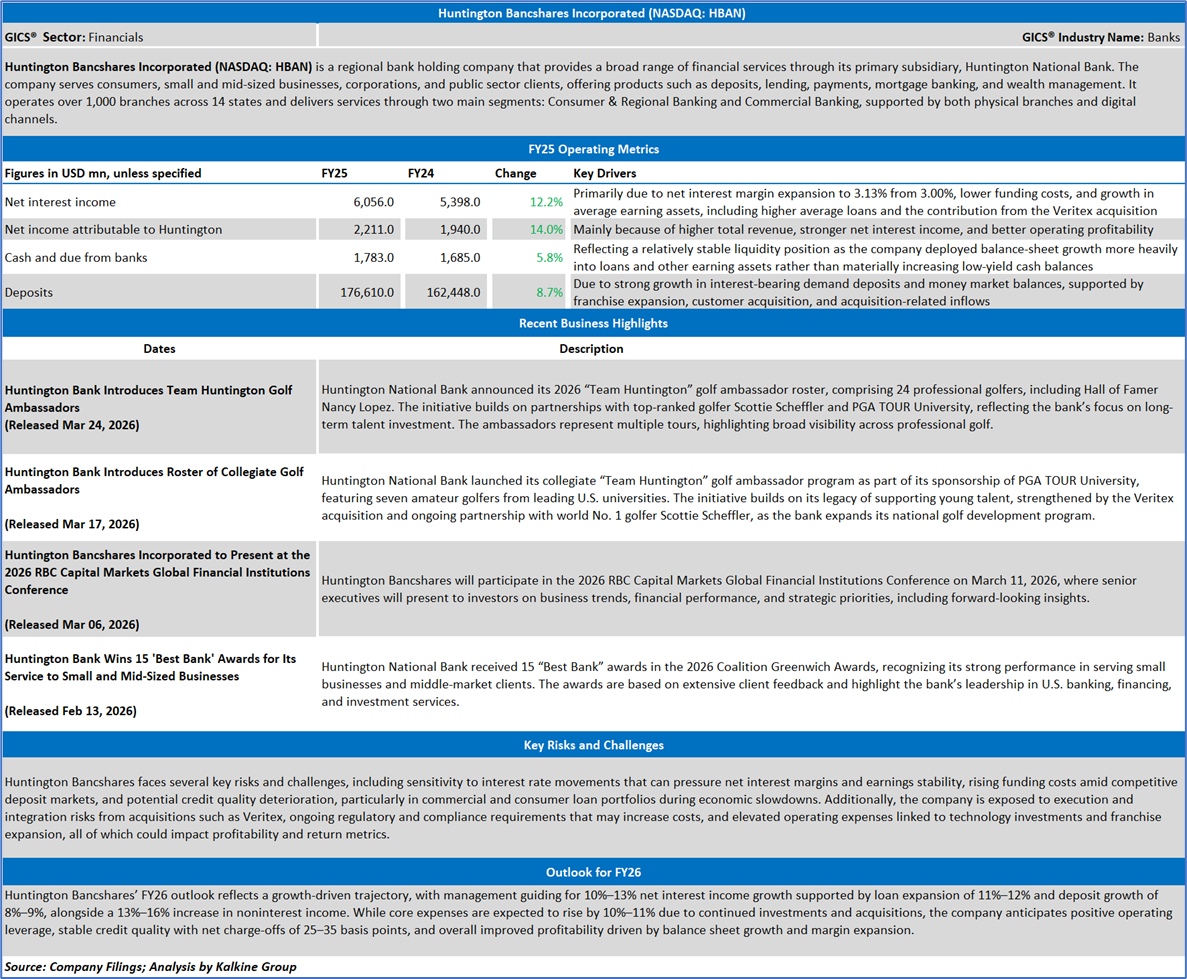
Huntington Bancshares Incorporated (NASDAQ: HBAN) is a regional bank holding company that provides a broad range of financial services through its primary subsidiary, Huntington National Bank. The company serves consumers, small and mid-sized businesses, corporations, and public sector clients, offering products such as deposits, lending, payments, mortgage banking, and wealth management. It operates over 1,000 branches across 14 states and delivers services through two main segments: Consumer & Regional Banking and Commercial Banking, supported by both physical branches and digital channels.
This US Inflation Report covers the Company Overview & Price performance, Summary table, Key positives & negatives, Key metrics, Company details, technical guidance & Stock recommendation, and Price chart.
Price Performance:
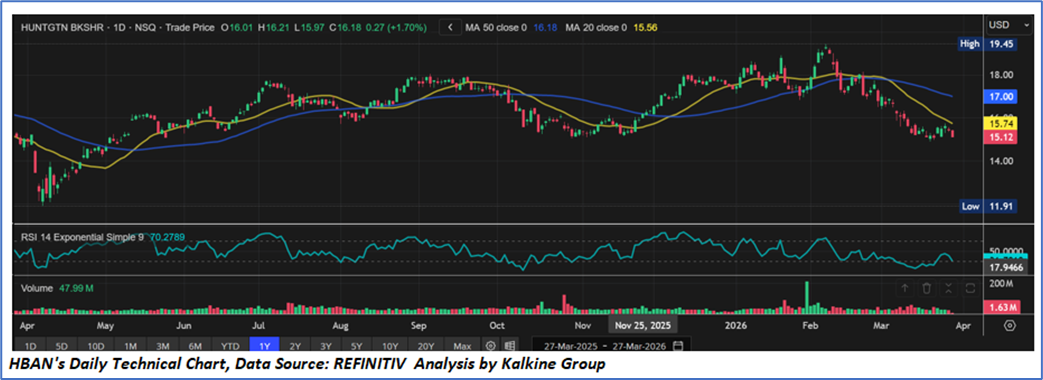
- The stock has entered a short-term downtrend, evident from a series of lower highs and lower lows since the February peak at USD 19.45.
- Price is currently trading below both the 20-day and 50-day moving averages, indicating bearish near-term sentiment and loss of upward momentum.
- The 50-day moving average (USD 17.00) is acting as a dynamic resistance, with repeated failures to sustain above this level reinforcing downside pressure.
- The RSI at 35.84 remains below the neutral 50 mark, suggesting weak momentum without being deeply oversold, leaving room for further downside or consolidation.
- Volume trends show no strong accumulation, indicating limited buying conviction at current levels.
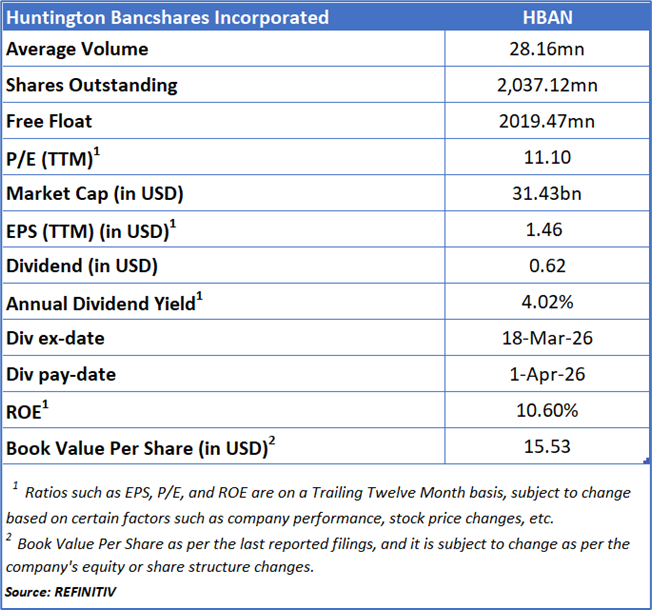
1.2 Summary Table
1.3 The Key Positives & Negatives
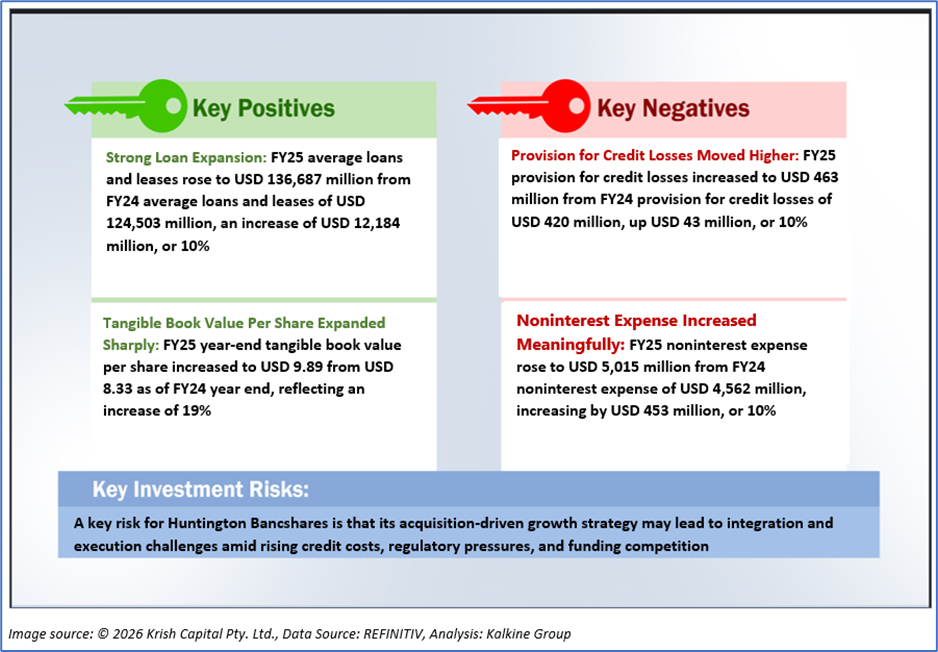
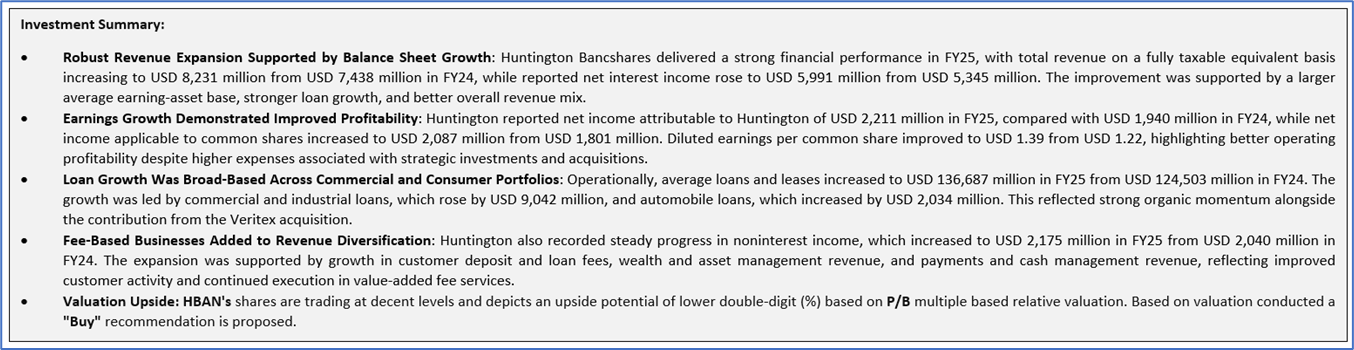
1.4 Key Metrics
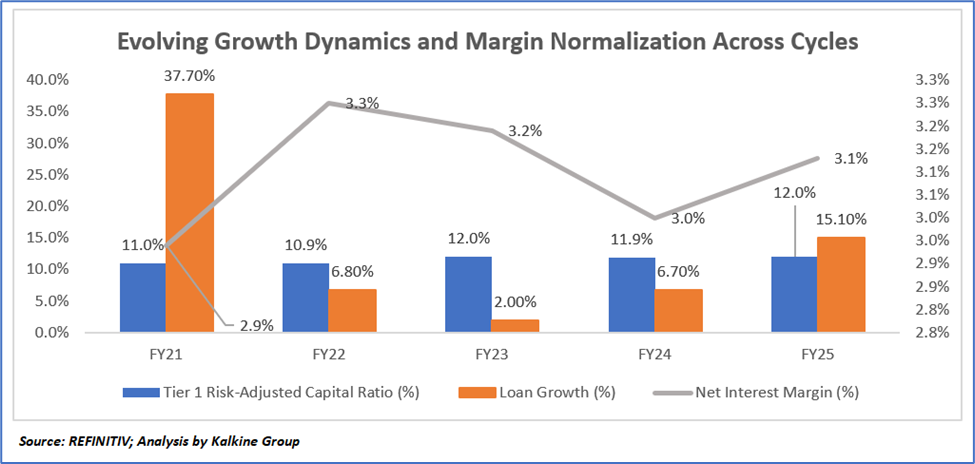
Evolving Growth Dynamics and Margin Normalization Across Cycles
The trends reflect a transition from a post-pandemic surge to a more normalized growth environment, where loan growth peaked in FY21 due to strong demand, stimulus support, and acquisitions, before moderating in FY22–FY23 amid balance sheet optimization and softer demand and subsequently recovering in FY24–FY25 driven by geographic expansion and business growth initiatives. Net interest margin expanded in FY22 on the back of rising interest rates but declined through FY23–FY24 due to higher funding costs and deposit competition, with partial stabilization in FY25 supported by disciplined pricing and balance sheet management. Meanwhile, Tier 1 capital remained stable with gradual improvement, reflecting prudent capital management, steady earnings generation, and a consistent moderate-risk approach, while ongoing strategic expansion and evolving deposit mix dynamics influenced both growth momentum and margin trajectory.
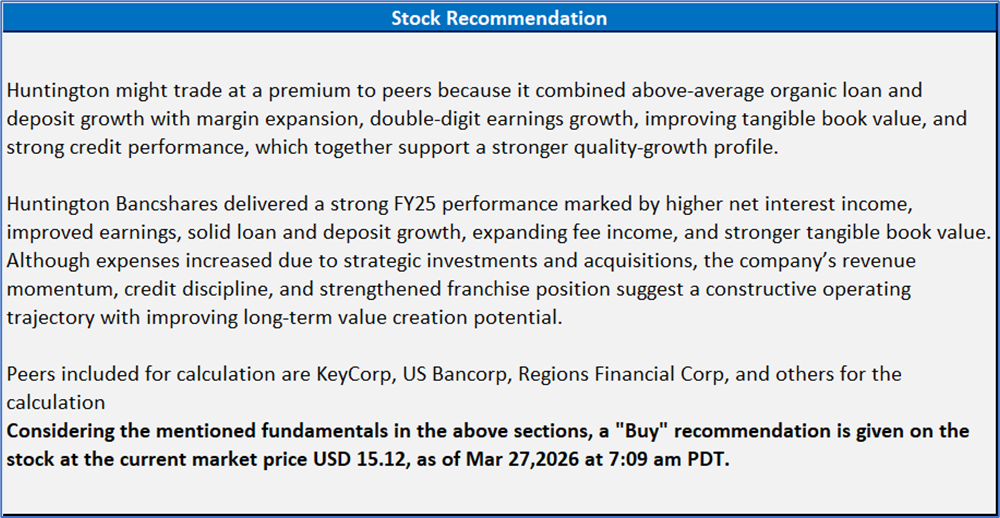
Section 2: Huntington Bancshares Incorporated (NASDAQ: HBAN) (“Buy” at the current market price of USD 15.12, as of Mar 27,2026 at 7:09 am PDT)
2.1 Company Details
2.2 Technical Guidance and Stock Recommendation
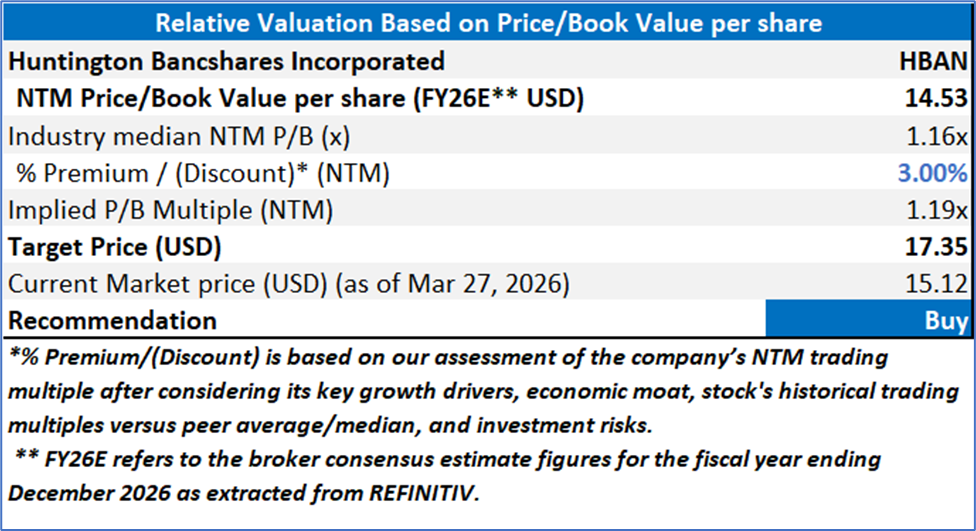
Markets are trading in a highly volatile zone currently due to certain macroeconomic issues and geopolitical tensions prevailing. Therefore, it is prudent to follow a cautious approach while investing.
Note 1: Past performance is not a reliable indicator of future performance.
Note 2: The reference date for all price data, currency, technical indicators, support, and resistance levels is March 27, 2026. The reference data in this report has been partly sourced from REFINITIV.
Note 3: Investment decisions should be made depending on an individual's appetite for upside potential, risks, holding duration, and any previous holdings. An 'Exit' from the stock can be considered if the Target Price mentioned as per the Valuation and or the technical levels provided has been achieved and is subject to the factors discussed above.
Note 4: The report publishing date is as per the Pacific Time Zone.
Technical Indicators Defined: -
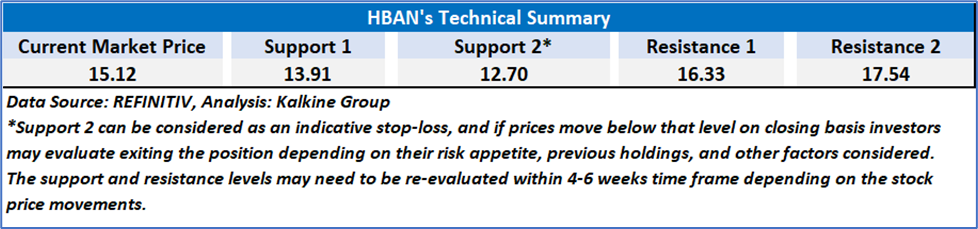
Support: A level at which the stock prices tend to find support if they are falling, and a downtrend may take a pause backed by demand or buying interest. Support 1 refers to the nearby support level for the stock and if the price breaches the level, then Support 2 may act as the crucial support level for the stock.
Resistance: A level at which the stocks prices tend to find resistance when they are rising, and an uptrend may take a pause due to profit booking or selling interest. Resistance 1 refers to the nearby resistance level for the stock and if the price surpasses the level, then Resistance 2 may act as the crucial resistance level for the stock.
Stop-loss: It is a level to protect against further losses in case of unfavorable movement in the stock prices.
Past performance is not a reliable indicator of future performance.

 NZ
 UK
 US
 AU
 IND

 CA

 Please wait processing your request...