Section 1: Company Fundamentals
1. 1 Company Overview and Performance summary
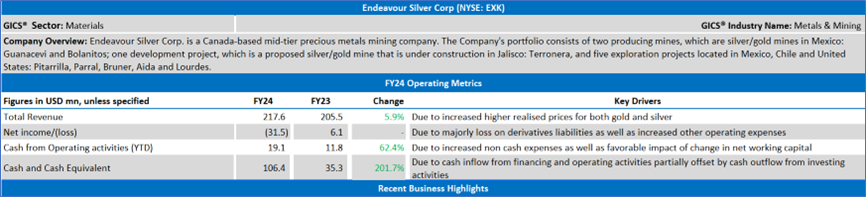
Company Overview:
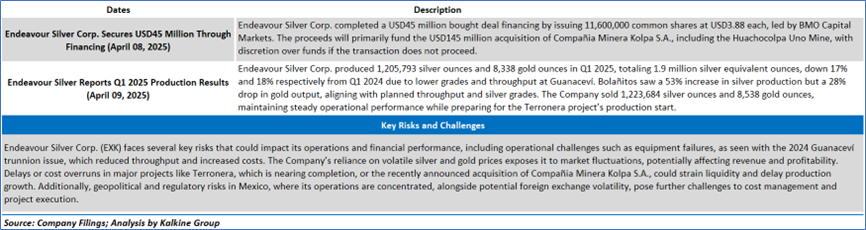
Endeavour Silver Corp. (NYSE: EXK) is a Canada-based mid-tier precious metals mining company. The Company's portfolio consists of two producing mines, which are silver/gold mines in Mexico: Guanacevi and Bolanitos; one development project, which is a proposed silver/gold mine that is under construction in Jalisco: Terronera, and five exploration projects located in Mexico, Chile and United States: Pitarrilla, Parral, Bruner, Aida and Lourdes.
This US Inflation Report covers the Company Overview & Price performance, Summary table, Key positives & negatives, Key metrics, Company details, technical guidance & Stock recommendation, and Price chart.
Price Performance:
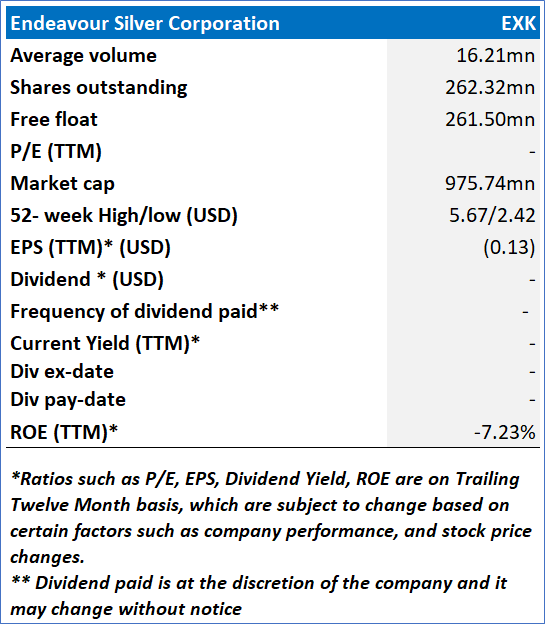
- ESK's share price has given a return of 5.66% in the past three months. Similarly, in the long term, the stock has given a return of 28.62% over the past year.
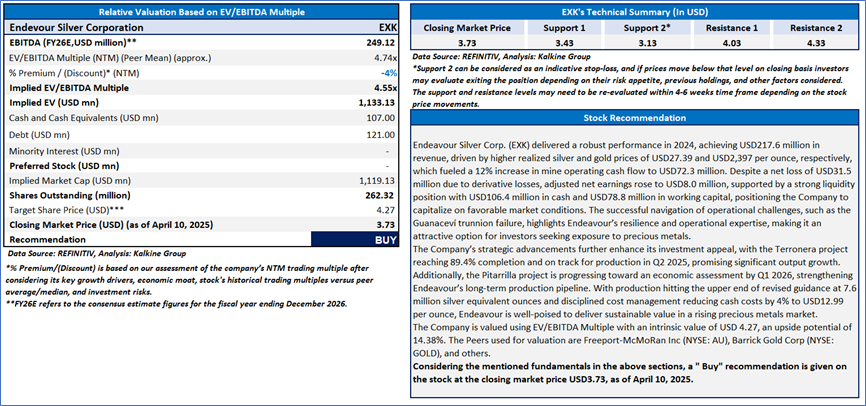
- The stock is currently trading near to the lower end of its 52-week range of USD 5.67 and 52-week low price of USD 2.42, with the expectations of an upside movement if the price sustains above an important support level of USD 3.00- USD 3.30.
- The price is currently below both its short-term (50-day) SMA and long-term (200-day) SMA, with the current RSI of around 44.97.
1.2 Summary Table
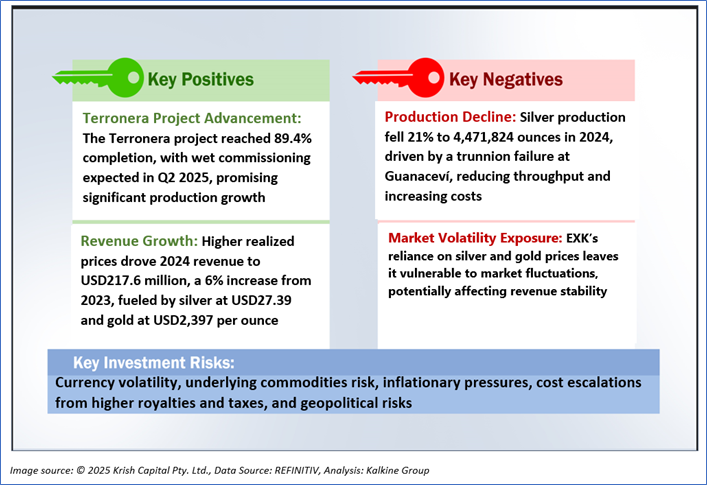
1.3 The Key Positives & Negatives
1.4 Key Metrics
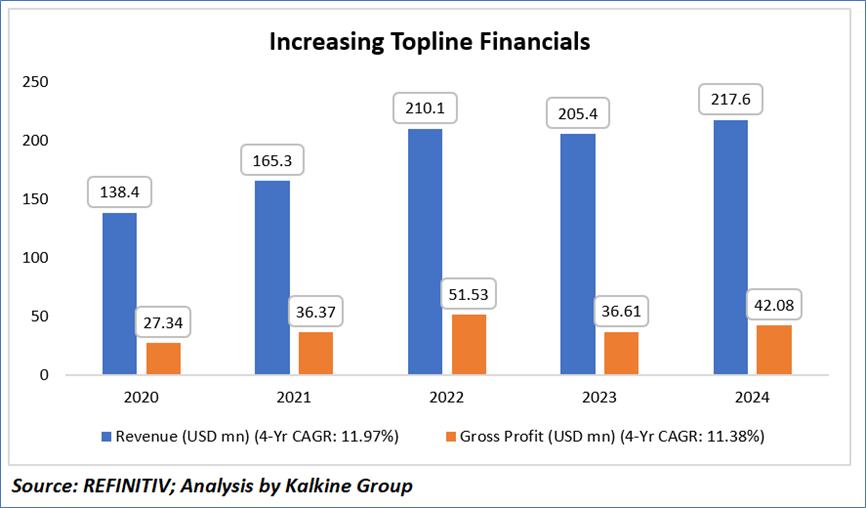
The financial performance of Endeavour Silver Corp. (EXK) over the period from 2020 to 2024 reflects a consistent upward trajectory in revenue, with figures rising from USD138.46 million in 2020 to USD217.64 million in 2024, indicating a robust growth of approximately 57% over five years, despite a slight dip in 2023 to USD205.46 million. Gross profit has also shown significant improvement, increasing from USD27.34 million in 2020 to USD42.08 million in 2024, with a notable peak of USD51.53 million in 2022, suggesting strong operational efficiency and cost management, though a decline in 2023 to USD36.61 million highlights potential challenges such as the Guanaceví trunnion failure. This overall trend underscores EXK's ability to capitalize on favorable silver and gold prices, enhance production capacity, and strategically position itself for future growth, particularly with projects like Terronera nearing completion, although maintaining consistent gross profit margins will be key amidst operational and market volatilities.
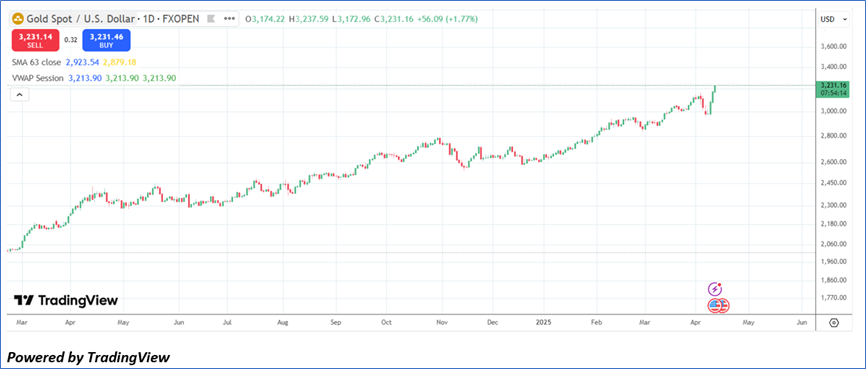
1.5 Underlying Commodity Analysis (Gold)
Gold prices advanced to a new record high, approaching USD3,200 per ounce on Friday, driven by a depreciating US dollar and heightened demand for safe-haven assets amid escalating tensions in the US-China trade conflict. This surge was precipitated by China's imposition of a 125% tariff on US goods effective April 12, 2025, coupled with its declaration to disregard additional US retaliatory measures following a series of White House tariff hikes culminating at 145%, impacting approximately USD700 billion in annual trade between the world's two largest economies and diminishing risk assets linked to global economic growth. Concurrently, the Federal Reserve has refrained from signaling any policy adjustments to curb rising long-term yields, while the March CPI report’s evidence of disinflation bolstered expectations for potential rate cuts in 2025, further underpinning the bullish outlook for gold and reinforcing its appeal as a stable investment amidst geopolitical and economic uncertainties.
Section 2: Endeavour Silver Corp (NYSE: EXK) (“Buy” at the closing market price of USD3.73, as of April 10, 2025)
2.1 Company Details
2.2 Technical Guidance and Stock Recommendation
Markets are trading in a highly volatile zone currently due to certain macroeconomic issues and geopolitical tensions prevailing. Therefore, it is prudent to follow a cautious approach while investing.
Note 1: Past performance is not a reliable indicator of future performance.
Note 2: The reference date for all price data, currency, technical indicators, support, and resistance levels is April 10, 2025. The reference data in this report has been partly sourced from REFINITIV.
Note 3: Investment decisions should be made depending on an individual's appetite for upside potential, risks, holding duration, and any previous holdings. An 'Exit' from the stock can be considered if the Target Price mentioned as per the Valuation and or the technical levels provided has been achieved and is subject to the factors discussed above.
Note 4: The report publishing date is as per the Pacific Time Zone.
Technical Indicators Defined: -
Support: A level at which the stock prices tend to find support if they are falling, and a downtrend may take a pause backed by demand or buying interest. Support 1 refers to the nearby support level for the stock and if the price breaches the level, then Support 2 may act as the crucial support level for the stock.
Resistance: A level at which the stocks prices tend to find resistance when they are rising, and an uptrend may take a pause due to profit booking or selling interest. Resistance 1 refers to the nearby resistance level for the stock and if the price surpasses the level, then Resistance 2 may act as the crucial resistance level for the stock.
Stop-loss: It is a level to protect against further losses in case of unfavorable movement in the stock prices.
Past performance is not a reliable indicator of future performance.

 Please wait processing your request...