Section 1: Company Fundamentals
1.1 Company Overview and Performance summary
Company Overview:
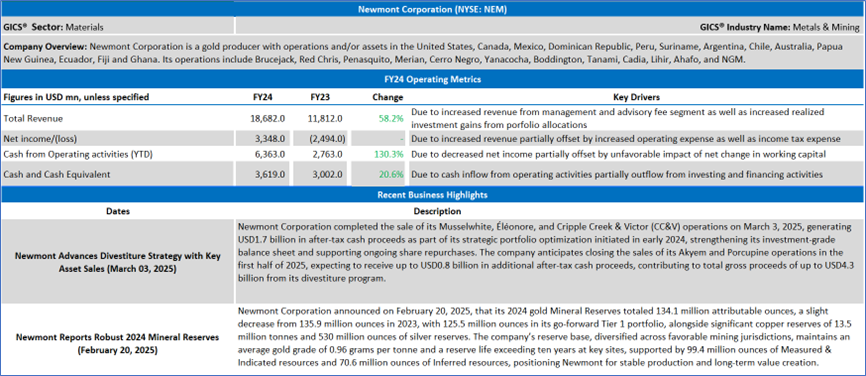
Newmont Corporation (NYSE: NEM) is a gold producer with operations and/or assets in the United States, Canada, Mexico, Dominican Republic, Peru, Suriname, Argentina, Chile, Australia, Papua New Guinea, Ecuador, Fiji and Ghana. Its operations include Brucejack, Red Chris, Penasquito, Merian, Cerro Negro, Yanacocha, Boddington, Tanami, Cadia, Lihir, Ahafo, and NGM.
This US Inflation Report covers the Company Overview & Price performance, Summary table, Key positives & negatives, Key metrics, Company details, technical guidance & Stock recommendation, and Price chart.
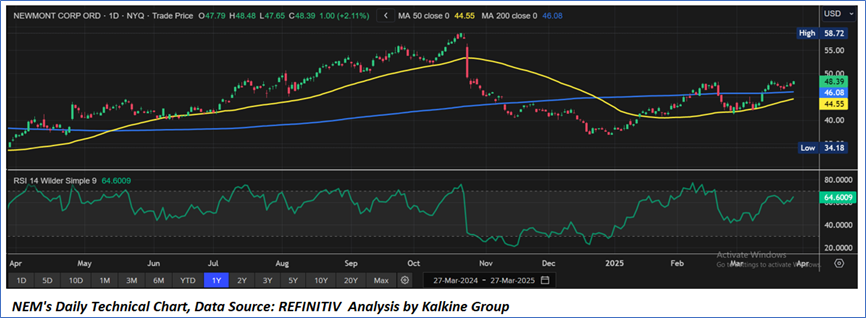
Price Performance:
- NEM's share price has given a return of 27.04% in the past three months. Similarly, in the long term, the stock has given a return of 37.27% over the past year.
- The stock is currently trading near to the higher end of its 52-week range of USD 58.72 and 52-week low price of USD 34.18, with the expectations of an upside movement if the price sustains above an important support level of USD 44.00- USD 46.00.
- The price is currently above both its short-term (50-day) SMA and long-term (200-day) SMA, with the current RSI of around 64.60.
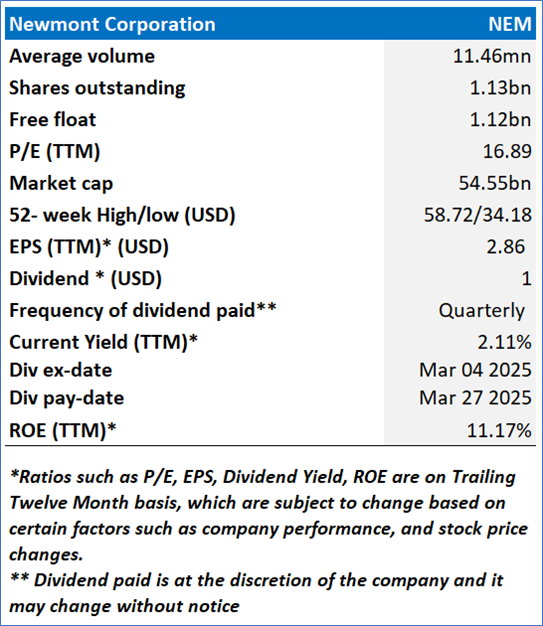
1.2 Summary Table
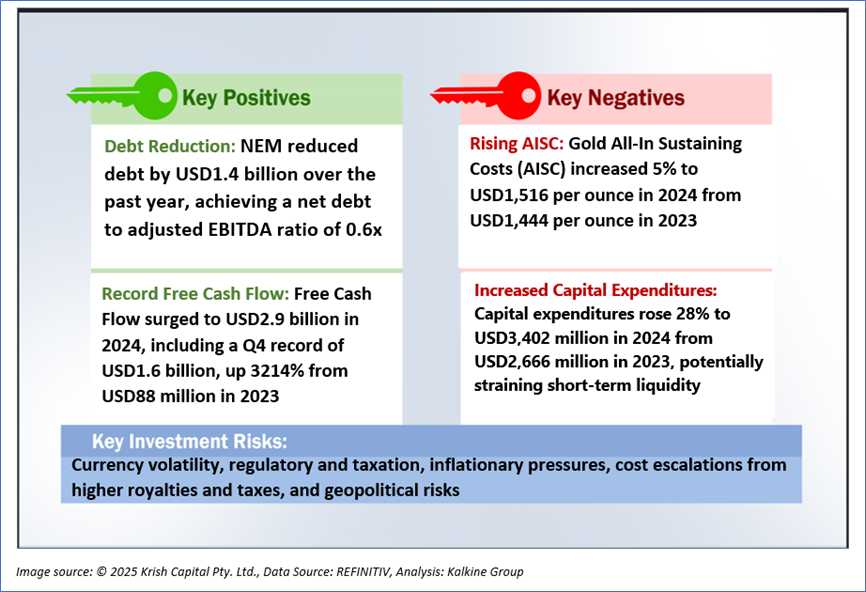
1.3 The Key Positives & Negatives
1.4 Key Metrics
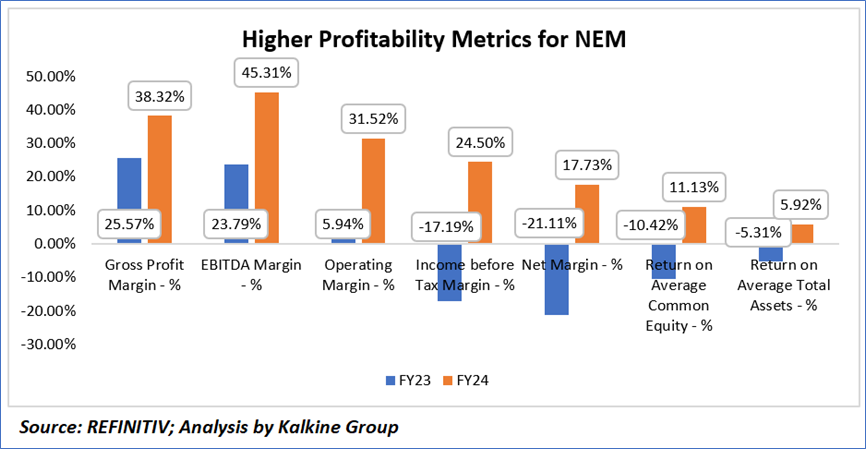
Newmont Corporation (NEM) demonstrated significant financial improvement from FY23 to FY24, with the gross profit margin increasing from 25.57% to 38.32%, reflecting enhanced cost efficiency and higher realized gold prices, which rose 23% to USD2,408 per ounce in 2024, while EBITDA margin surged from 23.79% to 45.31%, driven by a 106% increase in Adjusted EBITDA to USD8.7 billion, indicating strong operational performance. The operating margin improved dramatically from 5.94% to 31.52%, and the income before tax margin shifted from a negative 17.19% to a positive 24.50%, supported by a net income of USD3.4 billion in 2024 compared to a USD2.494 billion loss in 2023, while the net margin turned positive at 17.73% from a negative 21.11%, reflecting improved profitability. Additionally, return on average common equity rose from a negative 10.42% to 11.13%, and return on average total assets increased from a negative 5.31% to 5.92%, underscoring Newmont’s ability to generate better returns on its capital and assets.
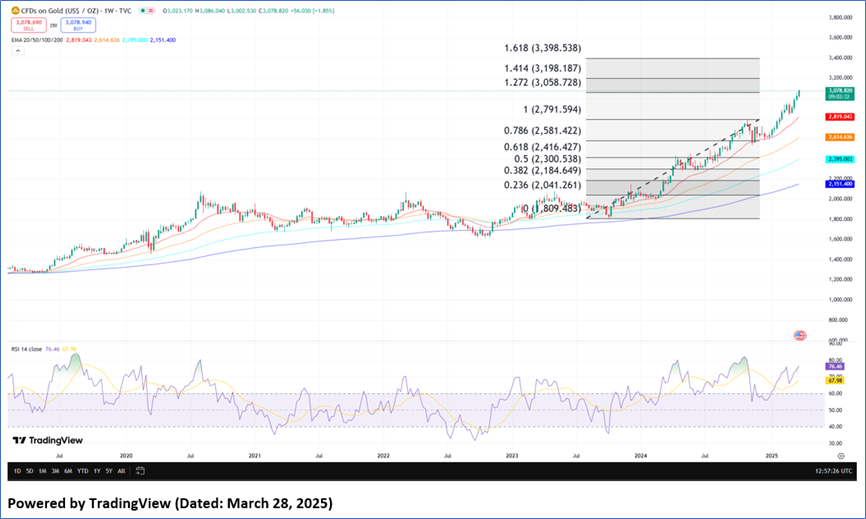
1.5 Underlying Commodity Analysis (Gold)
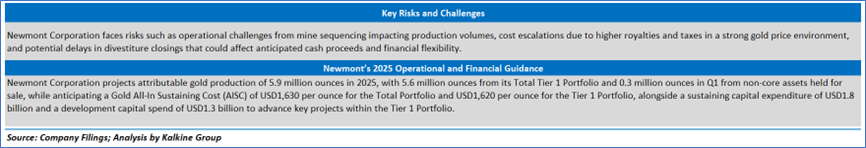
As of March 28, 2025, gold prices have surged to a record high of approximately USD3,080 per ounce, driven by heightened risk aversion stemming from escalating trade tensions following U.S. President Donald Trump’s announcement of 25% tariffs on foreign-made cars and auto parts, set to take effect next week, which has prompted retaliation threats from the European Union and Canada, raising fears of a broader trade dispute and potential global economic fallout. This safe-haven demand is further bolstered by strong central bank inflows and rising ETF demand, with global physically-backed gold ETFs seeing significant inflows of USD9.4 billion in February—the largest since March 2022—pushing total holdings to their highest since August 2023, while central banks, including those in Uzbekistan, China, and India, continue to diversify reserves amid de-dollarization trends. Additionally, gold’s upward momentum is supported by a favorable monetary policy outlook, as the Federal Reserve held rates steady last week but reaffirmed two rate cuts by year-end, with traders closely monitoring the upcoming U.S. PCE data—forecasted at 2.5%—for insights into the Fed’s next moves, as a lower-than-expected reading could enhance gold’s appeal in a low-interest-rate environment. Bullion is on track for its fourth consecutive weekly gain and its largest monthly rise since March 2024.
Section 2: Newmont Corporation (NYSE: NEM) (“Buy” at the closing market price of USD48.39, as of March 27, 2025)
2.1 Company Details
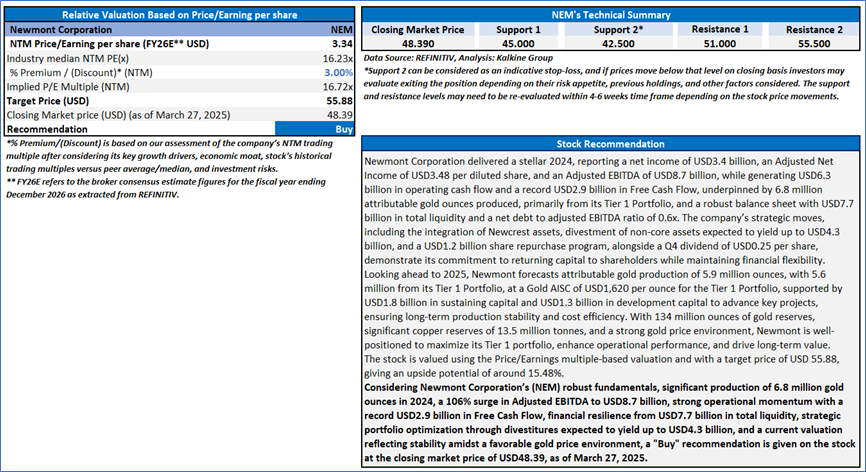
2.2 Technical Guidance and Stock Recommendation
Markets are trading in a highly volatile zone currently due to certain macroeconomic issues and geopolitical tensions prevailing. Therefore, it is prudent to follow a cautious approach while investing.
Note 1: Past performance is not a reliable indicator of future performance.
Note 2: The reference date for all price data, currency, technical indicators, support, and resistance levels is March 27, 2025. The reference data in this report has been partly sourced from REFINITIV.
Note 3: Investment decisions should be made depending on an individual's appetite for upside potential, risks, holding duration, and any previous holdings. An 'Exit' from the stock can be considered if the Target Price mentioned as per the Valuation and or the technical levels provided has been achieved and is subject to the factors discussed above.
Note 4: The report publishing date is as per the Pacific Time Zone.
Technical Indicators Defined: -
Support: A level at which the stock prices tend to find support if they are falling, and a downtrend may take a pause backed by demand or buying interest. Support 1 refers to the nearby support level for the stock and if the price breaches the level, then Support 2 may act as the crucial support level for the stock.
Resistance: A level at which the stocks prices tend to find resistance when they are rising, and an uptrend may take a pause due to profit booking or selling interest. Resistance 1 refers to the nearby resistance level for the stock and if the price surpasses the level, then Resistance 2 may act as the crucial resistance level for the stock.
Stop-loss: It is a level to protect against further losses in case of unfavorable movement in the stock prices.
Past performance is not a reliable indicator of future performance.

 Please wait processing your request...