
Section 1: Introduction
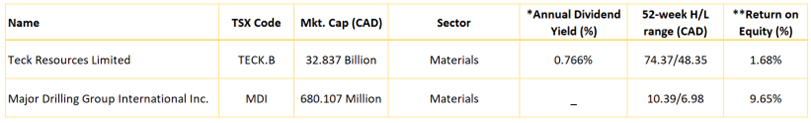

Section 2: Company Overview
Teck (TSX: Teck.b) is a diversified miner with coal, copper, zinc, and oil sands operations in Canada, the United States, Chile, and Peru. Metallurgical coal is Teck's primary commodity in terms of EBITDA contribution, closely followed by copper, with zinc and oil sands contributing smaller amounts to earnings. Teck ranks as the world's second- largest exporter of seaborne metallurgical coal and is a top three zinc miner. It is building a major new copper mine in Chile at the majority-owned Quebrada Blanca 2, in partnership with Sumitomo. Kalkine’s Inflation Report covers the Investment Highlights, Key Financial Metrics, Risks, Technical Analysis along with the Valuation, Target Price, and Recommendation on the stock.
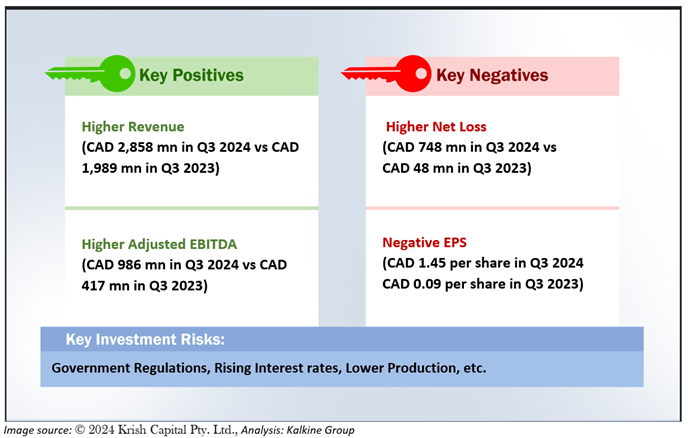
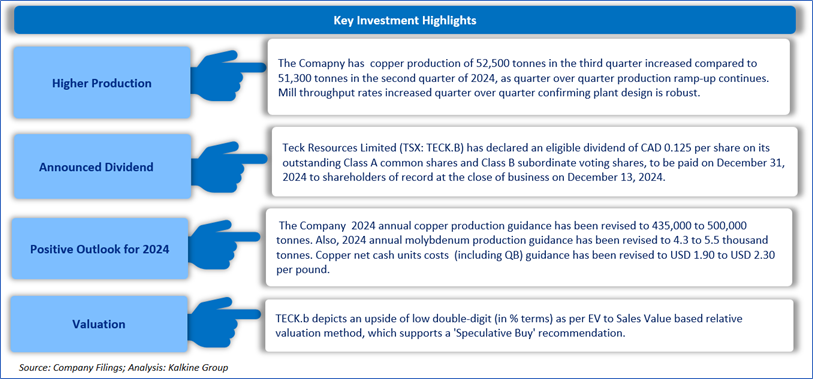
2.1 The Key Positives, Negatives, Investment Highlights, and Risks
Section3: Financial Highlights
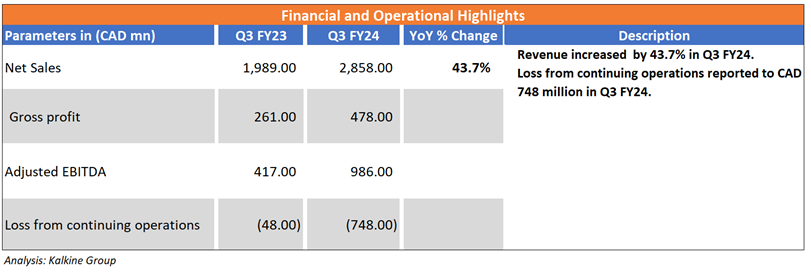
3.1 Key Financial Highlights
Section 4: Key Metrics
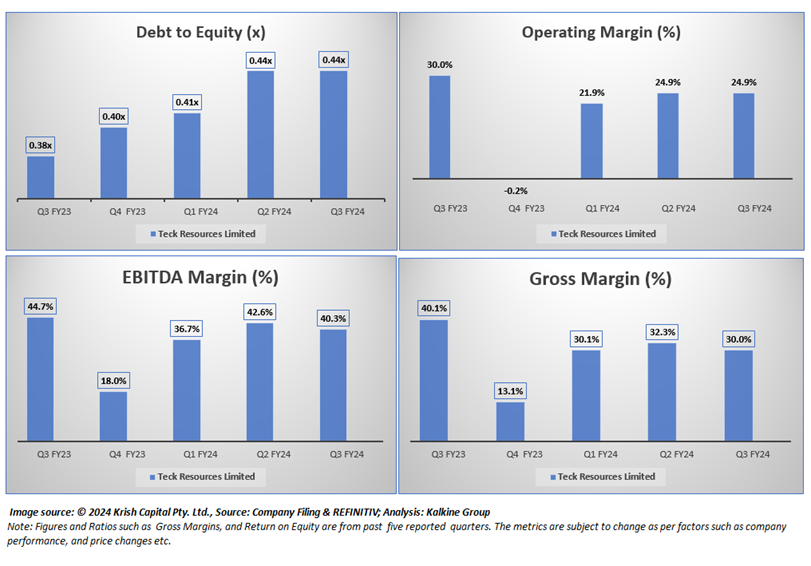
Below charts depict the change in Operating Margin, EBITDA Margins and Gross Margins for the firm for the last 5 reported quarters.
Section 5: Stock Recommendation Summary
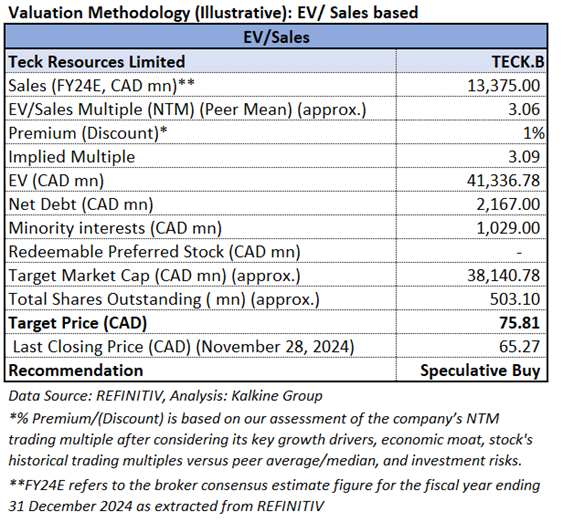
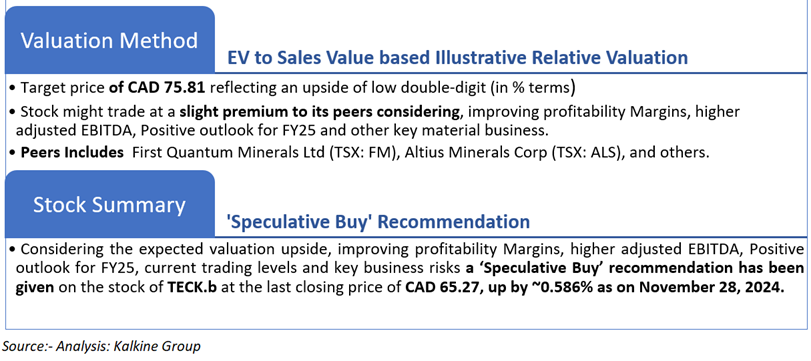
5.1 Valuation Methodology Illustrative EV to Sales Based
5.2 Price Performance and Stock Recommendation

The stock has witnessed a downside of ~1.93% in 1 month and of ~2.99% over the last 3 months. Moreover, the stock is trading below the average 52-week high price of CAD 74.37 and 52-week low price of CAD 48.35 providing an opportunity to ride the trend.
5.3 One-Year Technical Price Chart
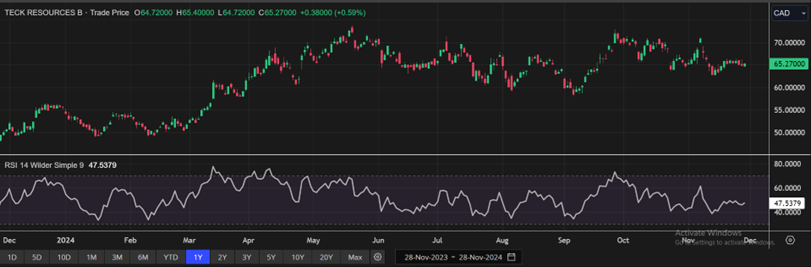
One-Year Technical Price Chart (as of November 28, 2024). Source: REFINITIV, Analysis: Kalkine Group
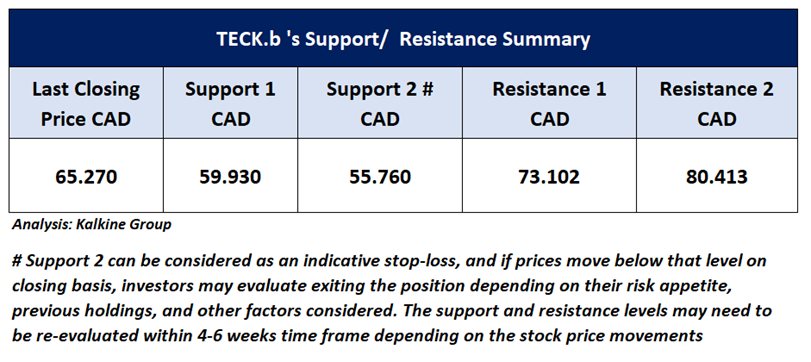
5.4 Technical Summary
Major Drilling Group International Inc
Section 1: Company Overview
Major Drilling Group International Inc (TSX: MDI) is engaged in the business of contract drilling, and it provides services to companies that are involved in mining and mineral exploration. Kalkine’s Inflation Report covers the Investment Highlights, Key Financial Metrics, Risks, Technical Analysis along with the Valuation, Target Price, and Recommendation on the stock.
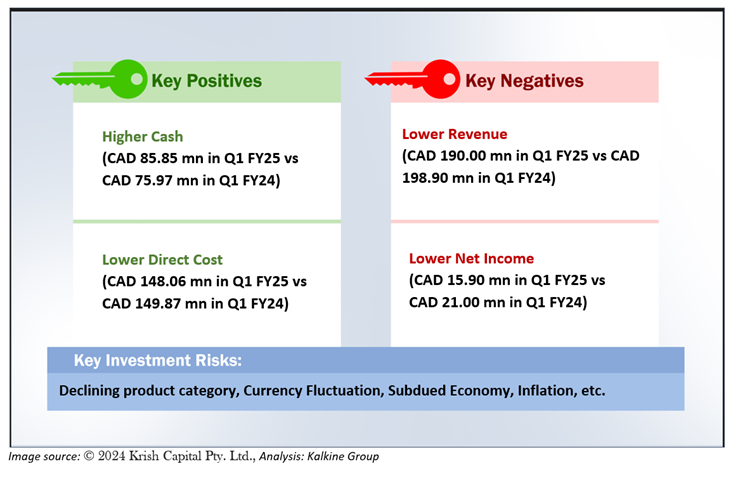
1.1 The Key Positives, Negatives, Investment Highlights, and Risks
Section2: Financial Highlights
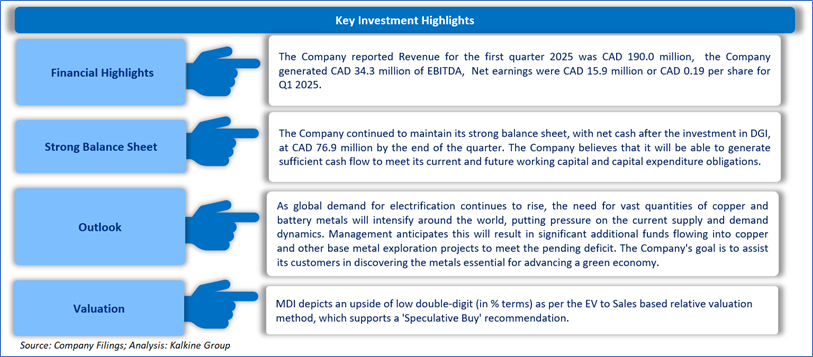
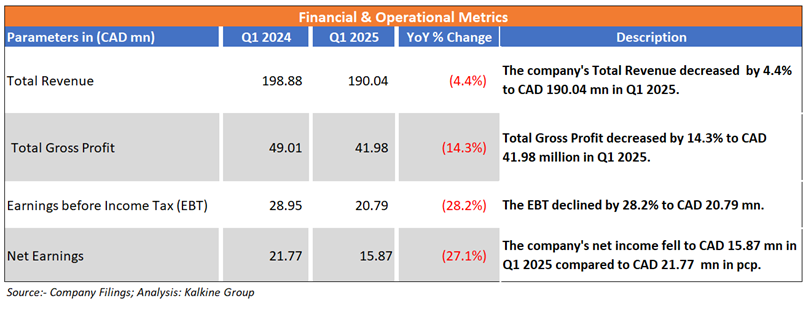
2.1 Key Financial Highlights
Section 3: Key Metrics
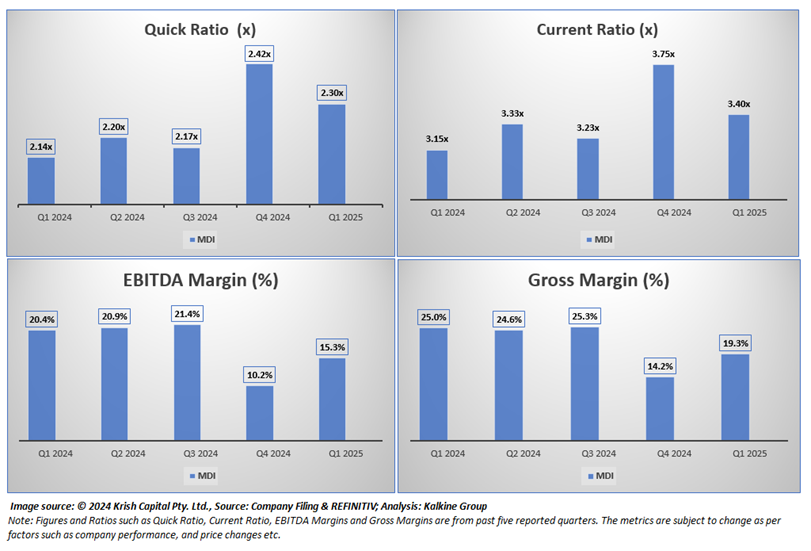
Below charts depict the change in Quick Ratio, Current Ratio, EBITDA Margin of the Company for the last five reported quarters.
Section 4: Stock Recommendation Summary
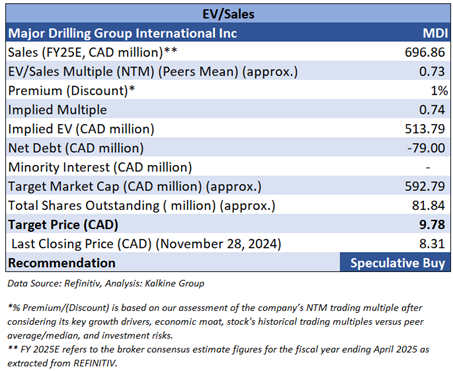
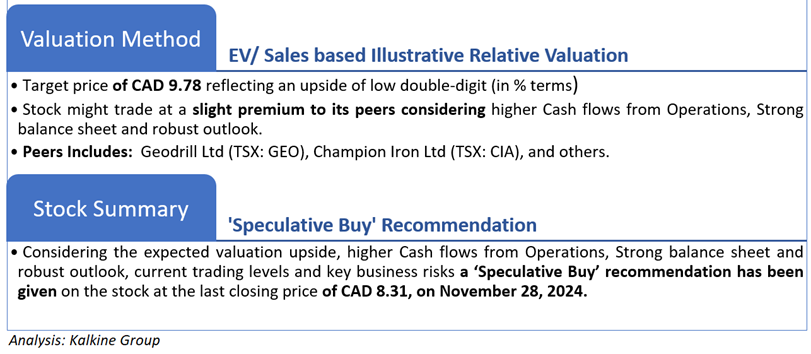
4.1 Valuation Methodology Illustrative EV to Sales Based
4.2 Price Performance and Stock Recommendation

The stock has witnessed a downside of ~2.35% in 1 month and a downside of ~12.15% over the last 3 months. Moreover, the stock is trading slightly below the average of 52-week high price of CAD 10.39 and 52-week low price of CAD 6.98 providing an opportunity to ride the trend.
4.3 One-Year Technical Price Chart
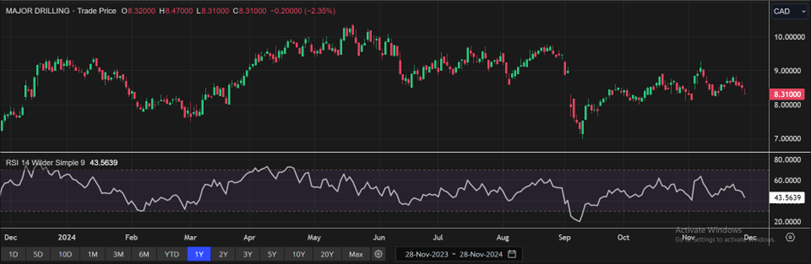
One-Year Technical Price Chart (as of November 28, 2024). Source: REFINITIV, Analysis: Kalkine Group
4.4 Technical Summary
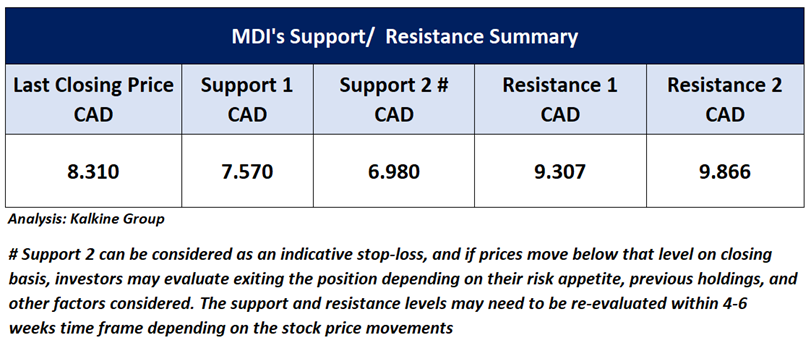
Note 1: Past performance is not a reliable indicator of future performance.
Note 2: The reference date for all price data, currency, technical indicators, support, and resistance levels is November 28, 2024. The reference data in this report has been partly sourced from REFINITIV.
Note 3: Investment decisions should be made depending on an individual's appetite for upside potential, risks, holding duration, and any previous holdings. An 'Exit' from the stock can be considered if the Target Price mentioned as per the Valuation and or the technical levels provided has been achieved and is subject to the factors discussed above.
Note 4: Dividend Yield may vary as per the stock price movement.
Technical Indicators Defined: -
Support: A level at which the stock prices tend to find support if they are falling, and a downtrend may take a pause backed by demand or buying interest.
Resistance: A level at which the stock prices tend to find resistance when they are rising, and the uptrend may take a pause due to profit booking or selling interest.
Stop-loss: In general, it is a level to protect further losses in case of any unfavourable movement in the stock prices.
The advice given by Kalkine Canada Advisory Services Inc. and provided on this website is general information only and it does not take into account your investment objectives, financial situation and the particular needs of any particular person. You should therefore consider whether the advice is appropriate to your investment objectives, financial situation and needs before acting upon it. You should seek advice from a financial adviser, stockbroker or other professional (including taxation and legal advice) as necessary before acting on any advice. Not all investments are appropriate for all people. The website www.kalkine.ca is published by Kalkine Canada Advisory Services Inc. The link to our Terms & Conditions has been provided please go through them. On the date of publishing this report (mentioned on the website), employees and/or associates of Kalkine do not hold positions in any of the stocks covered on the website. These stocks can change any time and readers of the reports should not consider these stocks as advice or recommendations later.
 Please wait processing your request...