Section 1: Introduction
Overview & Key Concepts:
Inflation is the gradual loss in purchasing power, primarily due to an increase in the price levels of goods and services over a given period.
- Inflation: A sustained increase in the general price level of goods and services, reducing purchasing power.
- Deflation: A decrease in the general price level of goods and services, increasing the real value of money but potentially leading to reduced spending and business profits.
- Disinflation: A slowdown in the rate of inflation, meaning prices are still rising but at a slower pace.
- Stagflation: A combination of stagnant economic growth, high unemployment, and high inflation, presenting complex economic challenges.
Drivers and Causes of Inflation:
- Demand-Pull Inflation: Occurs when demand for goods and services exceeds supply, leading to price increases.
- Cost-Push Inflation: Results from rising production costs, such as wages and raw materials, causing producers to raise prices.
- Built-In Inflation (Wage-Price Spiral): Happens when workers demand higher wages to cope with increased living costs, leading to further price hikes in a self-reinforcing cycle.
Inflation Data for Canada - April 2025:
- According to the Statistics Canada, in April 2025, Canada's Consumer Price Index (CPI) rose by 1.7% YoY, easing from a 2.3% increase recorded in March. The decline was primarily attributed to a significant drop in energy prices, which declined by 12.7% following a modest 0.3% dip in the previous month. However, excluding energy, the CPI climbed 2.9% in April, up from 2.5% in March. Offsetting some of the overall slowdowns were rising costs for travel tours (+6.7%) and food purchased from stores (+3.8%). On a monthly basis, the CPI edged down 0.1%, and on a seasonally adjusted basis, it declined 0.2%.
- According to the Trading Economics, Canada's annual inflation rate dropped to 7% in April 2025 (from 2.3% in March), it’s lowest in seven months, primarily due to a 12.7% decline in energy prices. This was driven by the removal of the consumer carbon tax and OPEC oil output hikes, leading to cheaper gasoline and natural gas. While transportation and shelter costs slowed, prices rose for travel, groceries, household goods, and recreation. However, the Bank of Canada's preferred core inflation measure (trimmed-mean CPI) surprisingly accelerated to 3.1%, hitting a two-year high.
Upcoming Release Dates for Key Canadian Economic Data:
- May 30, 2025: Canada’s GDP Implicit Price QoQ Announcement Date.
- June 4, 2025: Bank of Canada Interest Rate Announcement Date.
Inflation Report Coverage:
- Inflation report highlights how inflation impacts sectors differently, favoring value and defensive sectors like Energy, Materials, Consumer Staples, Healthcare, Utilities, select Financials, and REITs with inflation-indexed leases, while rate-sensitive sectors like Consumer Discretionary and high-growth Tech typically underperform.
- The report focuses on companies with proven business models, steady financials, high free cash flow, and solid ROE that can pass on costs to customers and protect margins. The aim is to identify stocks that can outperform inflation via capital gains and dividends, supporting diversified sectoral exposure.
Stocks Covered:
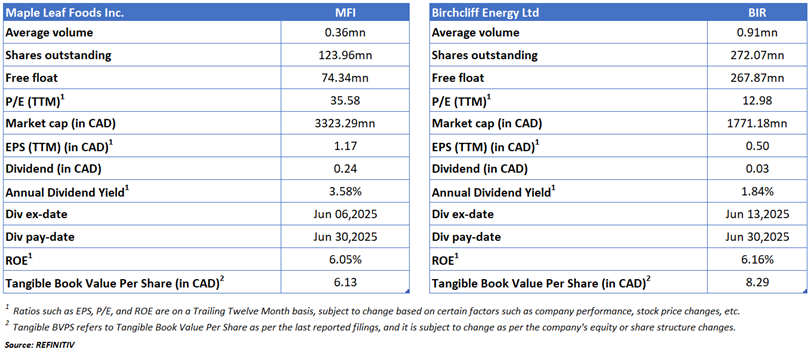
- Maple Leaf Foods Inc. (TSX: MFI) is well-positioned to benefit from easing inflationary pressures in Canada. As food inflation moderates, consumer purchasing power is expected to recover, supporting volume growth in branded protein products. Additionally, the company’s strategic cost-reduction efforts and operational efficiencies enhance its ability to preserve margins in a deflationary or stable price environment.
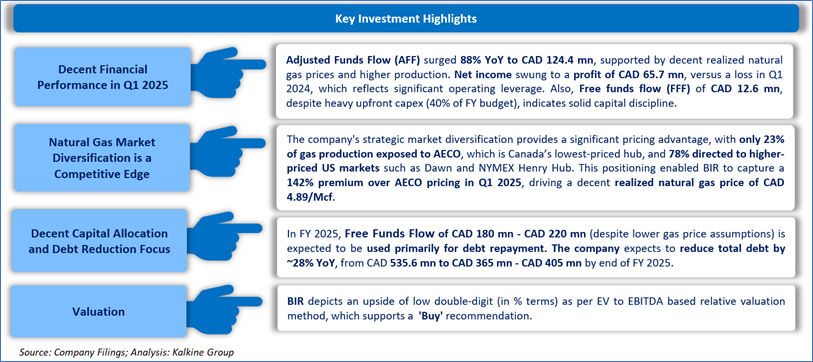
- Birchcliff Energy Ltd. (TSX: BIR) positioning in higher-priced US natural gas markets helps insulate it from the impacts of rising Canadian inflation, which can increase operating costs domestically. By capturing a premium price for the majority of its production outside of the lower-priced AECO hub, the company is better equipped to maintain healthy cash flows and profitability even as inflation pressures rise in Canada.
Section 2: Company Overview
Maple Leaf Foods Inc. (TSX: MFI) is a consumer-packaged meats company. It produces prepared meats and meals, fresh pork, and poultry and turkey products. The company also has agribusiness operations. These operations supply livestock to the meat products business operations. Its main markets are Canada, the United States, Japan, and China. The key brands are Maple Leaf and Schneiders, Maple Leaf Prime Naturally, Shopsy, Mitchell's Gourmet Food, Larse, Parm, and Hygrade.
Kalkine’s Inflation Report covers the Investment Highlights, Key Financial Metrics, Risks, Technical Analysis along with the Valuation, Target Price, and Recommendation on the stock.
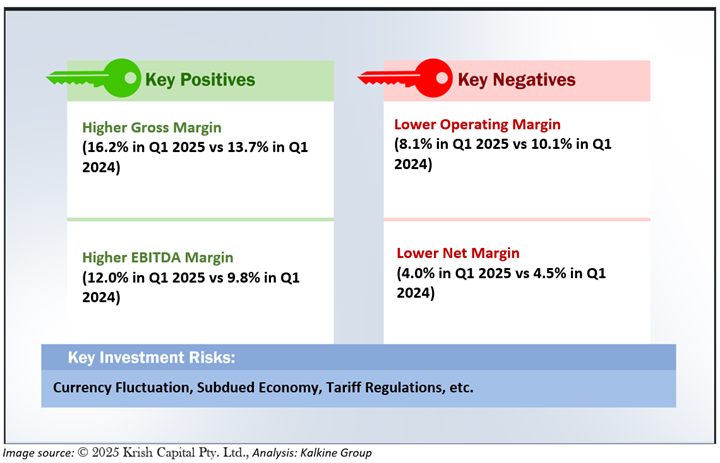
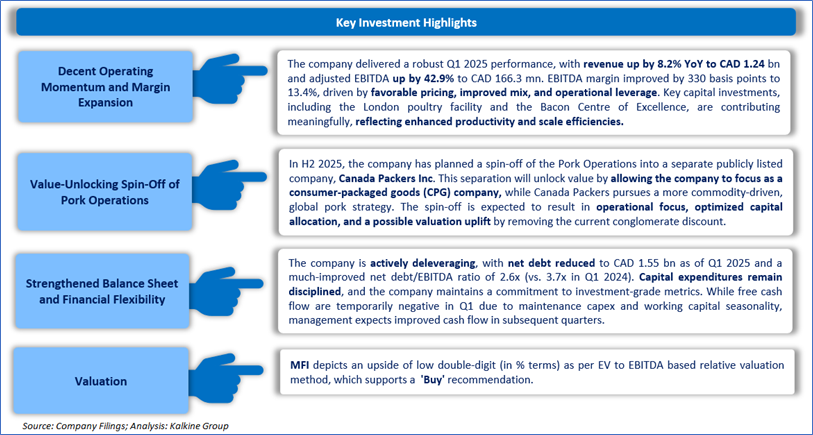
2.1 The Key Positives, Negatives, Investment Highlights, and Risks
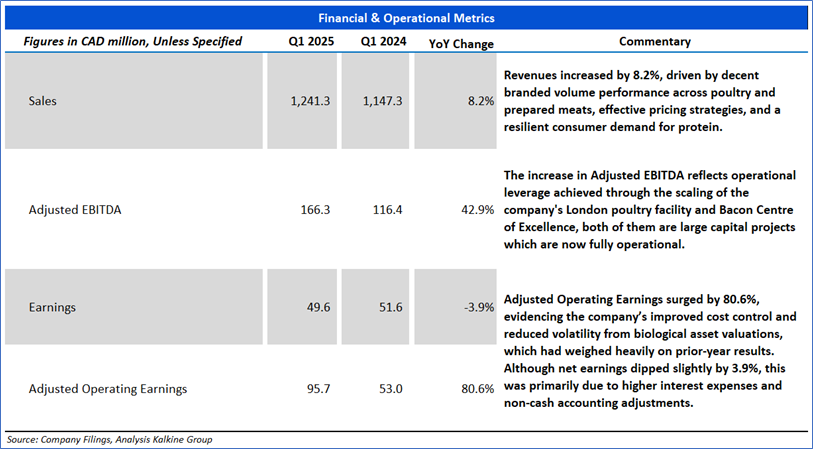
Section3: Financial Highlights
3.1 Key Financial Highlights
Section 4: Key Metrics
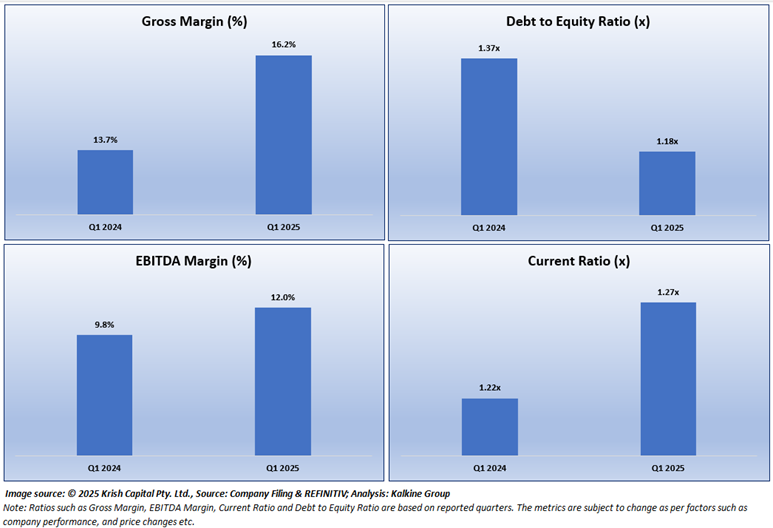
Below chart depicts the change in Gross Margin, Debt to Equity Ratio, EBITDA Margin and Current Ratio of the Company for Q1 2025 and Q1 2024.
Section 5: Stock Recommendation Summary
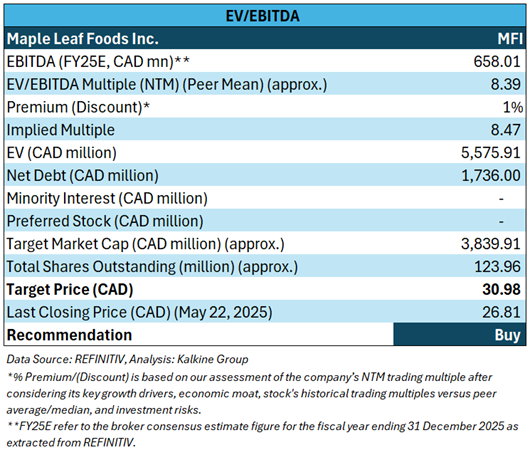
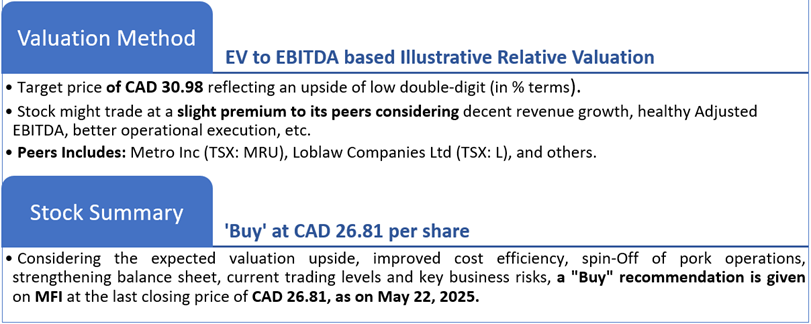
5.1 Valuation Methodology (Illustrative): EV to EBITDA Based Relative Valuation approach:
5.2 Price Performance and Stock Recommendation

The stock has witnessed an upside of ~2.72% in 1 week and ~9.47% over the last 1 month. Moreover, the stock is trading above the average 52-week high price of CAD 27.98 and 52-week low price of CAD 19.61, providing an opportunity to ride the trend.
5.3 One-Year Technical Price Chart
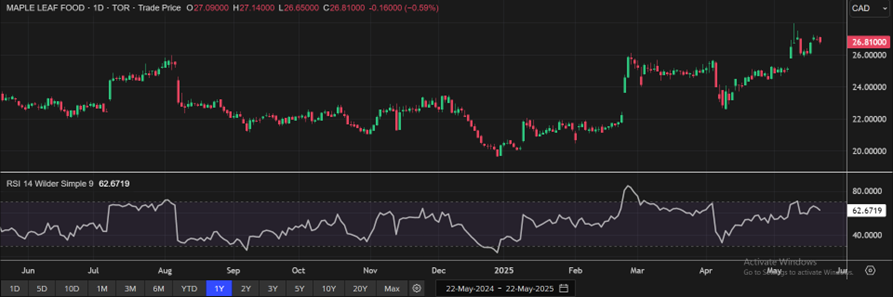
One-Year Technical Price Chart (as of May 22, 2025). Source: REFINITIV, Analysis: Kalkine Group
5.4 Technical Summary
Section 1: Company Overview
Birchcliff Energy Ltd. (TSX: BIR) is an intermediate oil and gas company that explores for, develops, and produces natural gas, light oil, and natural gas liquids. The company conducts its drilling program in resource plays located in the Peace River Arch region of Alberta. Birchcliff focuses on operating nearly all its high working production, which is surrounded by blocks of high-working interest lands where it owns and/or controls the infrastructure. To get the full value out of its natural gas wells, several gas plants are completely owned and operated for gas processing purposes. Natural gas production accounts for the majority of its revenue.
Kalkine’s Inflation Report covers the Investment Highlights, Key Financial Metrics, Risks, Technical Analysis along with the Valuation, Target Price, and Recommendation on the stock.
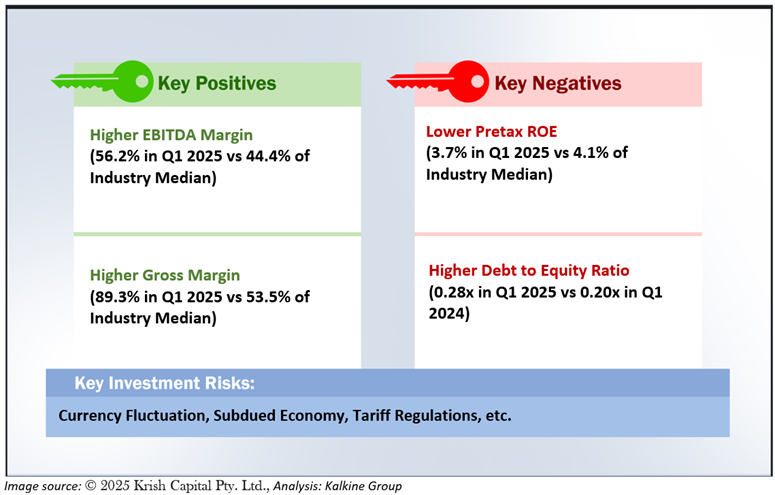
1.1 The Key Positives, Negatives, Investment Highlights, and Risks
Section 2: Financial Highlightsk
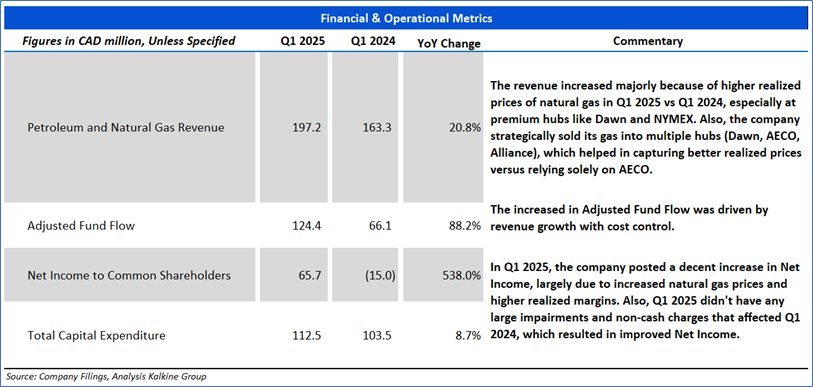
2.1 Key Financial Highlights
Section 3: Key Metrics
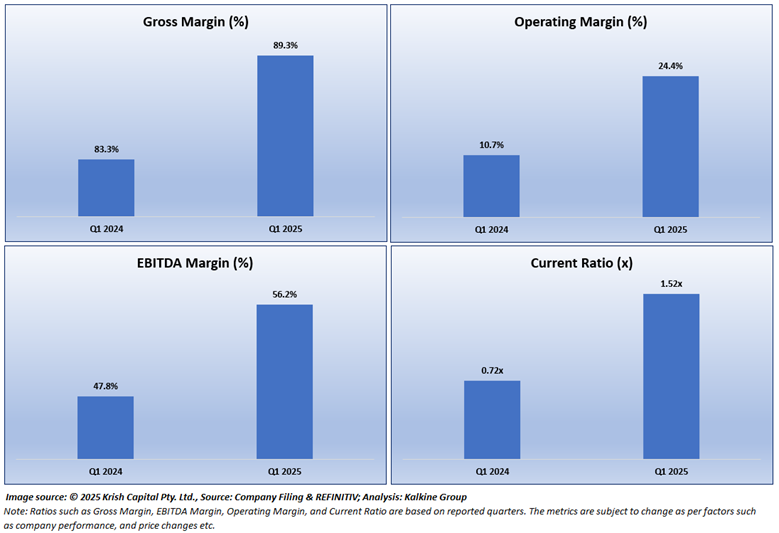
Below chart depicts the change in Gross Margin, EBTIDA Margin, Operating Margin and Current Ratio of the Company for Q1 2025 and Q1 2024.
Section 4: Stock Recommendation Summary
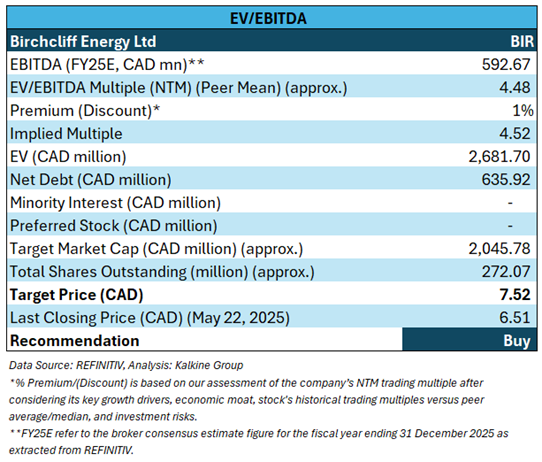
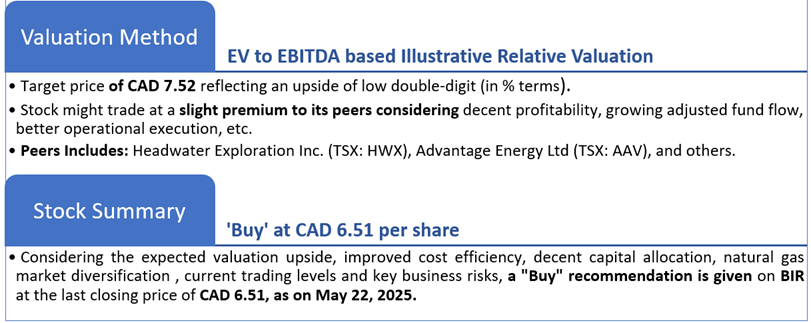
4.1 Valuation Methodology (Illustrative): EV to EBITDA Based Relative Valuation approach
4.2 Price Performance and Stock Recommendation

The stock has witnessed an upside of ~1.40% in 1 week and ~8.86% over the last 3 months. Moreover, the stock is trading above the average 52-week high price of CAD 6.94 and the 52-week low price of CAD 4.53, providing an opportunity to ride the trend.
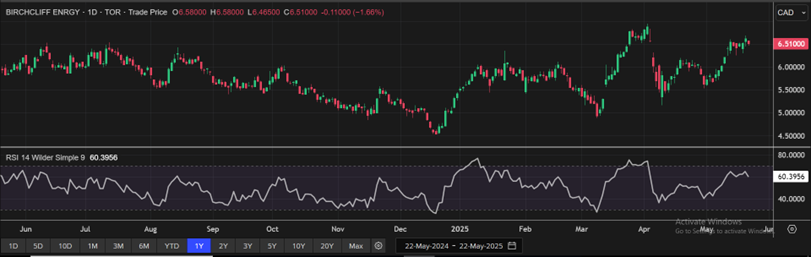
4.3 One-Year Technical Price Chart
One-Year Technical Price Chart (as of May 22, 2025). Source: REFINITIV, Analysis: Kalkine Group
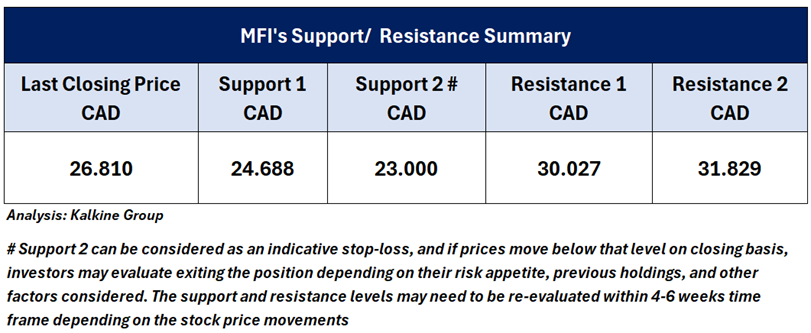
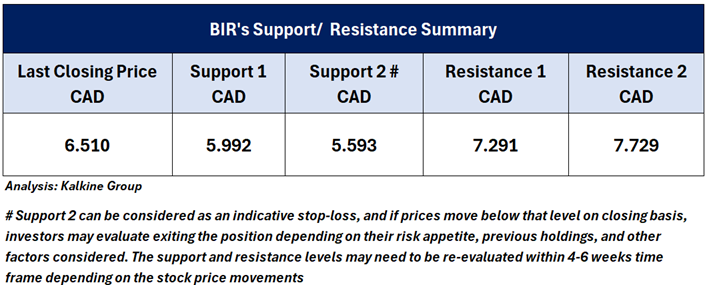
4.4 Technical Summary
Note 1: Past performance is not a reliable indicator of future performance.
Note 2: The reference date for all price data, currency, technical indicators, support, and resistance levels is May 22, 2025. The reference data in this report has been partly sourced from REFINITIV.
Note 3: Investment decisions should be made depending on an individual's appetite for upside potential, risks, holding duration, and any previous holdings. An 'Exit' from the stock can be considered if the Target Price mentioned as per the Valuation and or the technical levels provided has been achieved and is subject to the factors discussed above.
Note 4: Dividend Yield may vary as per the stock price movement.
Note 5: Kalkine reports are prepared based on the stock prices captured either from REFINITIV or Trading View. Typically, REFINITIV or Trading View may reflect stock prices with a delay which could be a lag of 25-30 minutes. There can be no assurance that future results or events will be consistent with the information provided in the report. The information is subject to change without any prior notice.
Technical Indicators Defined: -
Support: A level at which the stock prices tend to find support if they are falling, and a downtrend may take a pause backed by demand or buying interest.
Resistance: A level at which the stock prices tend to find resistance when they are rising, and the uptrend may take a pause due to profit booking or selling interest.
Stop-loss: In general, it is a level to protect further losses in case of any unfavourable movement in the stock prices.
Past performance is not a reliable indicator of future performance.

 Please wait processing your request...