Section 1: Introduction
Overview & Key Concepts:
Inflation is the gradual loss in purchasing power, primarily due to an increase in the price levels of goods and services over a given period.
- Inflation: A sustained increase in the general price level of goods and services, reducing purchasing power.
- Deflation: A decrease in the general price level of goods and services, increasing the real value of money but potentially leading to reduced spending and business profits.
- Disinflation: A slowdown in the rate of inflation, meaning prices are still rising but at a slower pace.
- Stagflation: A combination of stagnant economic growth, high unemployment, and high inflation, presenting complex economic challenges.
Drivers and Causes of Inflation:
- Demand-Pull Inflation: Occurs when demand for goods and services exceeds supply, leading to price increases.
- Cost-Push Inflation: Results from rising production costs, such as wages and raw materials, causing producers to raise prices.
- Built-In Inflation (Wage-Price Spiral): Happens when workers demand higher wages to cope with increased living costs, leading to further price hikes in a self-reinforcing cycle.
Inflation Data for Canada - March 2025
- In March 2025, Canada's Consumer Price Index (CPI) rose 2.3% YoY, down from a 2.6% increase in February. This slowdown was primarily due to lower prices for travel tours and gasoline. Excluding gasoline, the CPI rose 2.5% in March. On a monthly basis, the CPI increased by 0.3%, while on a seasonally adjusted monthly basis, it remained unchanged.
Upcoming Release Dates for Key Canadian Economic Data:
- May 20, 2025: Release of the Consumer Price Index for April 2025.
- June 4, 2025: Bank of Canada Interest Rate Announcement Date.
Inflation Report Coverage:
- Inflation report highlights how inflation impacts sectors differently, favoring value and defensive sectors like Energy, Materials, Consumer Staples, Healthcare, Utilities, select Financials, and REITs with inflation-indexed leases, while rate-sensitive sectors like Consumer Discretionary and high-growth Tech typically underperform.
- The report focuses on companies with proven business models, steady financials, high free cash flow, and solid ROE that can pass on costs to customers and protect margins. The aim is to identify stocks that can outperform inflation via capital gains and dividends, supporting diversified sectoral exposure.
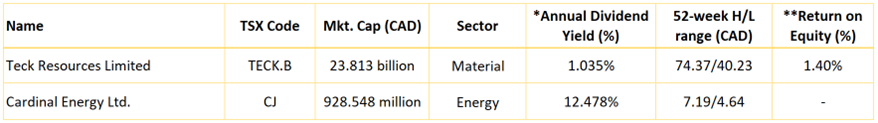
Stocks Covered:
- Teck Resources Limited (TSX: TECK.B) is strategically positioned in the Materials sector, which historically outperforms during inflationary periods due to the decent pricing power of commodities. As inflation pushes input costs higher, the company benefits from rising commodity prices, particularly copper, zinc, and steelmaking coal, where global demand remains elevated due to infrastructure investment, electrification, and industrial activity.
- Cardinal Energy Ltd (TSX: CJ) operates in the Energy sector, a traditional beneficiary of inflationary pressures, especially cost-push inflation, as energy prices tend to rise. Crude oil and natural gas are key inflation contributors and beneficiaries alike. High dividend yield and shareholder-friendly capital allocation make CJ attractive during inflationary periods where income generation is prioritized.

Section 2: Company Overview
Teck Resources Limited (TSX: TECK.B) is a diversified miner with coal, copper, zinc, and oil sands operations in Canada, the United States, Chile, and Peru. Metallurgical coal is Teck's primary commodity in terms of EBITDA contribution, closely followed by copper, with zinc and oil sands contributing smaller amounts to earnings. Teck ranks as the world's second- largest exporter of seaborne metallurgical coal and is a top three zinc miner. It is building a major new copper mine in Chile at the majority-owned Quebrada Blanca 2, in partnership with Sumitomo, which will increase Teck's attributable copper production by around 80%. Along with a number of additional copper growth options, Teck's strategy is to rebalance its portfolio to low carbon metals such as copper.
Kalkine’s Inflation Report covers the Investment Highlights, Key Financial Metrics, Risks, Technical Analysis along with the Valuation, Target Price, and Recommendation on the stock.
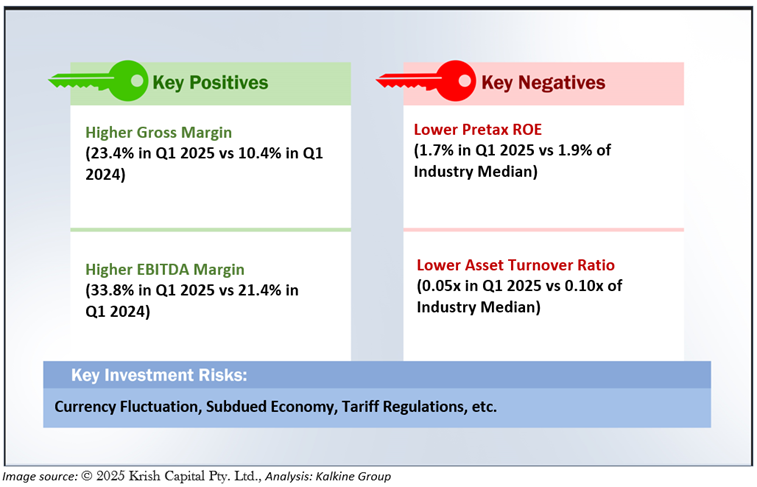
2.1 The Key Positives, Negatives, Investment Highlights, and Risks
Section3: Financial Highlights
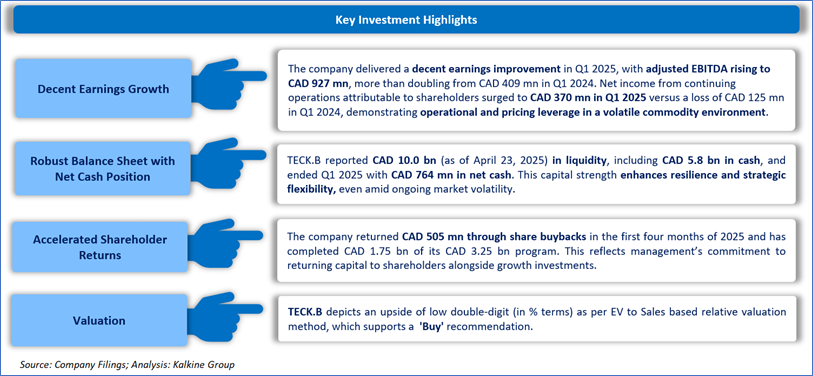
3.1 Key Financial Highlights
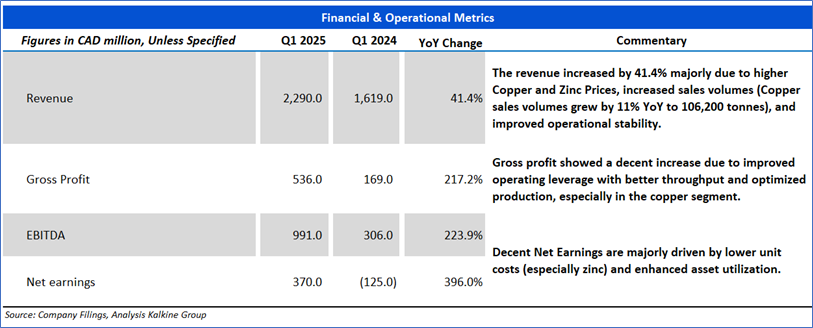
Section 4: Key Metrics
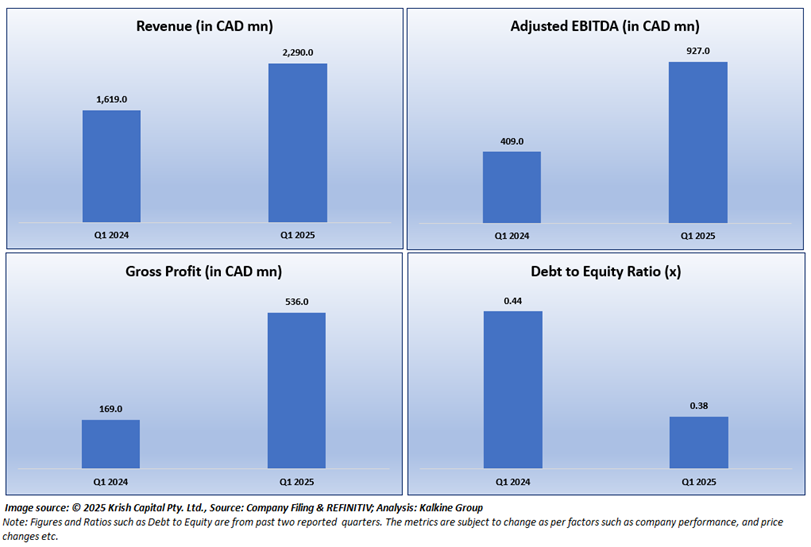
Below chart depicts the change in Revenue, Adjusted EBITDA, Gross Profit and Debt to Equity Ratio of the Company for the last two reported quarters.
Section 5: Stock Recommendation Summary
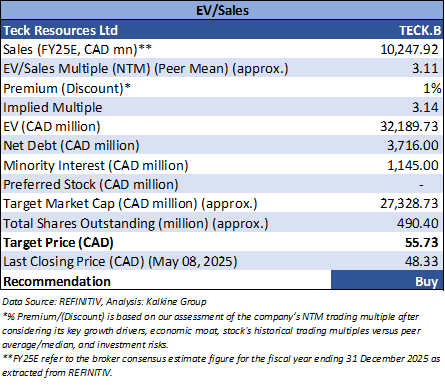
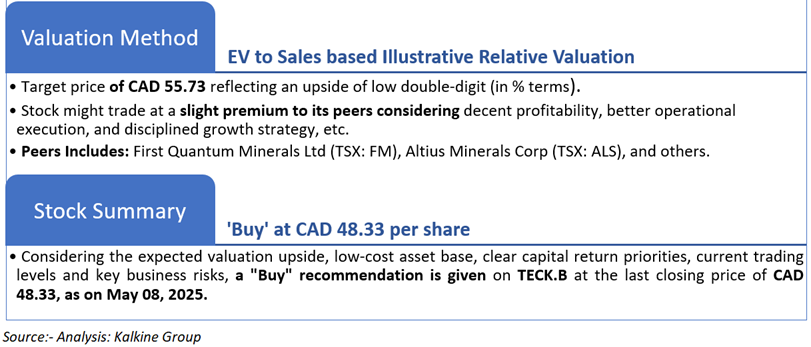
5.1 Valuation Methodology (Illustrative): EV to Sales Based Relative Valuation approach
5.2 Price Performance and Stock Recommendation

The stock has witnessed an upside of ~16.65% in 1 month and ~20.73% over the last 3 months. Moreover, the stock is trading below the average 52-week high price of CAD 74.37 and 52-week low price of CAD 40.23, providing an opportunity to accumulate the stock.
5.3 One-Year Technical Price Chart
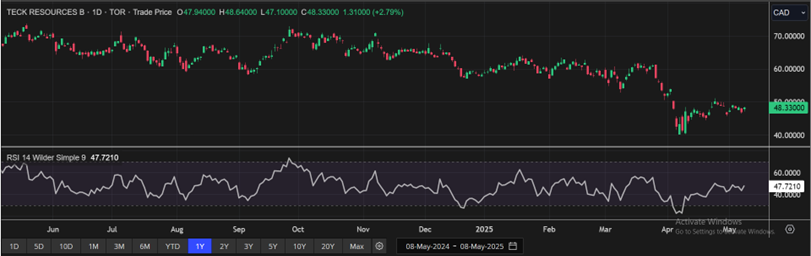
One-Year Technical Price Chart (as of May 08, 2025). Source: REFINITIV, Analysis: Kalkine Group
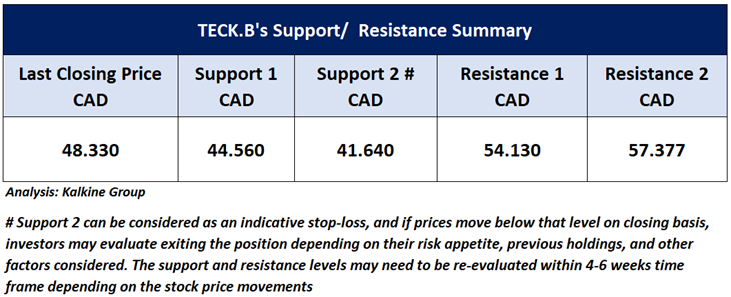
5.4 Technical Summary
Section 2: Company Overview
Cardinal Energy Ltd (TSX: CJ) is an oil-focused Canadian company. The company's principal business activity is the acquisition, exploration, and production of petroleum and natural gas in the provinces of Alberta and Saskatchewan.
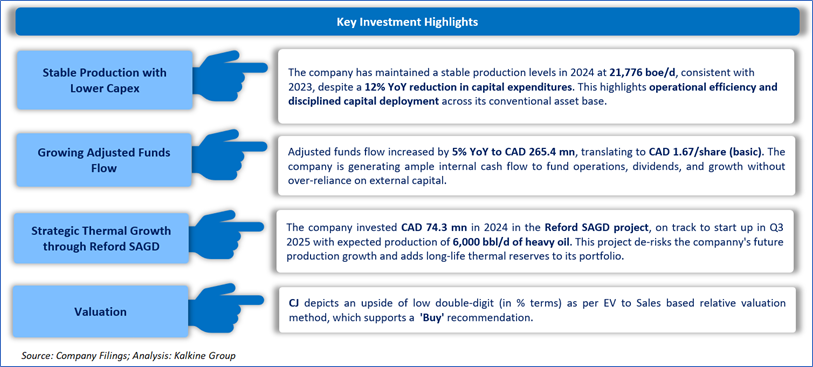
Kalkine’s Inflation Report covers the Investment Highlights, Key Financial Metrics, Risks, Technical Analysis along with the Valuation, Target Price, and Recommendation on the stock.
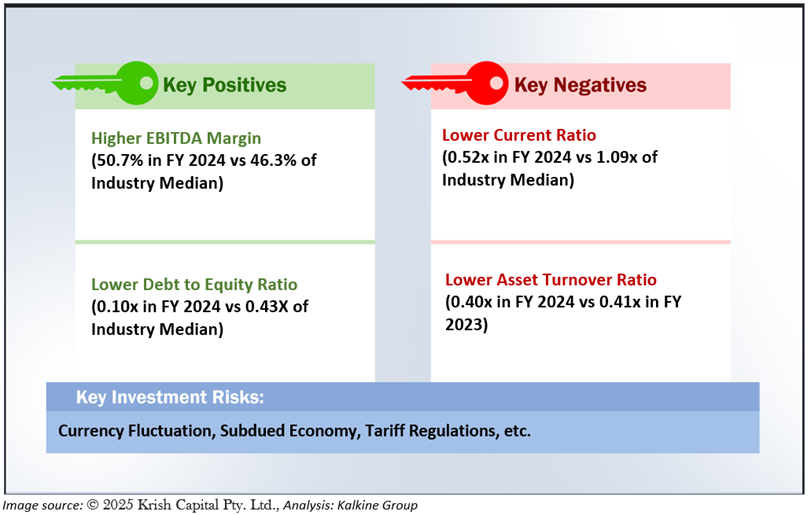
2.2 The Key Positives, Negatives, Investment Highlights, and Risks
Section3: Financial Highlights
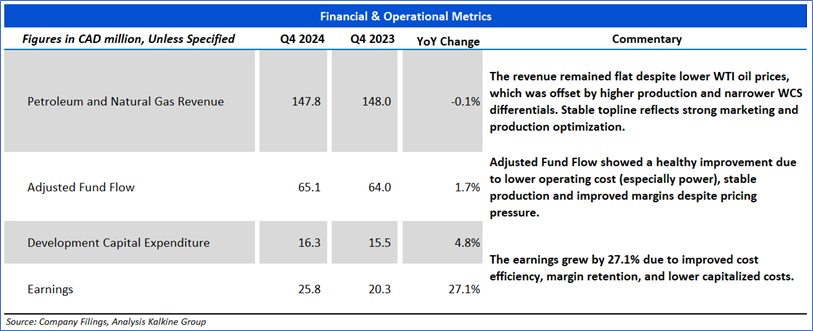
3.1 Key Financial Highlights
Section 4: Key Metrics
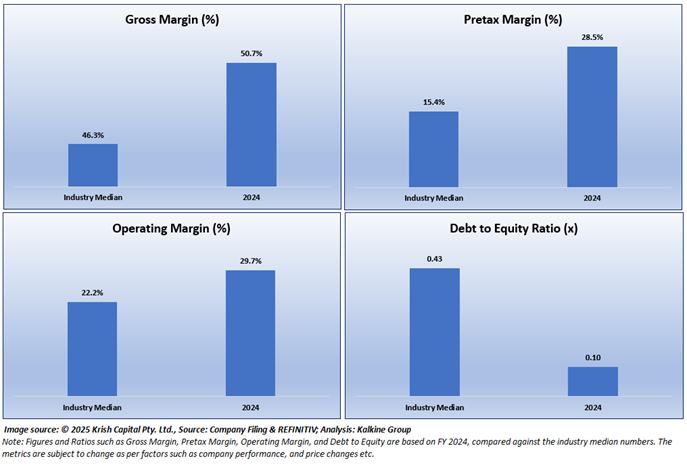
Below chart depicts the change in Gross Margin, Pretax Margin, Operating Margin and Debt to Equity Ratio of the Company for FY 2024 versus the industry median.
Section 5: Stock Recommendation Summary
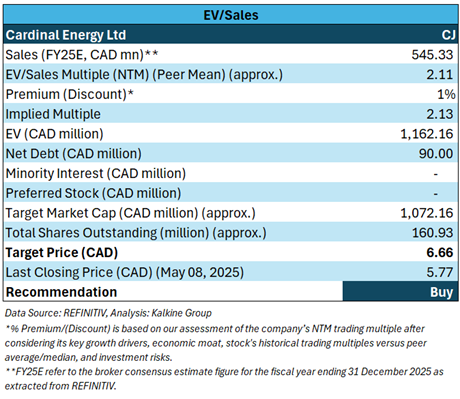
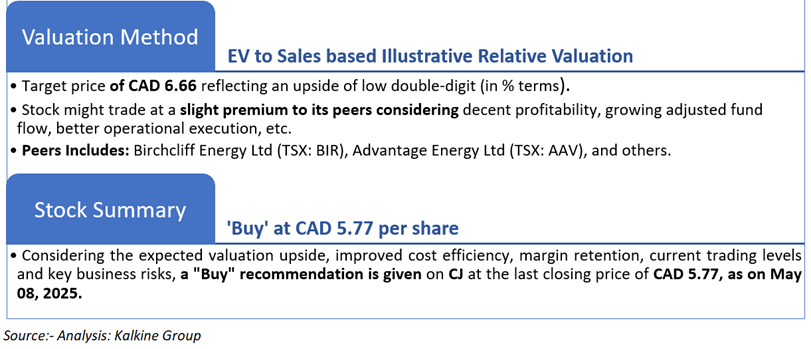
5.1 Valuation Methodology (Illustrative): EV to Sales Based Relative Valuation approach
5.2 Price Performance and Stock Recommendation

The stock has witnessed an upside of ~0.70% in 1 week and a downside of ~8.41% over the last 1 month. Moreover, the stock is trading below the average 52-week high price of CAD 7.19 and 52-week low price of CAD 4.64, providing an opportunity to accumulate the stock.
5.3 One-Year Technical Price Chart
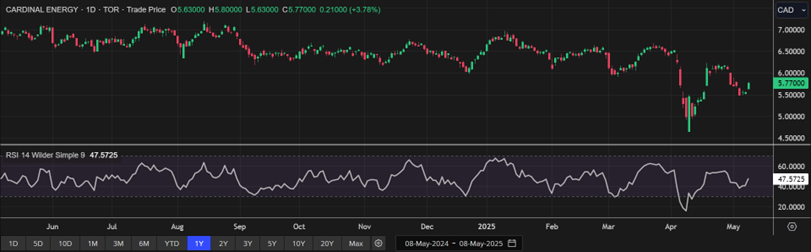
One-Year Technical Price Chart (as of May 08, 2025). Source: REFINITIV, Analysis: Kalkine Group
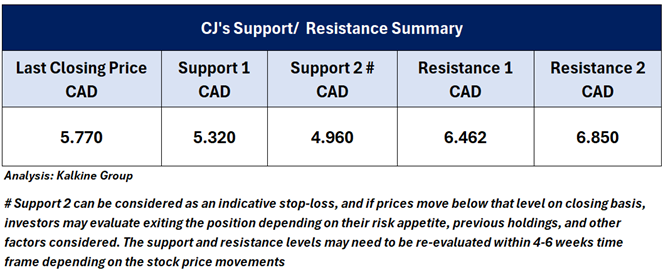
5.4 Technical Summary
Note 1: Past performance is not a reliable indicator of future performance.
Note 2: The reference date for all price data, currency, technical indicators, support, and resistance levels is May 08, 2025. The reference data in this report has been partly sourced from REFINITIV.
Note 3: Investment decisions should be made depending on an individual's appetite for upside potential, risks, holding duration, and any previous holdings. An 'Exit' from the stock can be considered if the Target Price mentioned as per the Valuation and or the technical levels provided has been achieved and is subject to the factors discussed above.
Note 4: Dividend Yield may vary as per the stock price movement.
Note 5: Kalkine reports are prepared based on the stock prices captured either from REFINITIV or Trading View. Typically, REFINITIV or Trading View may reflect stock prices with a delay which could be a lag of 25-30 minutes. There can be no assurance that future results or events will be consistent with the information provided in the report. The information is subject to change without any prior notice.
Technical Indicators Defined: -
Support: A level at which the stock prices tend to find support if they are falling, and a downtrend may take a pause backed by demand or buying interest.
Resistance: A level at which the stock prices tend to find resistance when they are rising, and the uptrend may take a pause due to profit booking or selling interest.
Stop-loss: In general, it is a level to protect further losses in case of any unfavourable movement in the stock prices.
Past performance is not a reliable indicator of future performance.

 Please wait processing your request...