Section 1: Introduction
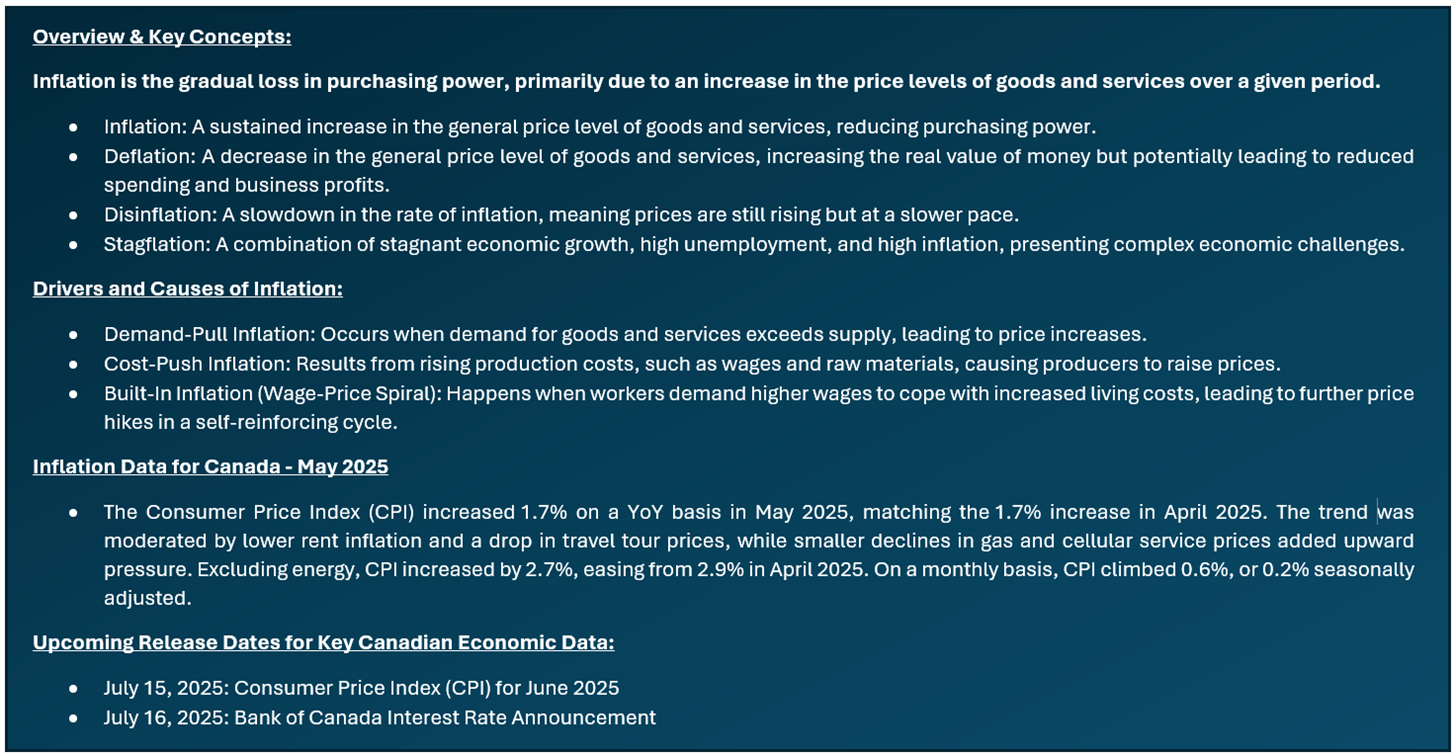
Inflation Report Coverage:
- Inflation report highlights how inflation impacts sectors differently, favoring value and defensive sectors like Energy, Materials, Consumer Staples, Healthcare, Utilities, select Financials, and REITs with inflation-indexed leases, while rate-sensitive sectors like Consumer Discretionary and high-growth Tech typically underperform.
- The report focuses on companies with proven business models, steady financials, high free cash flow, and solid ROE that can pass on costs to customers and protect margins. The aim is to identify stocks that can outperform inflation via capital gains and dividends, supporting diversified sectoral exposure.
Stocks Covered:
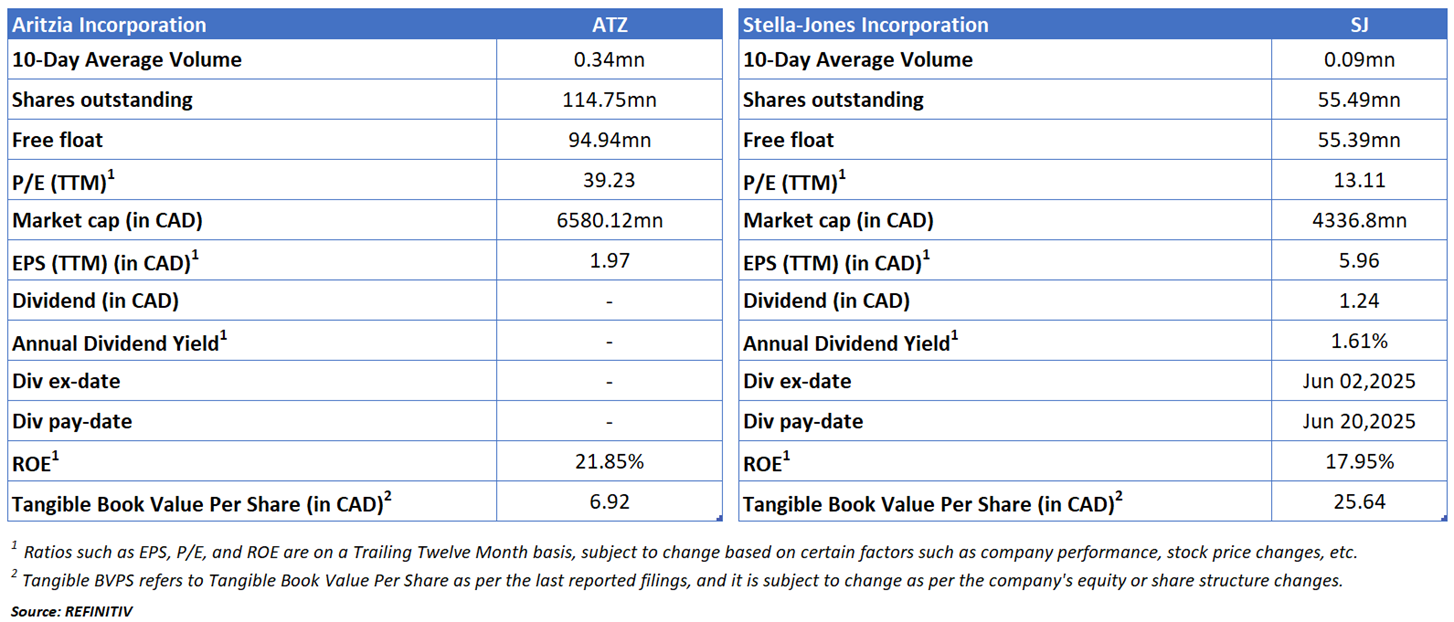
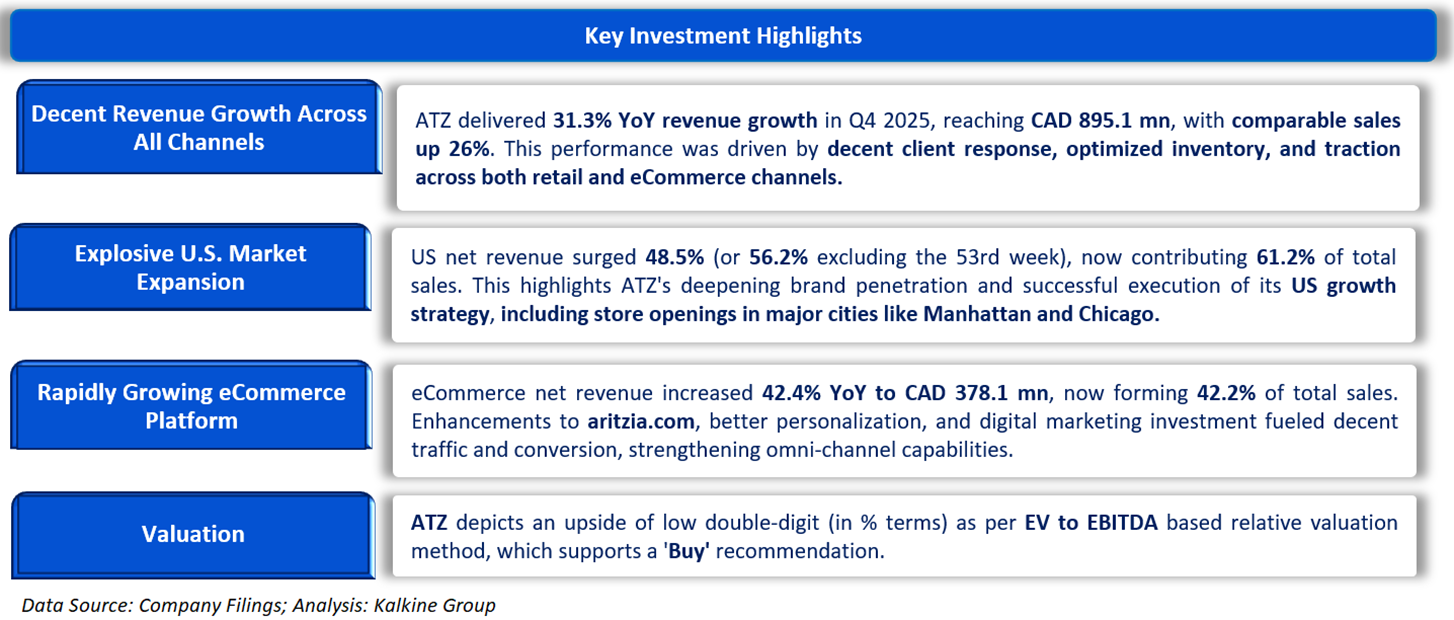
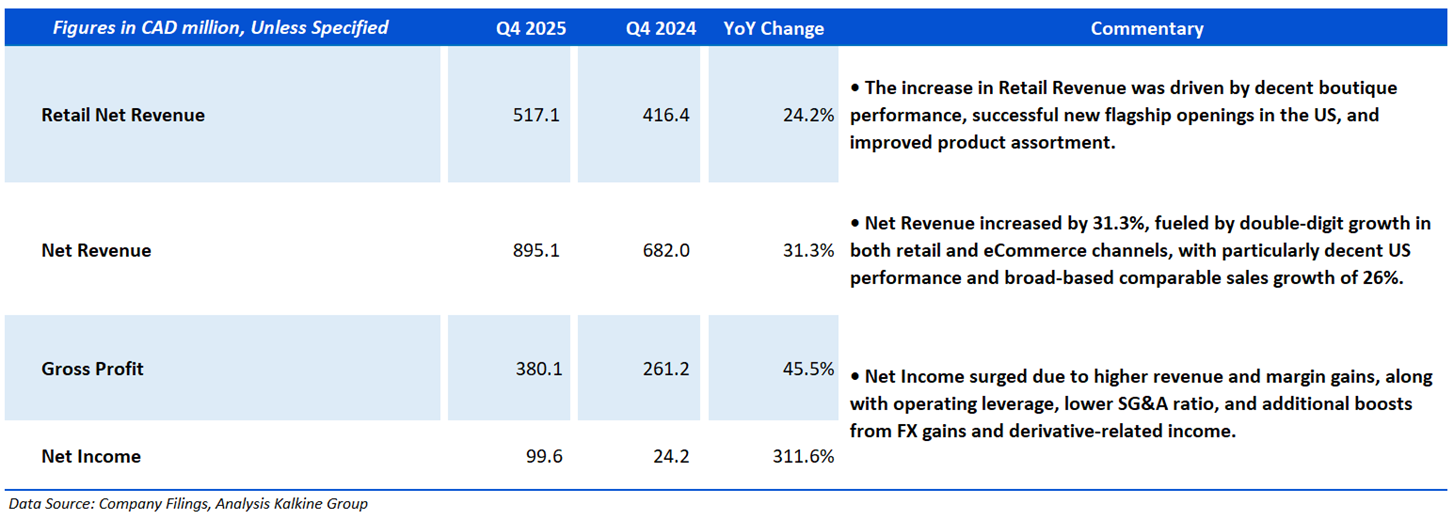
- Aritzia Incorporation (TSX: ATZ) is well-positioned in an inflationary environment due to its premium Everyday Luxury positioning, pricing power, and decent brand loyalty. Its ability to maintain full-price sell-through, optimize inventory, and drive efficiency through smart spending supports margin resilience. Continued growth in the U.S., a robust eCommerce platform, and strategic flagship expansions further enhance earnings stability and cash flow strength despite rising costs.
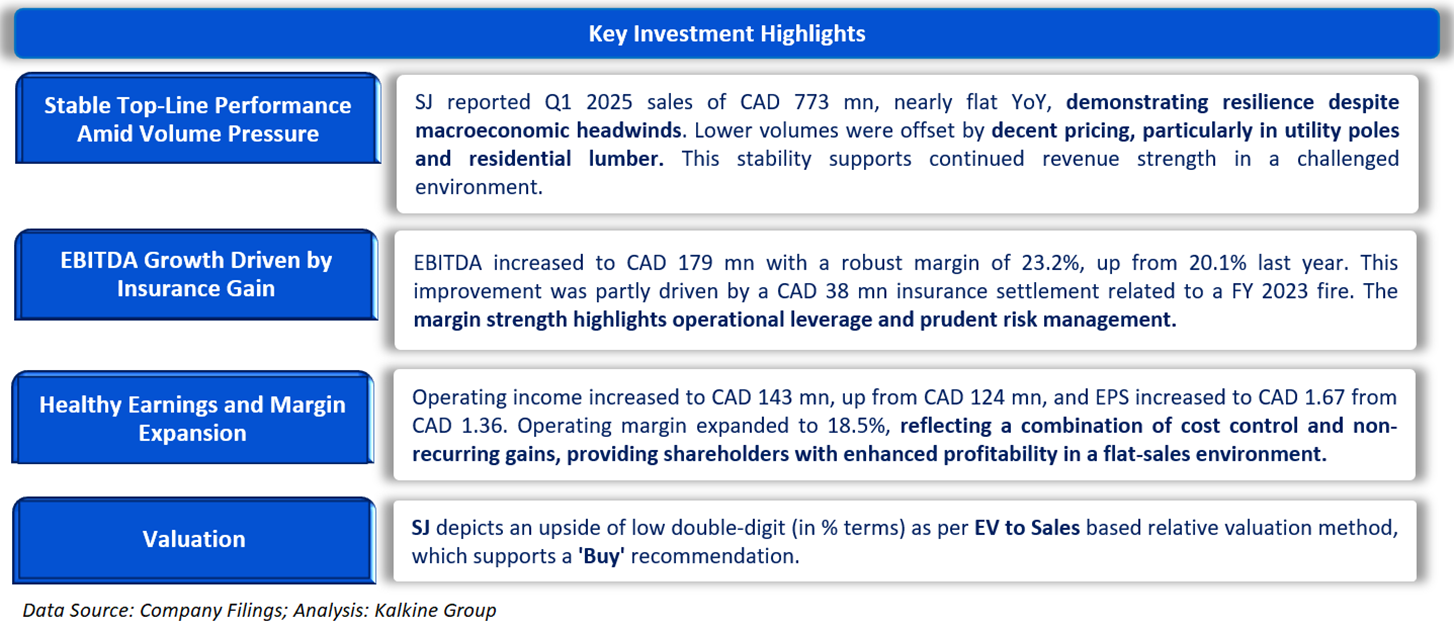
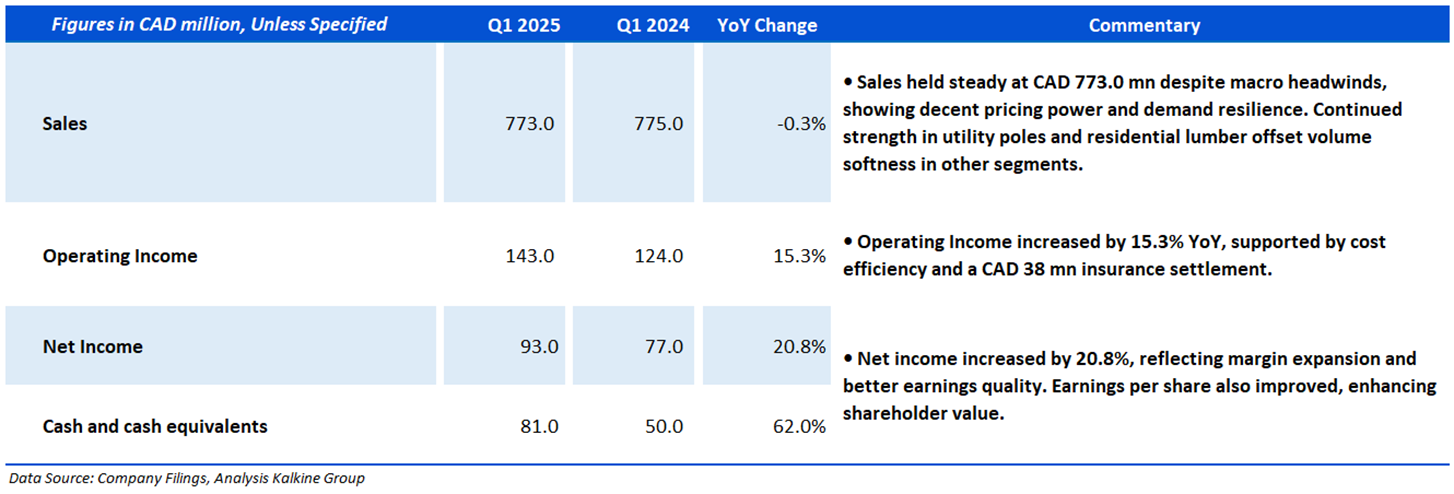
- Stella-Jones Incorporation (TSX: SJ) is well-positioned for inflationary environments due to its essential infrastructure products, pricing flexibility, and long-term customer contracts. Its ability to pass on cost increases, maintain strong demand in regulated markets, and focus on operational efficiency supports margin stability. The recent Locweld acquisition also strengthens its infrastructure exposure, enhancing resilience and cash flow during inflation.
Section 2: Company Overview
Aritzia Incorporation (TSX: ATZ) is an integrated design house of exclusive fashion brands. It designs apparel and accessories for its collection of exclusive brands and sells them under the Aritzia banner. The category of products offered by the firm is blouses, T-shirts, pants, dresses, sweaters, jackets and coats, skirts, shorts, jumpsuits, and accessories. Its geographical segments include Canada and the United States. The company generates the majority of revenue from Retail, followed by eCommerce.
Kalkine’s Inflation Report covers the Investment Highlights, Key Financial Metrics, Risks, Technical Analysis along with the Valuation, Target Price, and Recommendation on the stock.

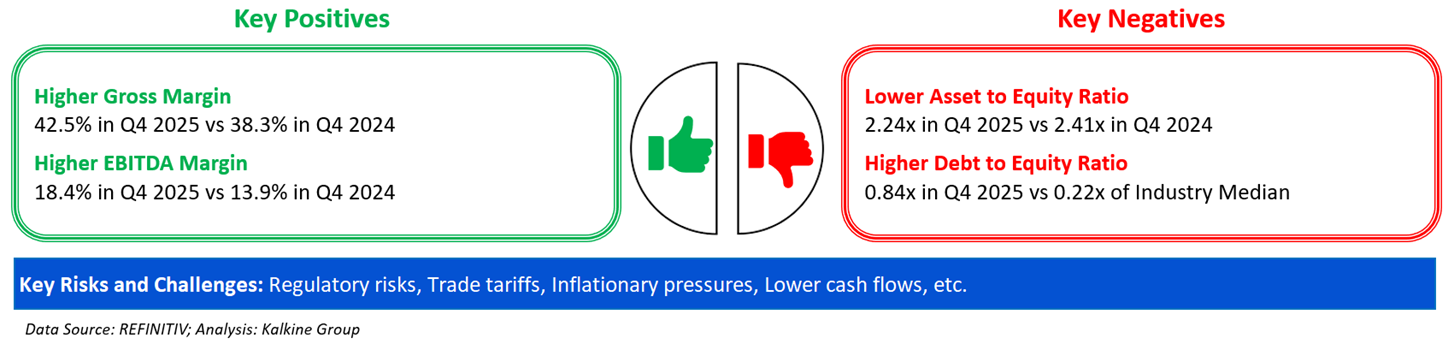
Section3: Financial Highlights

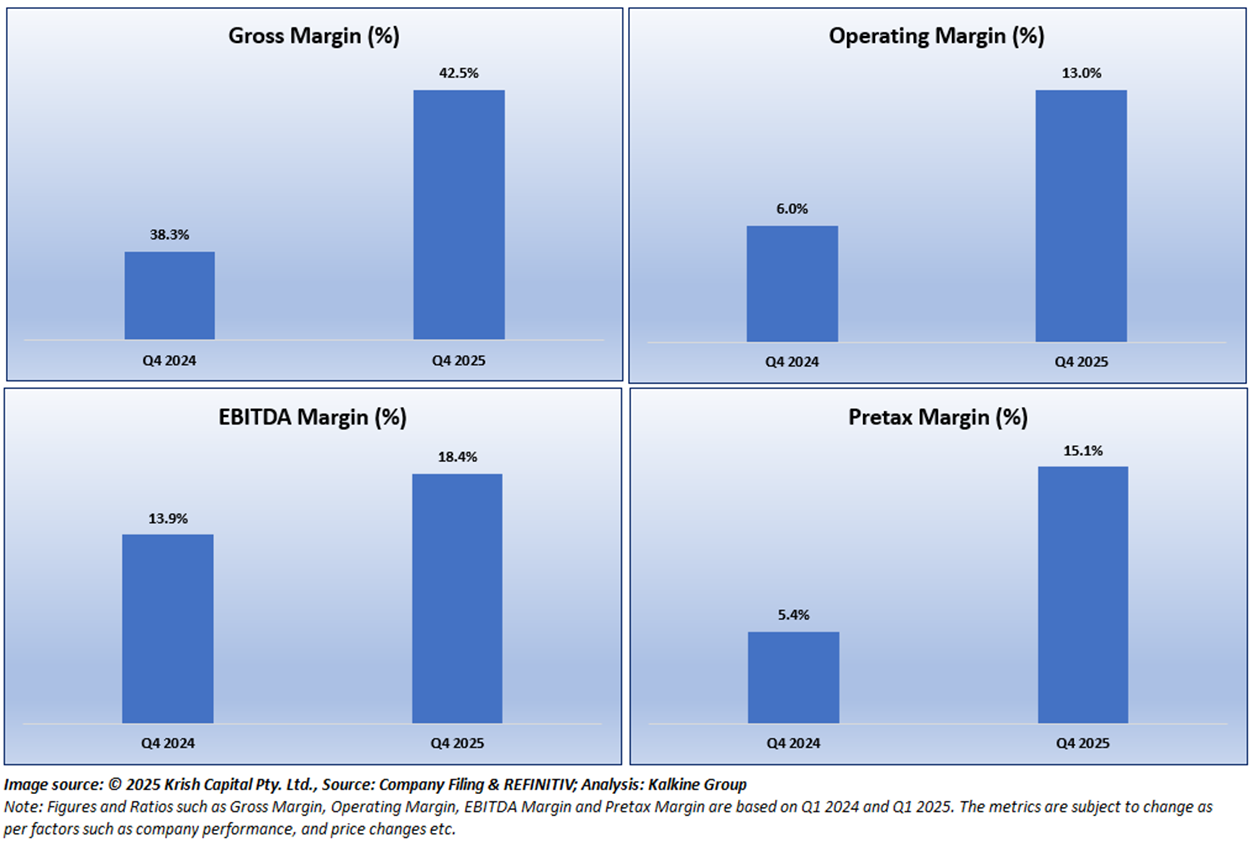
Section 4: Key Metrics
Below chart depicts the change in Gross Margin, Operating Margin, EBITDA Margin and Pretax Margin of the Company for Q4 2025 and Q4 2024.
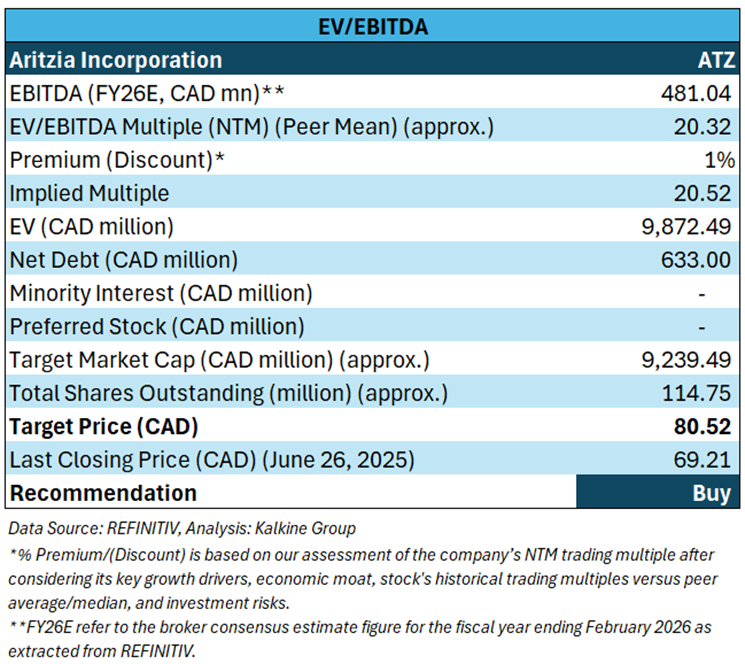
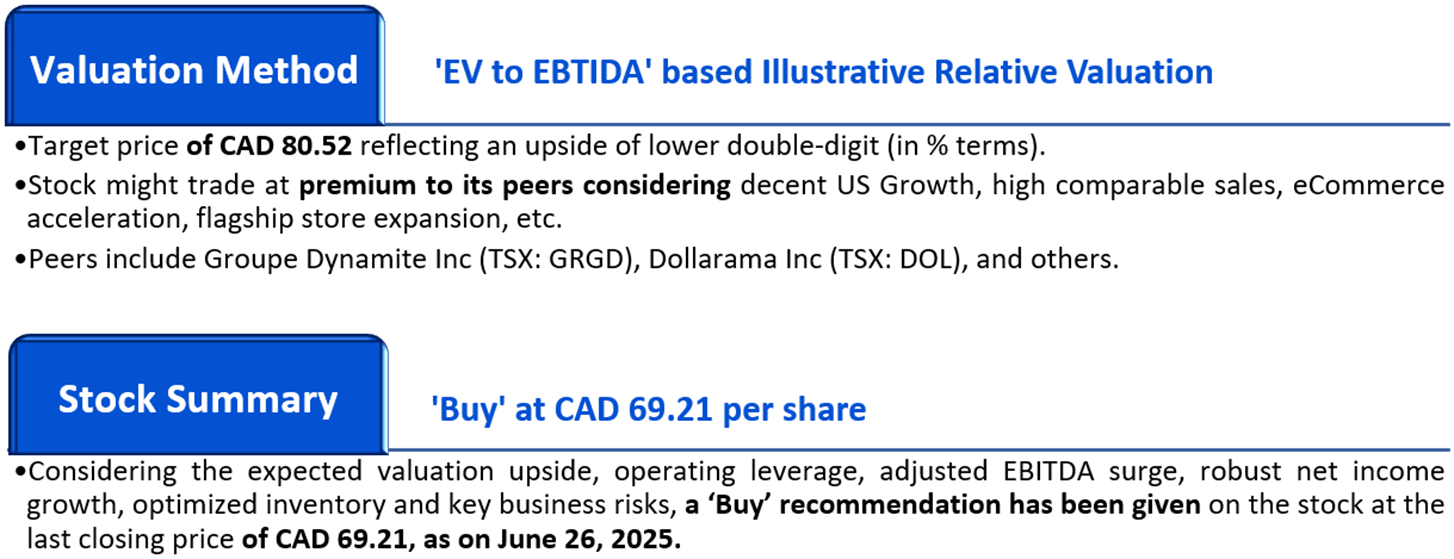
Section 5: Stock Recommendation Summary

Valuation Methodology: EV to EBITDA Based Relative Valuation (Illustrative):


The stock has witnessed an upside of ~4.48% and ~30.41% over the last 1 week and 3 months respectively. Moreover, it is trading above the average 52-week high price of CAD 73.44 and 52-week low price of CAD 36.51, providing an opportunity to ride the trend.

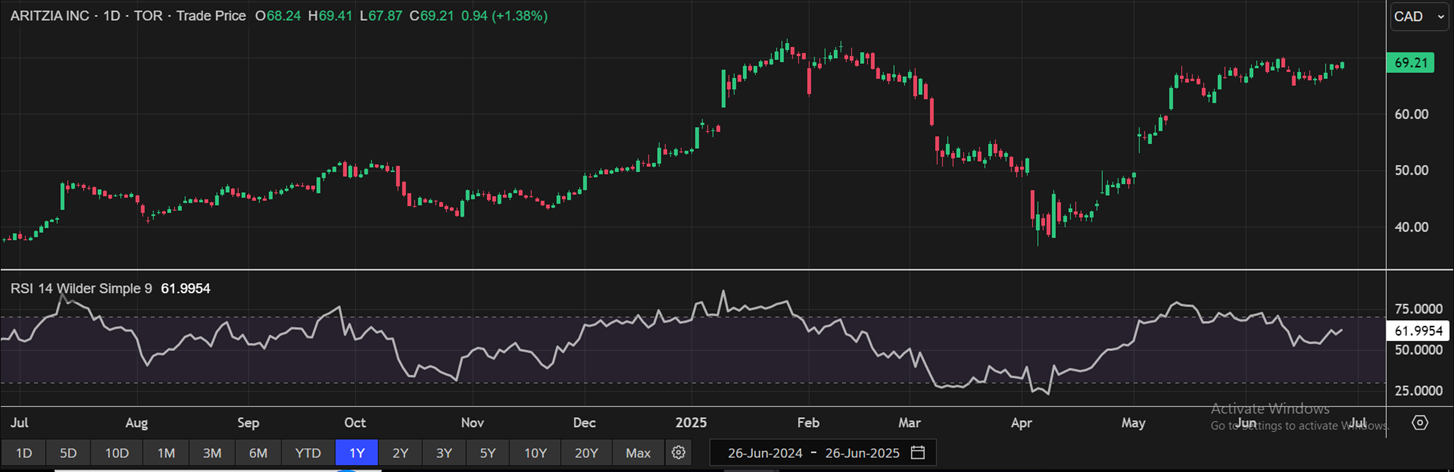
One-Year Technical Price Chart (as of June 26, 2025). Source: REFINITIV, Analysis: Kalkine Group

Section 2: Company Overview
Stella-Jones Incorporation (TSX: SJ) produces and sells lumber and wood products. The company operates in two segments: Pressure-treated wood, which includes utility poles, railway ties, residential lumber, and industrial products; and Logs & Lumber segment comprises of the sales of logs harvested in the course of the company's procurement process that is determined to be unsuitable for use as utility poles, it also includes the sale of excess lumber to local home-building markets. The vast majority of its revenue comes from the Pressure-treated wood segment. Its geographical segments are the United States and Canada, of which the majority of its revenue is derived from the United States.
Kalkine’s Inflation Report covers the Investment Highlights, Key Financial Metrics, Risks, Technical Analysis along with the Valuation, Target Price, and Recommendation on the stock.

Section3: Financial Highlights

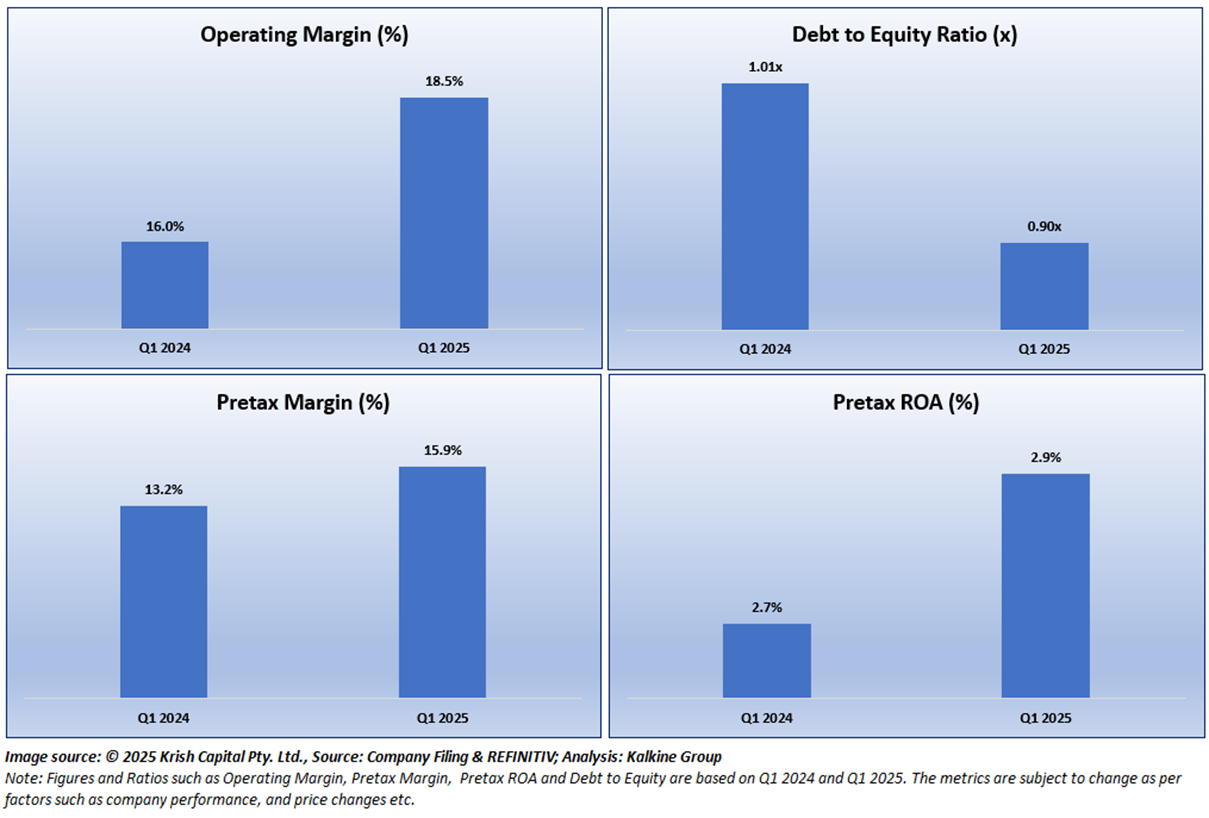
Section 4: Key Metrics
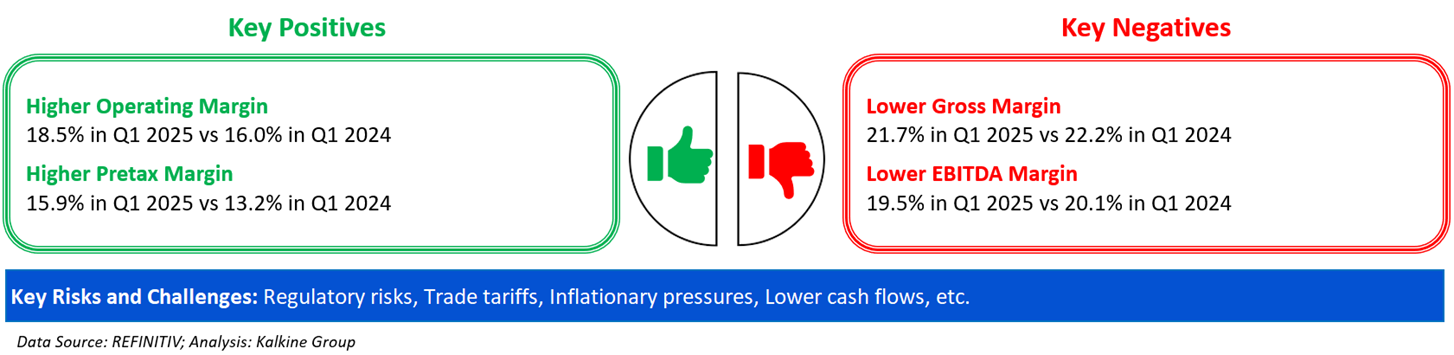
Below chart depicts the change in Operating Margin, Debt to Equity Ratio, Pretax Margin, and Pretax ROA of the Company for Q1 2025 and Q1 2024.
Section 5: Stock Recommendation Summary

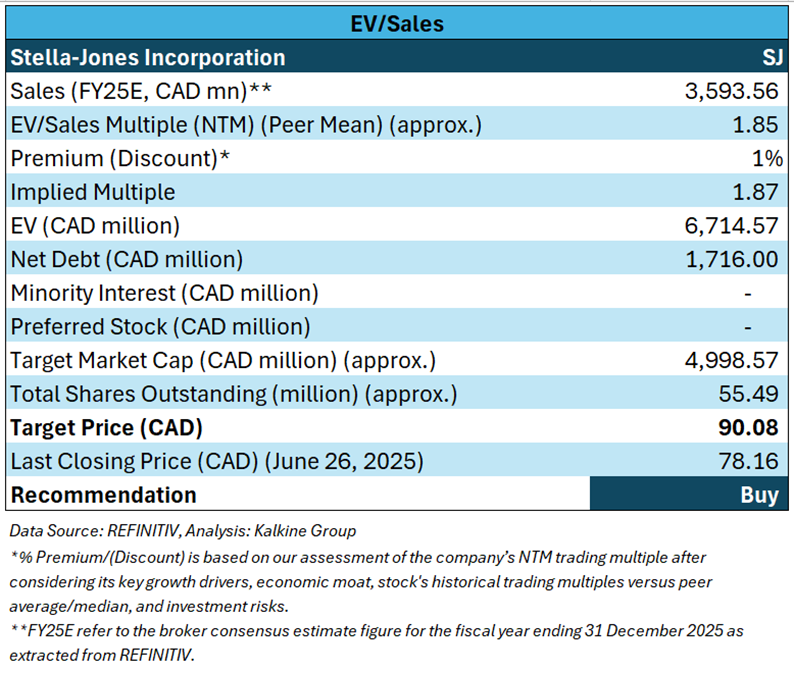
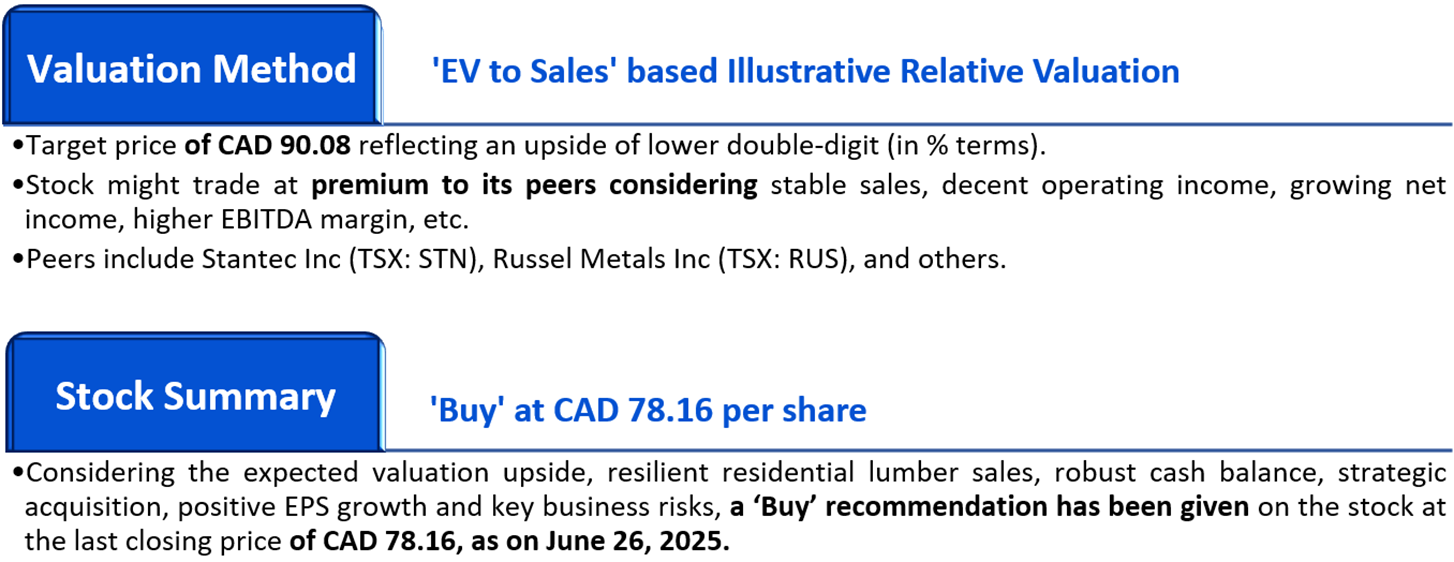
Valuation Methodology: EV to Sales Based Relative Valuation (Illustrative):


The stock has witnessed an upside of ~3.88% and ~14.08% over the last 1 week and 3 months respectively. Moreover, it is trading below the average 52-week high price of CAD 98.00 and 52-week low price of CAD 62.26, providing an opportunity to accumulate the stock.

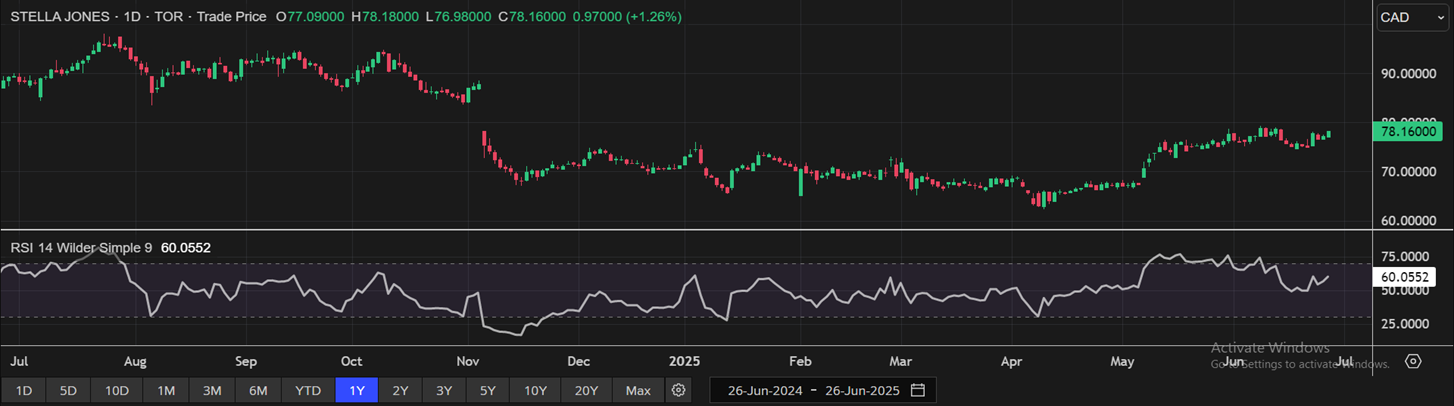
One-Year Technical Price Chart (as of June 26, 2025). Source: REFINITIV, Analysis: Kalkine Group

Note 1: Past performance is not a reliable indicator of future performance.
Note 2: The reference date for all price data, currency, technical indicators, support, and resistance levels is June 26, 2025. The reference data in this report has been partly sourced from REFINITIV.
Note 3: Investment decisions should be made depending on an individual's appetite for upside potential, risks, holding duration, and any previous holdings. An 'Exit' from the stock can be considered if the Target Price mentioned as per the Valuation and or the technical levels provided has been achieved and is subject to the factors discussed above.
Note 4: Dividend Yield may vary as per the stock price movement.
Note 5: Kalkine reports are prepared based on the stock prices captured either from REFINITIV or Trading View. Typically, REFINITIV or Trading View may reflect stock prices with a delay which could be a lag of 25-30 minutes. There can be no assurance that future results or events will be consistent with the information provided in the report. The information is subject to change without any prior notice.
Technical Indicators Defined: -
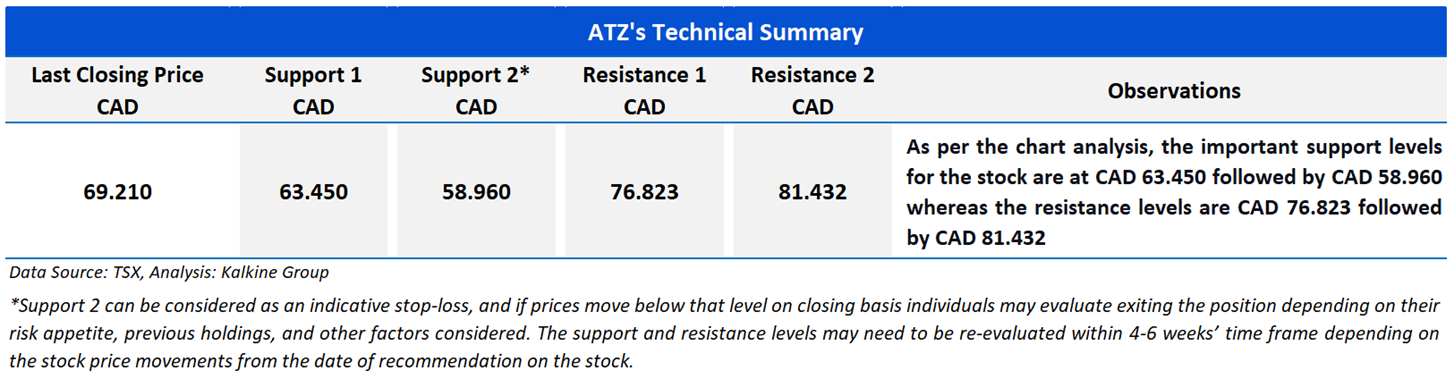
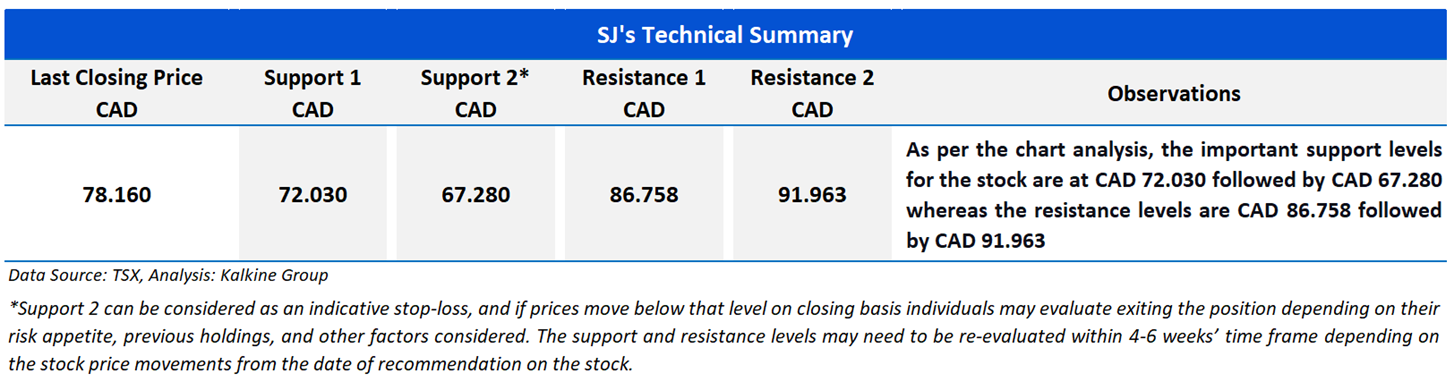
Support: A level at which the stock prices tend to find support if they are falling, and a downtrend may take a pause backed by demand or buying interest.
Resistance: A level at which the stock prices tend to find resistance when they are rising, and the uptrend may take a pause due to profit booking or selling interest.
Stop-loss: In general, it is a level to protect further losses in case of any unfavourable movement in the stock prices.
Past performance is not a reliable indicator of future performance.

 Please wait processing your request...