Section 1: Introduction
Inflation Report Coverage:
- Inflation report highlights how inflation impacts sectors differently, favoring value and defensive sectors like Energy, Materials, Consumer Staples, Healthcare, Utilities, select Financials, and REITs with inflation-indexed leases, while rate-sensitive sectors like Consumer Discretionary and high-growth Tech typically underperform.
- The report focuses on companies with proven business models, steady financials, high free cash flow, and solid ROE that can pass on costs to customers and protect margins. The aim is to identify stocks that can outperform inflation via capital gains and dividends, supporting diversified sectoral exposure.
Stocks Covered:
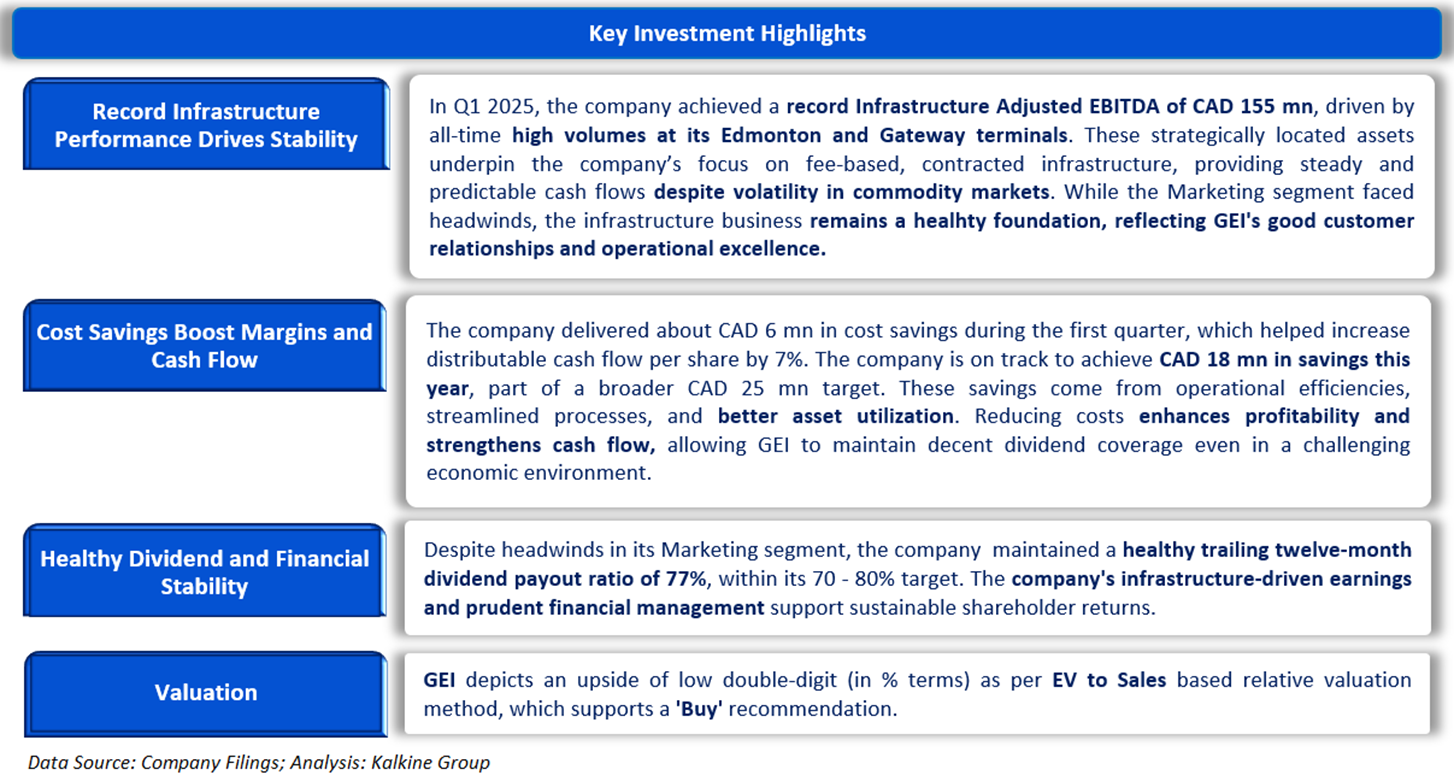
- Gibson Energy Incorporation (TSX: GEI) offers a degree of resilience in an inflationary environment due to its core infrastructure-based business model and long-term take-or-pay contracts. The company generates a significant portion of its earnings from stable, fee-based infrastructure assets such as storage terminals and pipeline-connected facilities, which are less sensitive to commodity price volatility and more insulated from inflation-driven cost pressures. These contracted cash flows, often indexed to inflation, help protect margins. Additionally, GEI’s strategic investments in infrastructure expansion position it to capture rising volumes and demand, while recent cost-saving initiatives and operational efficiencies support its ability to maintain decent distributable cash flow despite broader macro pressures. This makes GEI a potentially defensive pick during inflationary periods.
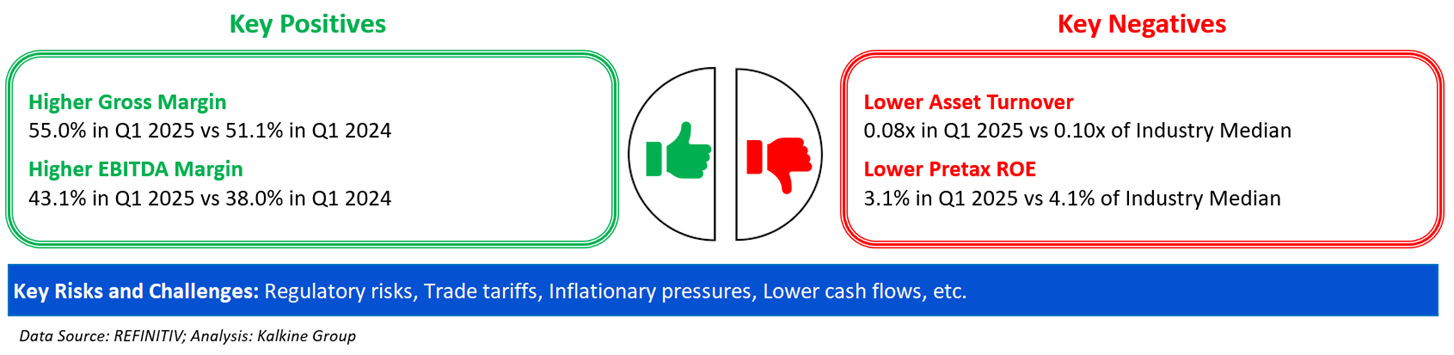
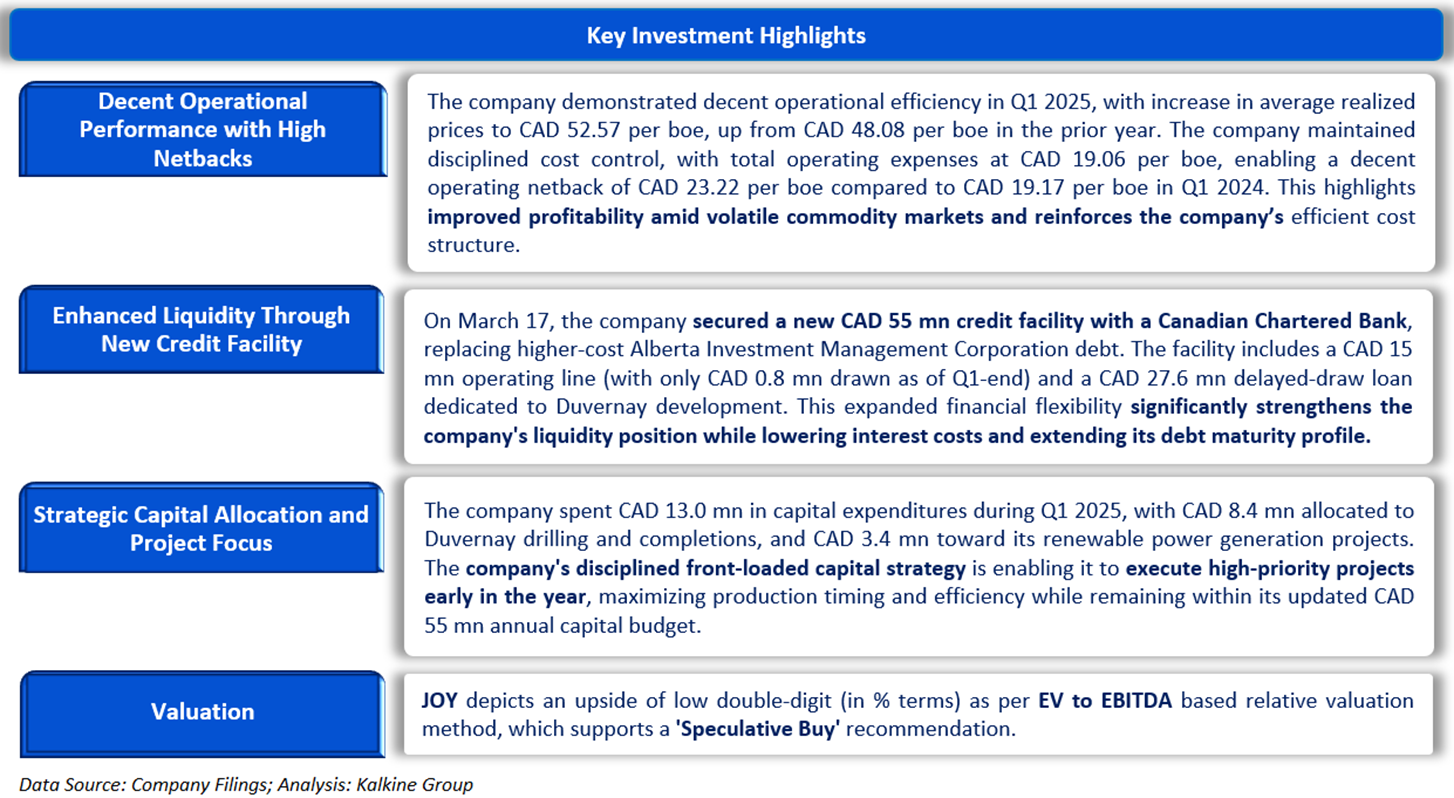
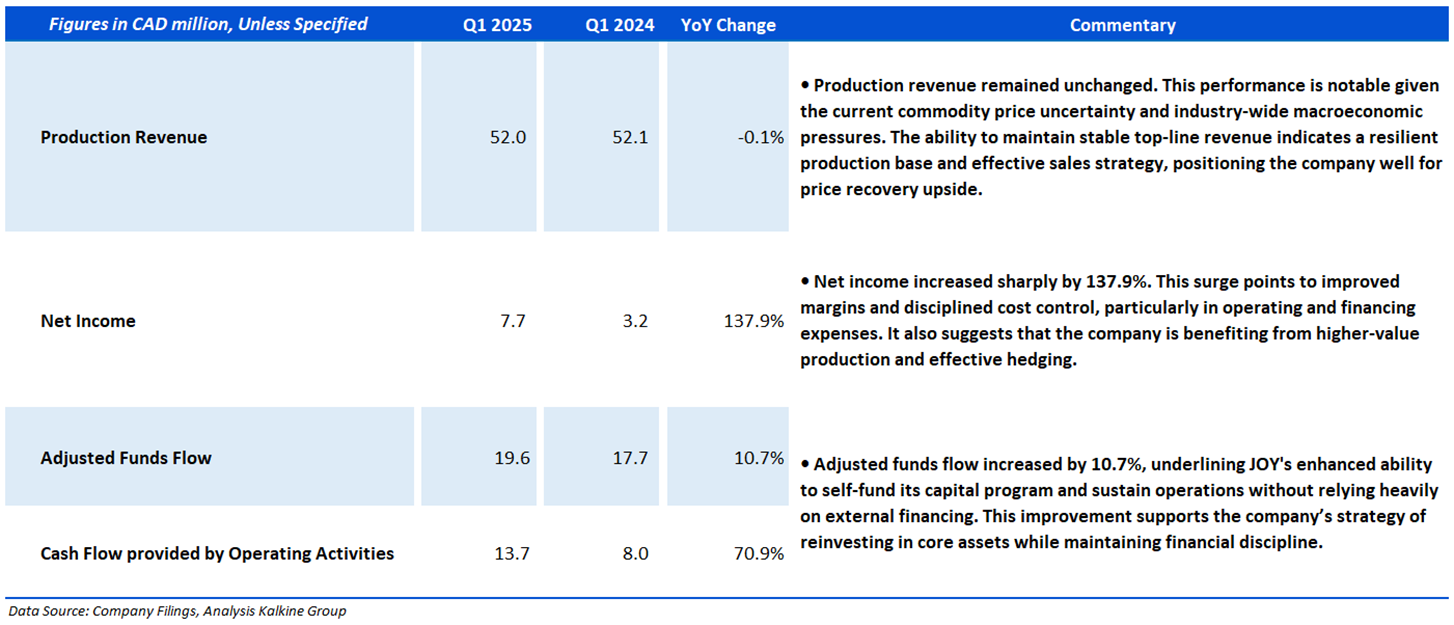
- Journey Energy Incorporation (TSX: JOY) is strategically positioned in the Oil & Gas sector, which tends to outperform during inflationary periods due to the direct pass-through of rising energy prices to consumers. As inflation lifts the price of crude oil and natural gas, Journey benefits through improved realized pricing and stronger netbacks. In Q1 2025, the company delivered a CAD 23.22 per boe operating netback, highlighting robust margin capture amid commodity volatility. With a flexible capital program, self-funded growth, and reduced net debt (-12% QoQ), JOY is well equipped to weather inflation-driven cost pressures while maintaining cash flow discipline and upside exposure to energy price inflation.
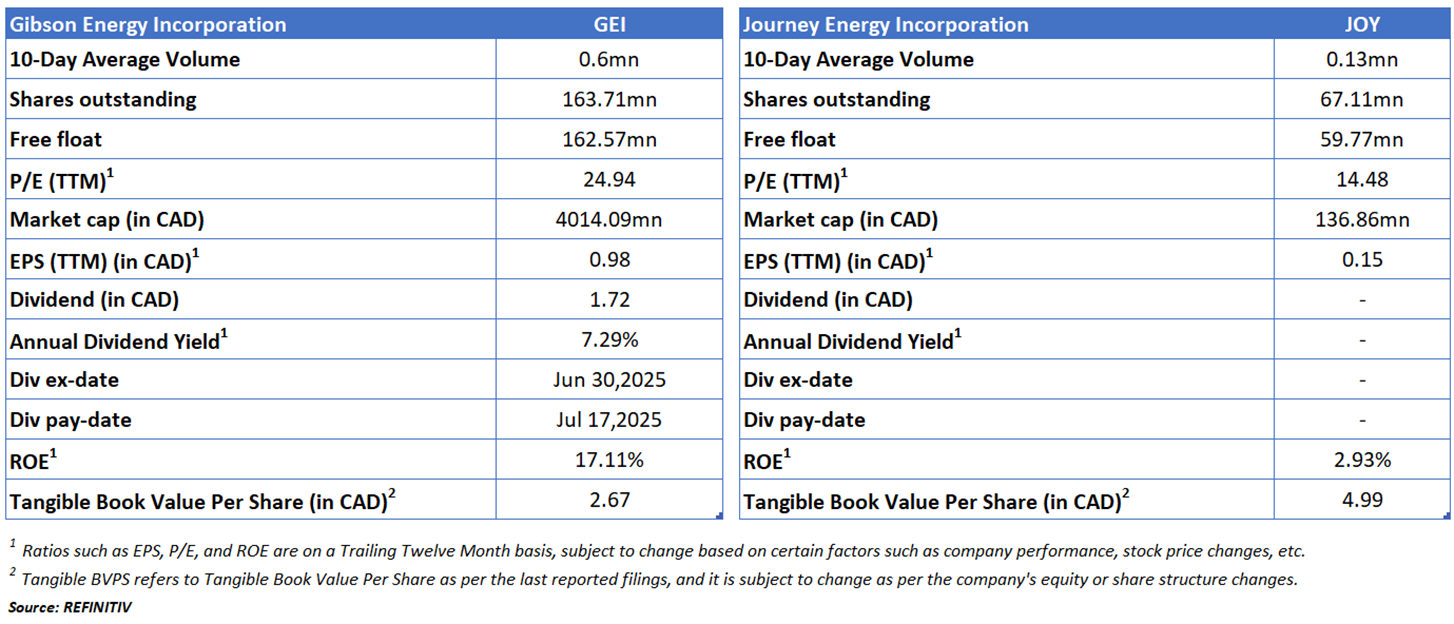
Section 2: Company Overview
Gibson Energy Incorporation (TSX: GEI) is an oil infrastructure company that collects, stores, and processes crude oil and refined products. Reportable segments include marketing, which deals with buying, selling, and optimizing products such as crude oil, natural gas liquid, road asphalt, and oil-based mud product; and infrastructure, which makes up a system of oil terminals, rail loading facilities, pipelines, and an oil processing facility. Gibson Energy Inc. services Canada and the United States, and the majority of revenue comes from the marketing segment.
Kalkine’s Inflation Report covers the Investment Highlights, Key Financial Metrics, Risks, Technical Analysis along with the Valuation, Target Price, and Recommendation on the stock.

Section3: Financial Highlights

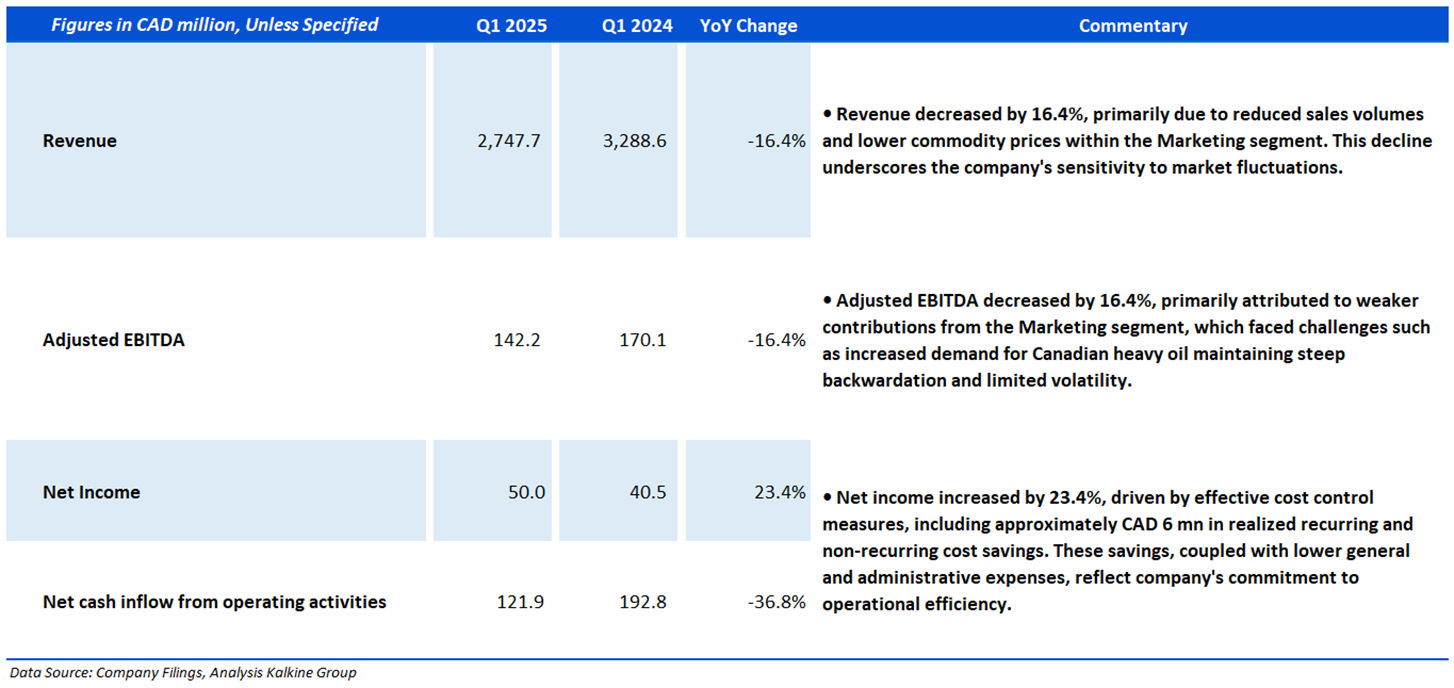
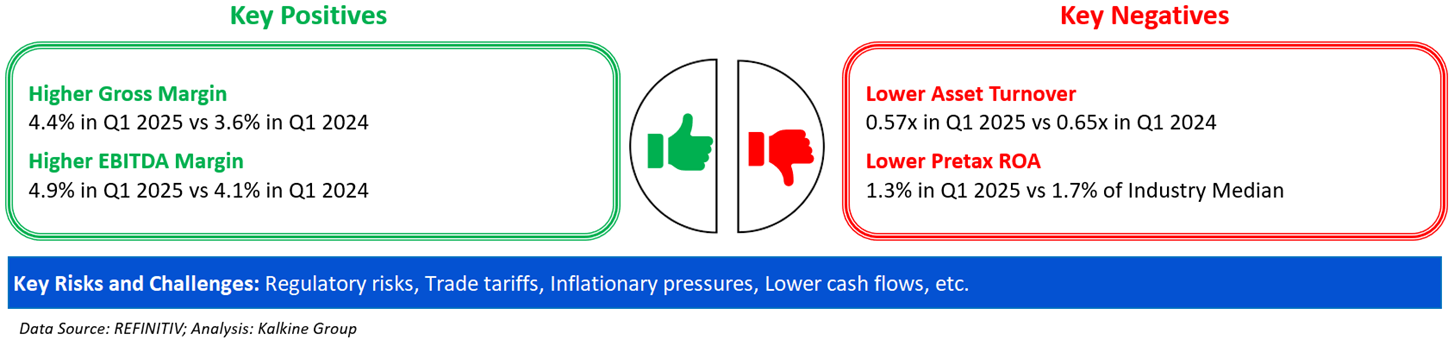
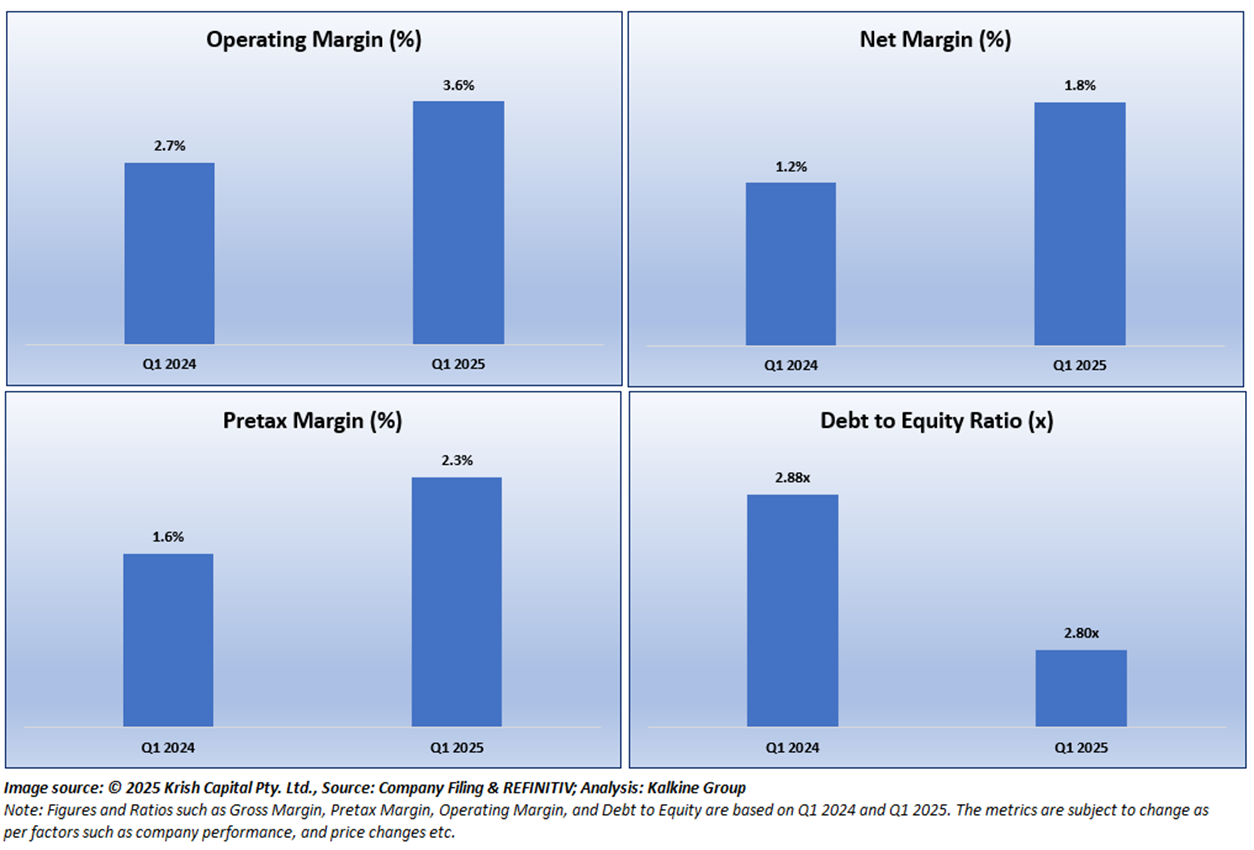
Section 4: Key Metrics
Below chart depicts the change in Operating Margin, Net Margin, Pretax Margin and Debt to Equity Ratio of the Company for Q1 2025 and Q1 2024.
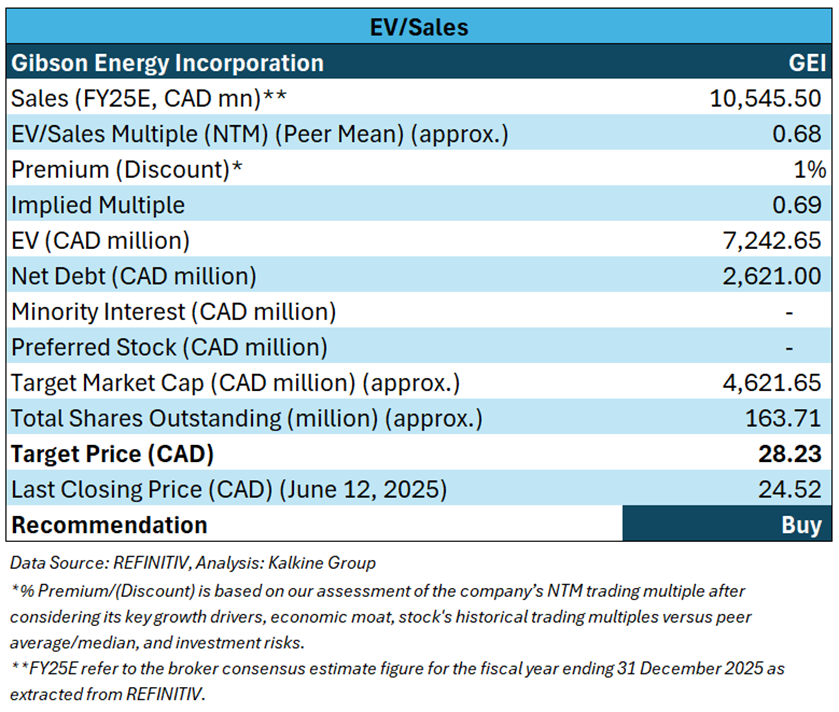
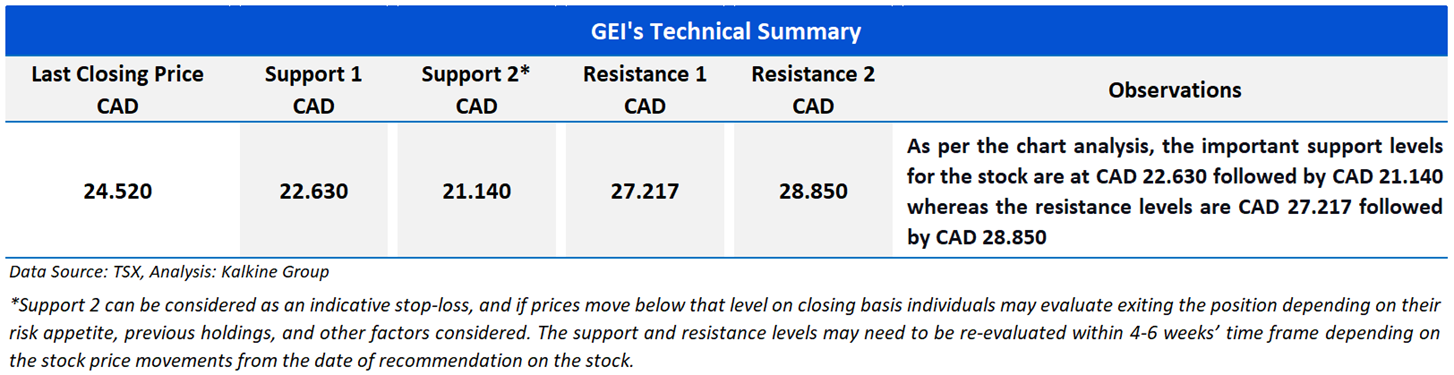
Section 5: Stock Recommendation Summary

Valuation Methodology: EV to Sales Based Relative Valuation (Illustrative):


The stock has witnessed an upside of ~4.78% and ~13.51% over the last 1 week and 3 months respectively. Moreover, it is trading above the average 52-week high price of CAD 26.10 and 52-week low price of CAD 19.63, providing an opportunity to ride the trend.

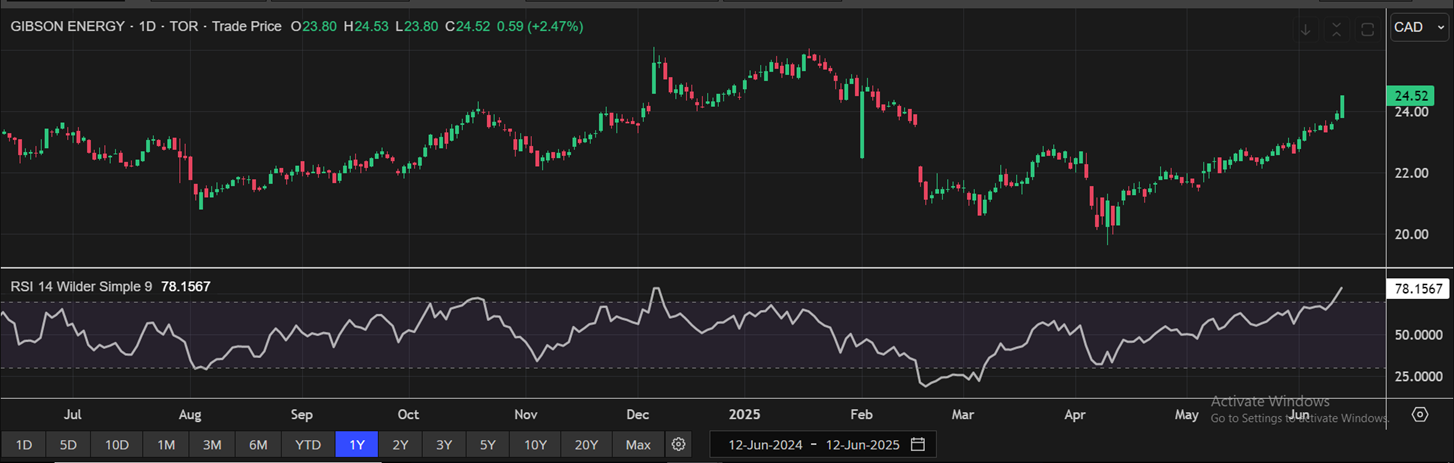
One-Year Technical Price Chart (as of June 12, 2025). Source: REFINITIV, Analysis: Kalkine Group

Section 2: Company Overview
Journey Energy Incorporation (TSX: JOY) is engaged in the exploration, development, and production of crude oil and natural gas in Alberta province. The company's principal revenue source is from petroleum and natural gas sales which include the sale of crude oil, natural gas and natural gas liquids, of which it derives key revenue from the sale of crude oil.
Kalkine’s Inflation Report covers the Investment Highlights, Key Financial Metrics, Risks, Technical Analysis along with the Valuation, Target Price, and Recommendation on the stock.

Section3: Financial Highlights

Section 4: Key Metrics
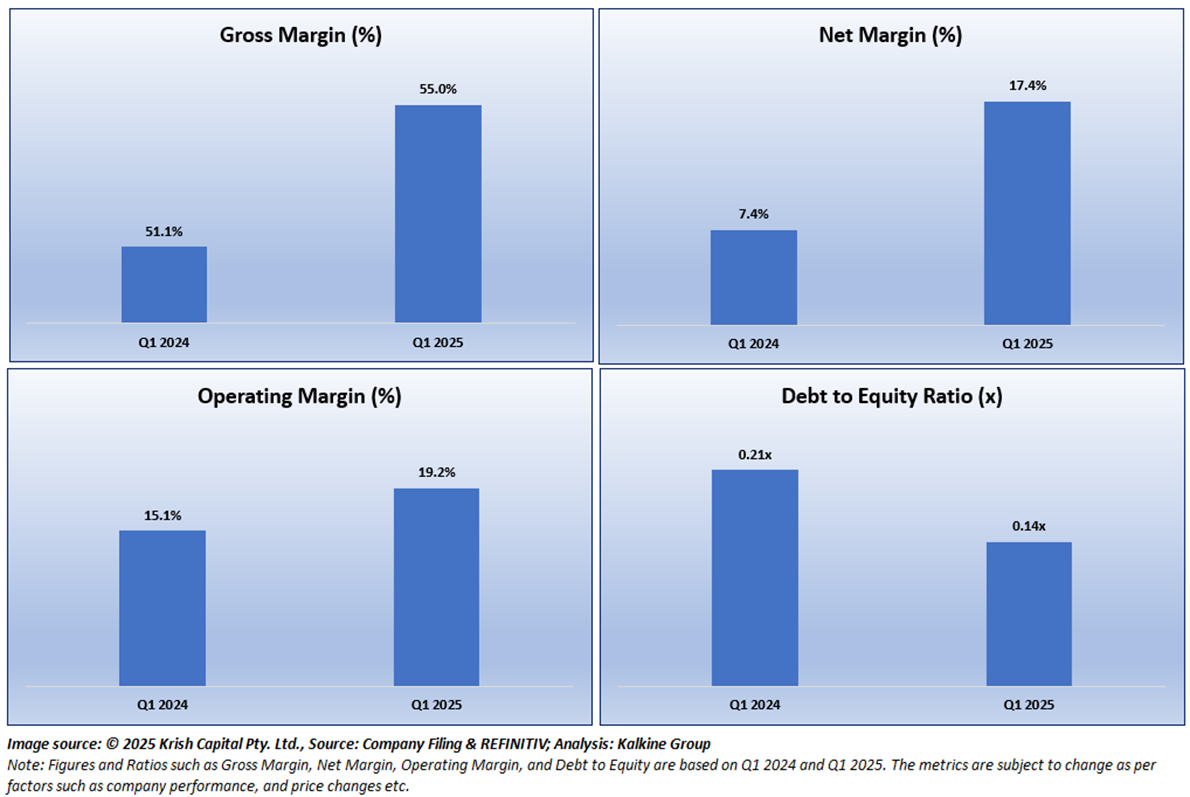
Below chart depicts the change in Gross Margin, Net Margin, Operating Margin and Debt to Equity Ratio of the Company for Q1 2025 and Q1 2024.
Section 5: Stock Recommendation Summary

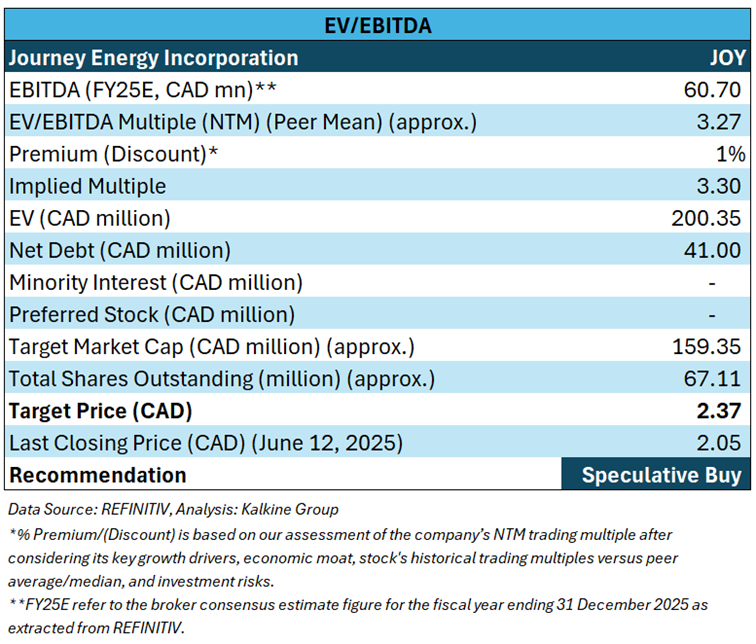
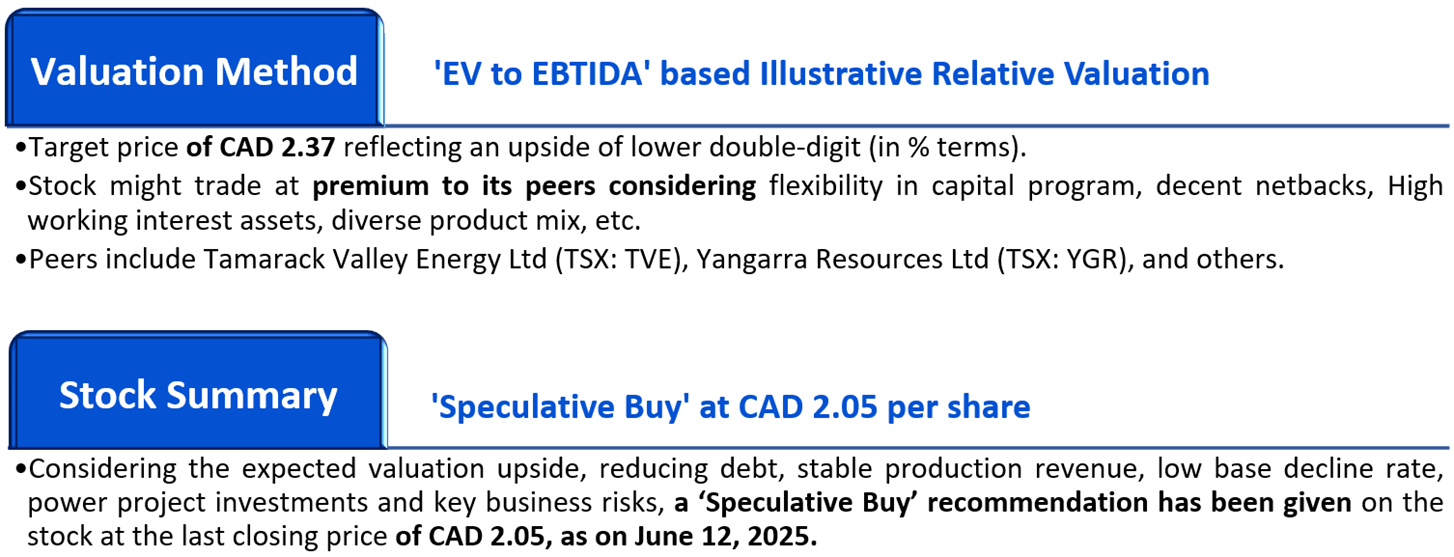
Valuation Methodology: EV to EBITDA Based Relative Valuation (Illustrative):


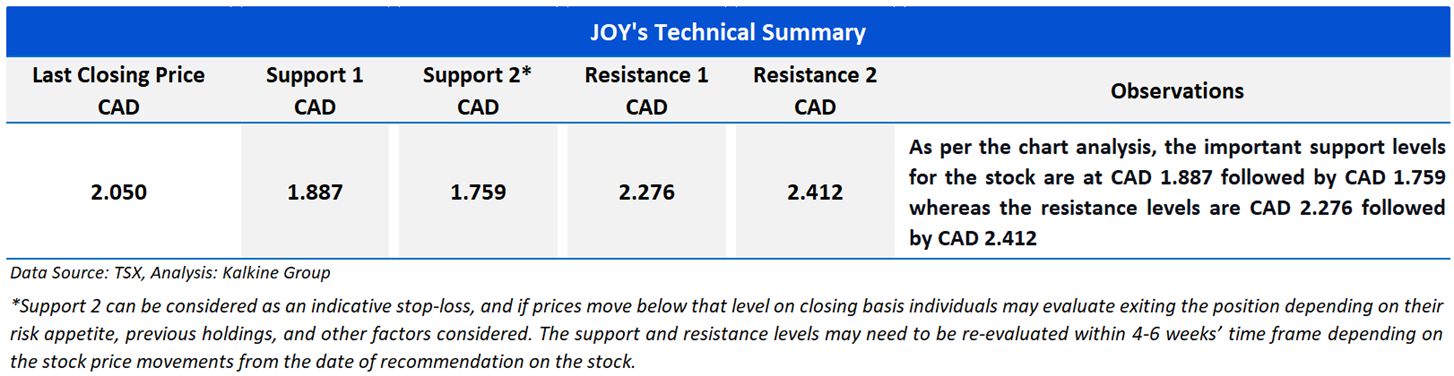
The stock has witnessed an upside of ~13.88% and ~34.86% over the last 1 week and 3 months respectively. Moreover, it is trading below the average 52-week high price of CAD 3.32 and 52-week low price of CAD 1.26, providing an opportunity to accumulate the stock.

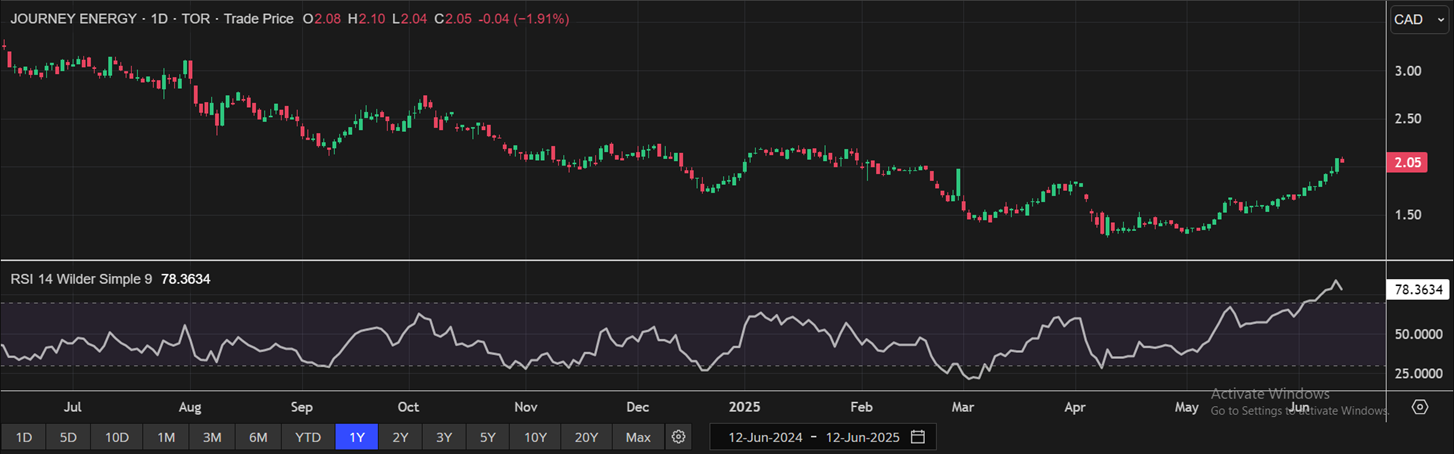
One-Year Technical Price Chart (as of June 12, 2025). Source: REFINITIV, Analysis: Kalkine Group

Note 1: Past performance is not a reliable indicator of future performance.
Note 2: The reference date for all price data, currency, technical indicators, support, and resistance levels is June 12, 2025. The reference data in this report has been partly sourced from REFINITIV.
Note 3: Investment decisions should be made depending on an individual's appetite for upside potential, risks, holding duration, and any previous holdings. An 'Exit' from the stock can be considered if the Target Price mentioned as per the Valuation and or the technical levels provided has been achieved and is subject to the factors discussed above.
Note 4: Dividend Yield may vary as per the stock price movement.
Note 5: Kalkine reports are prepared based on the stock prices captured either from REFINITIV or Trading View. Typically, REFINITIV or Trading View may reflect stock prices with a delay which could be a lag of 25-30 minutes. There can be no assurance that future results or events will be consistent with the information provided in the report. The information is subject to change without any prior notice.
Technical Indicators Defined: -
Support: A level at which the stock prices tend to find support if they are falling, and a downtrend may take a pause backed by demand or buying interest.
Resistance: A level at which the stock prices tend to find resistance when they are rising, and the uptrend may take a pause due to profit booking or selling interest.
Stop-loss: In general, it is a level to protect further losses in case of any unfavourable movement in the stock prices.
Past performance is not a reliable indicator of future performance.

 Please wait processing your request...