Fortuna Mining Corp. (NYSE: FSM)
Fortuna Mining Corp. (NYSE: FSM) previously known as Fortuna Silver Mines Inc., is a Canada-based precious metals mining company with operations in Latin America and West Africa. It has mines in Argentina, Burkina Faso, Côte d'Ivoire, Mexico, and Peru, producing gold, silver, lead, and zinc. Key mines and projects include the Seguela Mine, Yaramoko Mine, Lindero Mine, San Jose Mine, and Caylloma Mine.
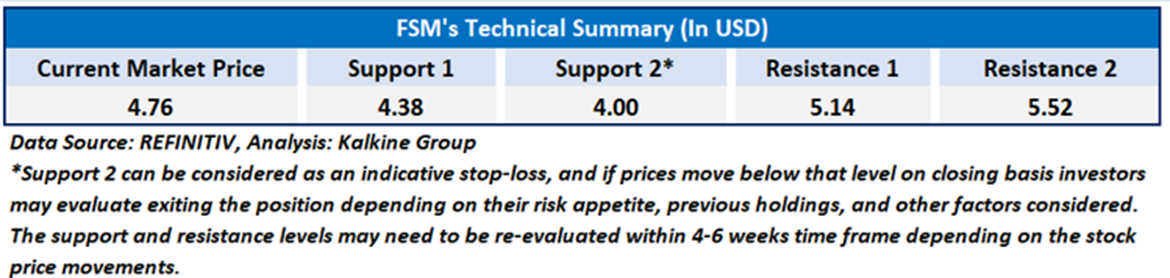
As per our US Inflation Report published on ‘FSM’ on 11th October 2024, Kalkine provided an ‘Buy’ stance on the stock at USD 4.76 based on fundamental analysis and the stock price has now moved by ~13.44% since then and is trading above resistance 1.
Noted below are the details of support and resistance levels provided in our previous report:
Key Recommendation Rationale – Sell at USD 5.40
- Declining Silver Production: Silver production decreased to 990,574 ounces in Q2 2024 from 1,074,571 ounces in Q1 2024. This decline is concerning as it reflects diminishing resources at the San Jose mine, which is entering its last year of mineral reserves.
- Higher General and Administrative Expenses: General and administrative expenses rose to USD 22.4 million, a 54% increase compared to the same quarter in 2023. This was largely due to the transition of Séguéla to operations and increased share-based compensation, which could strain resources further.
- Decrease in Cash and Cash Equivalents: Cash and cash equivalents decreased by 18% to USD 105.6 million compared to the previous quarter. This decline raises concerns about the company's liquidity position and its ability to fund future investments or navigate unforeseen challenges.
- Higher General and Administrative Expenses: General and administrative expenses rose to USD 22.4 million, a 54% increase compared to the same quarter in 2023. This was largely due to the transition of Séguéla to operations and increased share-based compensation, which could strain resources further.
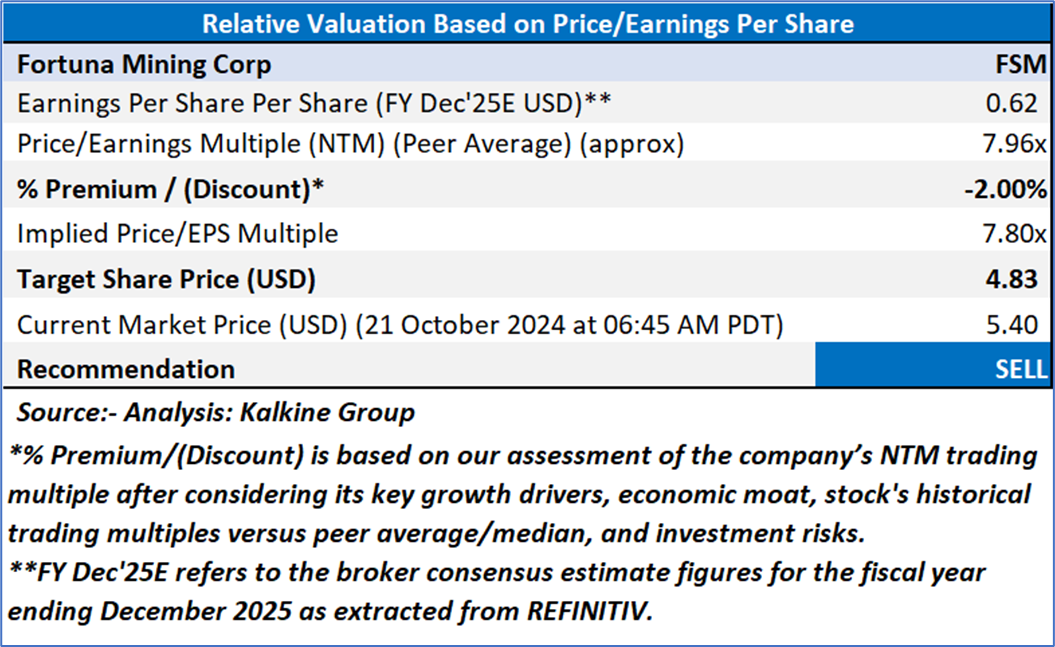
Valuation Methodology: Price/ Earnings Approach
FSM’s Daily Chart
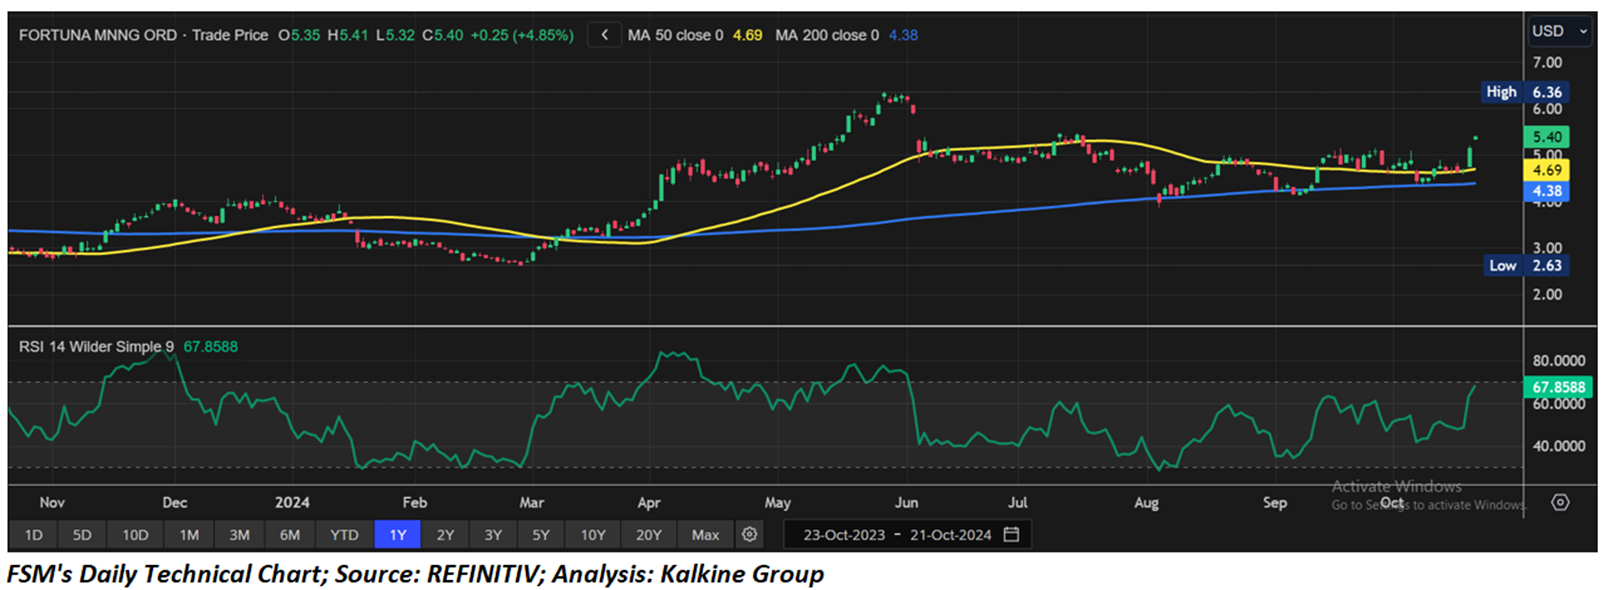
Considering the target level attainment, declining profit margins, lower liquidity, and increasing volatility over global equity market an ‘Sell’ rating is assigned to the ‘FSM’ at the current market price of USD 5.40 as of 21 October 2024 at 06:45 AM PDT.
Note: This report may be updated with details around fundamental and technical analysis, price chart in due course, as appropriate.
Note 1: Past performance is not a reliable indicator of future performance.
Note 2: The reference date for all price data, currency, technical indicators, support, and resistance level is 21 October 2024 at 06:45 AM PDT. The reference data in this report has been partly sourced from REFINITIV.
Note 3: Investment decisions should be made depending on an individual's appetite for upside potential, risks, holding duration, and any previous holdings. An 'Exit' from the stock can be considered if the Target Price mentioned as per the Valuation and or the technical levels provided has been achieved and is subject to the factors discussed above.
Note 4: Target Price refers to a price level that the stock is expected to reach as per the relative valuation method and or technical analysis taking into consideration both short-term and long-term scenarios.
Note 5: ‘Kalkine reports are prepared based on the stock prices captured either from the New York Stock Exchange (NYSE), NASDAQ Capital Markets (NASDAQ), and or REFINITIV. Typically, all sources (NYSE, NASDAQ, or REFINITIV) may reflect stock prices with a delay which could be a lag of 15-20 minutes. There can be no assurance that future results or events will be consistent with the information provided in the report. The information is subject to change without any prior notice.

 Please wait processing your request...