GrafTech International Ltd (NASDAQ: EAF)
EAF is engaged in manufacturing graphite electrode products that are essential to the production of electric arc furnace (EAF) steel and other ferrous and non-ferrous metals. Company's segment of Industrial Materials is comprised into graphite electrodes and petroleum needle coke products.
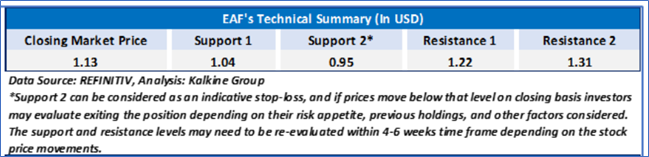
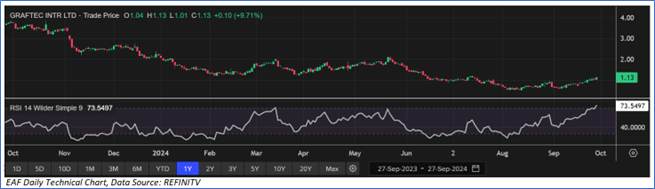
As per the previous Daily Report published on EAF on 12 July 2024, Kalkine provided an ‘Speculative Buy’ rating on the stock at USD 1.13. On the daily chart, EAF prices are hovering below the horizontal trendline resistance zone. Moreover, the momentum oscillator RSI (14-period) is showing a reading of ~73.55 level, which shows the stock prices in the overbought zone. However, the prices are trading above the trend-following indicator 21-period SMA, which may act as a support level. An important support level for the stock is placed at USD 0.935, while the key resistance level is placed at USD 1.22.
Previous Recommendation Summary as on 12 July 2024
EAF Daily Chart
Considering the technical commentary, market uncertainties, current trading level, and risks associated, the share price can witness resistance at the current levels. Hence, a ‘Sell’ recommendation is given on the stock at the closing market price of USD 1.13, as of 27 September 2024.
Markets are trading in a highly volatile zone currently due to certain macro-economic issues and geopolitical issues prevailing geopolitical tensions. Therefore, it is prudent to follow a cautious approach while investing.
Note 1: Past performance is neither an indicator nor a guarantee of future performance.
Note 2: The reference date for all price data, currency, technical indicators, support, and resistance levels is 27 September 2024. The reference data in this report has been partly sourced from REFINITIV.
Note 3: Investment decisions should be made depending on an individual's appetite for upside potential, risks, holding duration, and any previous holdings. An 'Exit' from the stock can be considered if the Target Price mentioned as per the Valuation and or the technical levels provided has been achieved and is subject to the factors discussed above.
Technical Indicators Defined: -
Support: A level at which the stock prices tend to find support if they are falling, and downtrend may take a pause backed by demand or buying interest.
Resistance: A level at which the stock prices tend to find resistance when they are rising, and uptrend may take a pause due to profit booking or selling interest.
Stop-loss: In general, it is a level to protect further losses in case of any unfavourable movement in the stock prices.

 Please wait processing your request...