
Section1: Company Overview
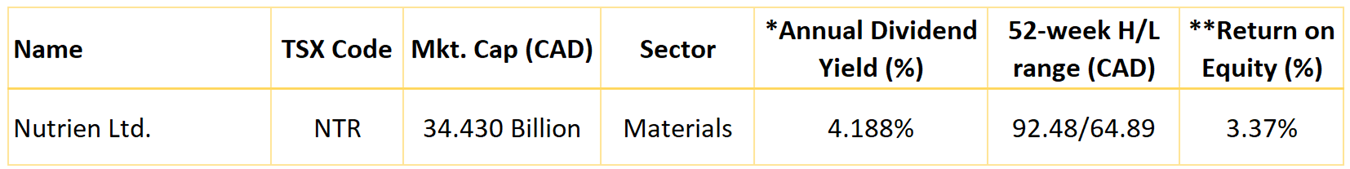
Nutrien Ltd. (TSX: NTR) is the world's largest fertilizer producer by capacity. Nutrien produces the three main crop nutrients nitrogen, potash, and phosphate although its main focus is potash, where it is the global leader in installed capacity with roughly 20% share.
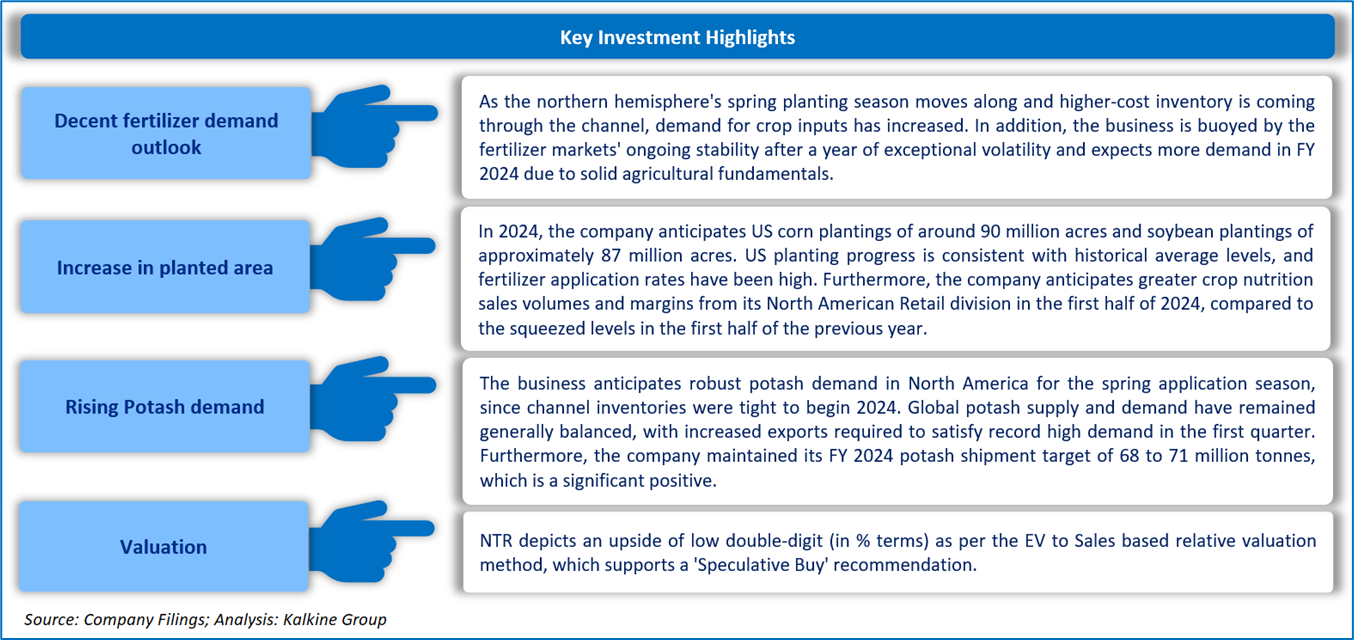
This Report covers the Investment Highlights, Key Financial Metrics, Valuation, Target Price, and Recommendation on the stock.
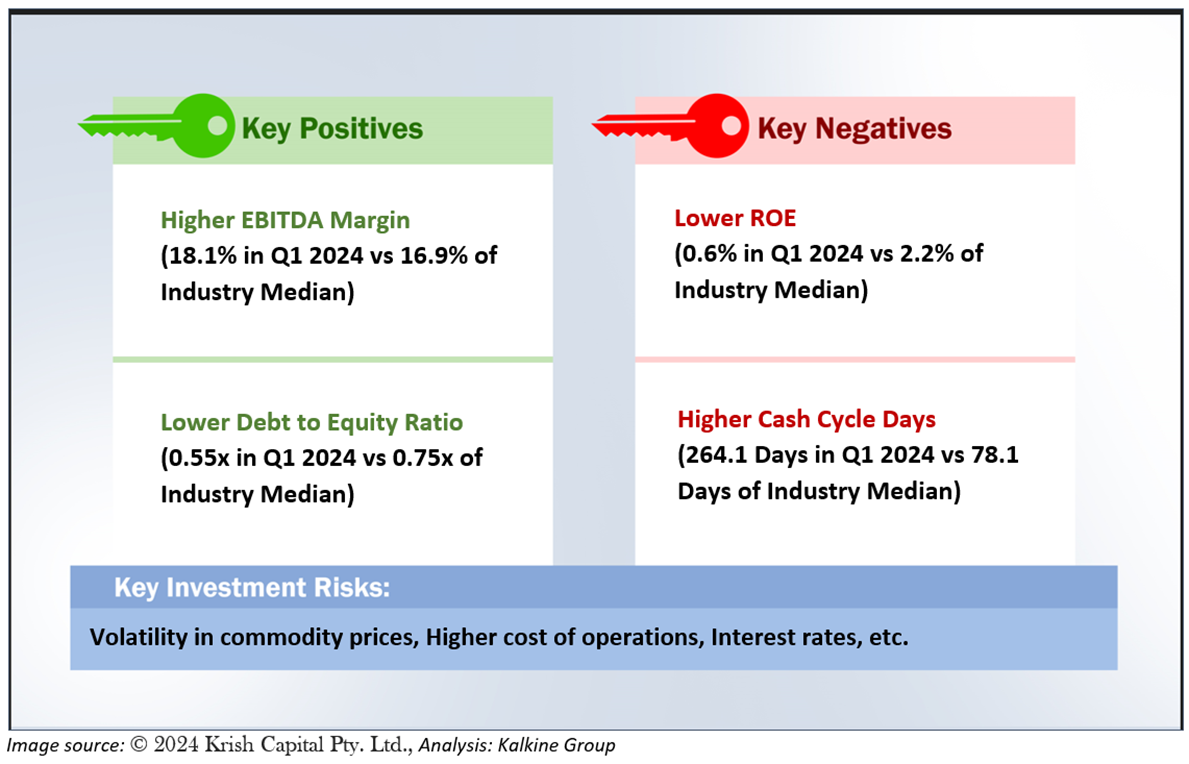
1.1 The Key Positives, Negatives, Investment Highlights, and Risks
Section2: Financial Highlights
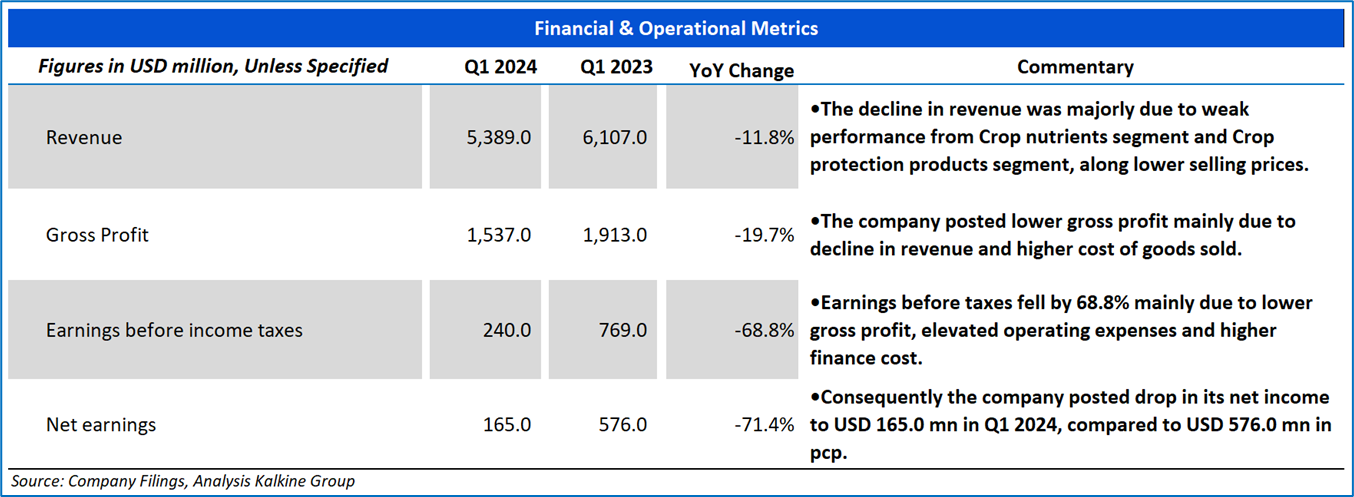
2.1 Key Financial Highlights
Section 3: Stock Recommendation Summary
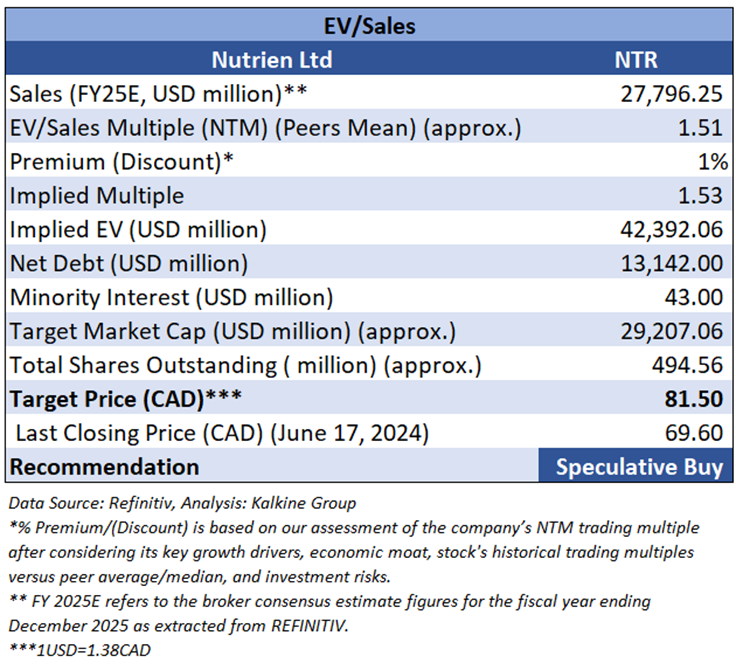
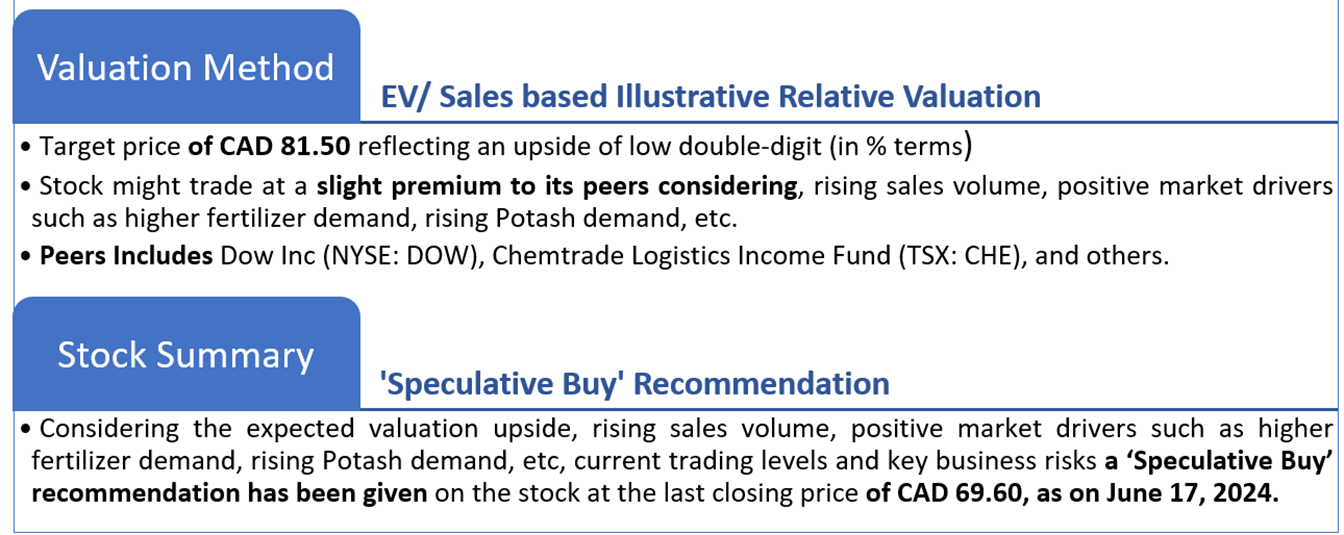
3.1 Valuation Methodology
Valuation Methodology (Illustrative): EV/ Sales based
3.2 Price Performance and Stock Recommendation

The stock has witnessed a downside of ~8.23% and ~11.42% over the last 1 week and 1 month respectively. Moreover, the stock is trading below the average of 52-week high price of CAD 92.48 and 52-week low price of CAD 64.89 providing an opportunity to accumulate the stock.
3.3 One-Year Technical Price Chart
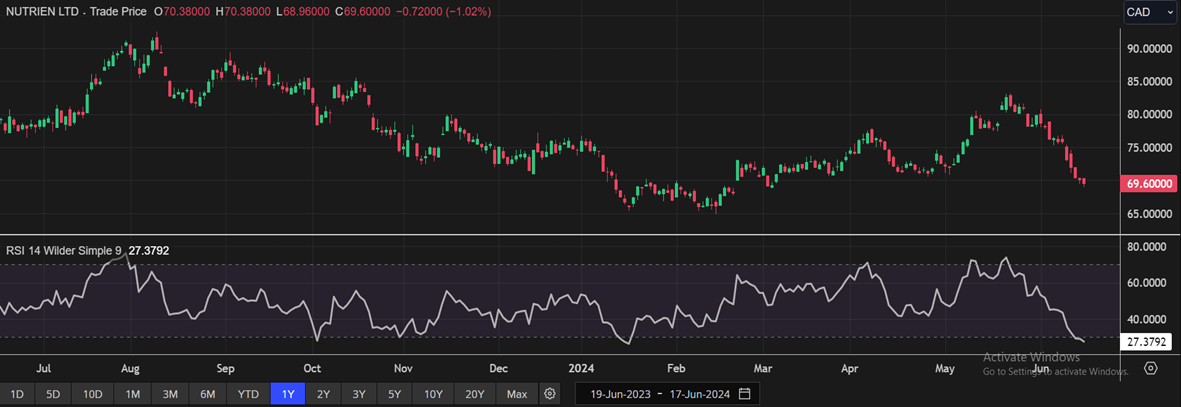
One-Year Technical Price Chart (as of June 17, 2024). Source: REFINITIV, Analysis: Kalkine Group
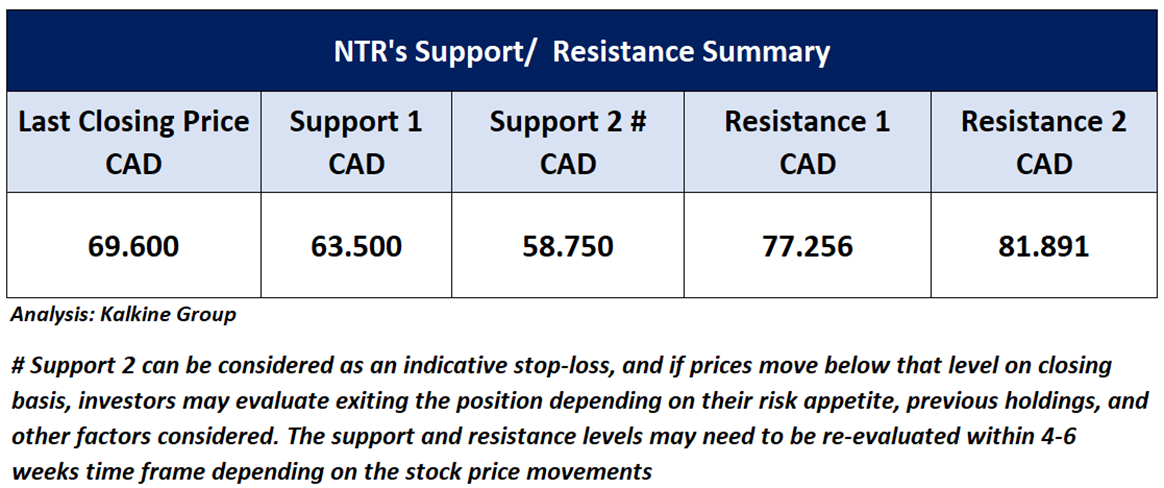
3.4 Technical Summary
Note 1: Past performance is not a reliable indicator of future performance.
Note 2: The reference date for all price data, currency, technical indicators, support, and resistance levels as on June 17, 2024. The reference data in this report has been partly sourced from REFINITIV.
Note 3: Investment decisions should be made depending on an individual's appetite for upside potential, risks, holding duration, and any previous holdings. An 'Exit' from the stock can be considered if the Target Price mentioned as per the Valuation and or the technical levels provided has been achieved and is subject to the factors discussed above.
Note 4: Dividend Yield may vary as per the stock price movement.
Technical Indicators Defined: -
Support: A level at which the stock prices tend to find support if they are falling, and a downtrend may take a pause backed by demand or buying interest.
Resistance: A level at which the stock prices tend to find resistance when they are rising, and the uptrend may take a pause due to profit booking or selling interest.
Stop-loss: In general, it is a level to protect further losses in case of any unfavourable movement in the stock prices.

 Please wait processing your request...