Progyny Inc
Progyny, Inc. (NASDAQ: PGNY) is a benefit management company. The Company specializes in fertility and family building benefits solutions in the United States. The Company’s clients include various employers across an array of industries. It has contracts to provide coverage to approximately 6.4 million employees and their partners (known as members). The Company provides its benefits through its proprietary Smart Cycle approach.
Recent Business and Financial Updates
- Revenue Performance: In the second quarter of 2024, the company reported revenue of USD 304.1 million, an 8.8% increase compared to USD 279.4 million in the same period of 2023. This growth was largely driven by an expansion in the client base and the number of covered lives. Fertility benefit services generated USD 193.6 million in revenue, representing a 12% increase from the USD 172.7 million reported in the second quarter of 2023. Meanwhile, pharmacy benefit services contributed USD 110.5 million, a 3.6% rise from USD 106.6 million in the previous year.
- Profit and Margins: Gross profit for the second quarter of 2024 amounted to USD 68.3 million, a 13% improvement over the USD 60.6 million recorded in the same period in 2023. The increase in gross profit was mainly attributed to higher revenue levels. The company’s gross margin also improved, rising to 22.5%, compared to 21.7% in the second quarter of 2023, reflecting operational efficiencies and enhanced revenue generation.
- Net Income and Adjusted EBITDA: Net income for the quarter stood at USD 16.5 million, equating to USD 0.17 per diluted share. This represents an increase from the USD 15.0 million, or USD 0.15 per diluted share, reported in the second quarter of 2023. The improvement in net income was primarily driven by the higher overall profitability of the business. Adjusted EBITDA for the second quarter of 2024 was USD 54.5 million, a 15% increase compared to USD 47.5 million in the same period of 2023. This rise in EBITDA was underpinned by higher gross profit and enhanced operational efficiencies. The Adjusted EBITDA margin increased by 90 basis points, reaching 17.9% compared to 17.0% in the second quarter of 2023.
- Cash Flow: Net cash provided by operating activities during the second quarter of 2024 was USD 56.7 million, which marked a decrease from the USD 76.0 million generated in the same period of the previous year. The lower cash flow was primarily due to the impacts of favorable working capital conditions in the prior year period, coupled with higher income tax payments in the second quarter of 2024.
- Balance Sheet and Capital Position: As of June 30, 2024, the company reported a total working capital of approximately USD 356.9 million, with no outstanding debt. The company held cash, cash equivalents, and marketable securities amounting to USD 262.2 million, a decrease of USD 109.6 million from March 31, 2024. This reduction was largely the result of stock repurchase activities conducted during the quarter. In total, the company repurchased 5,593,128 shares for USD 159.8 million under its share repurchase programs. On August 5, 2024, the board authorized an additional USD 100 million for further stock repurchases.
- Client Growth and Key Metrics: The company experienced notable growth in its client base, with the number of clients increasing to 463 as of June 30, 2024, compared to 384 as of June 30, 2023. In terms of service utilization, the company recorded 15,562 assisted reproductive technology (ART) cycles in the second quarter of 2024, up from 14,771 cycles in the same period of 2023. Utilization rates for all members and female-only members were 0.55% and 0.47%, respectively, compared to 0.57% and 0.50% in the second quarter of the previous year. The average number of members during this period was 6,409,000, compared to 5,340,000 in the same period in 2023.
- Financial Outlook: The company has revised its financial projections for the full year ending December 31, 2024, and the third quarter of 2024. Full-year revenue is expected to range between USD 1.165 billion and USD 1.20 billion, reflecting growth of 7% to 10%. Net income is projected to range from USD 55.4 million to USD 62.4 million, or USD 0.57 to USD 0.64 per diluted share. Adjusted EBITDA for 2024 is forecasted to range between USD 199.0 million and USD 209.0 million, with adjusted earnings per diluted share projected between USD 1.53 and USD 1.61. For the third quarter of 2024, revenue is anticipated to range from USD 290.0 million to USD 303.0 million, with net income expected to range from USD 10.7 million to USD 13.2 million, or USD 0.11 to USD 0.14 per diluted share. Adjusted EBITDA for the quarter is forecasted to range between USD 47.5 million and USD 51.0 million, with adjusted earnings per diluted share projected between USD 0.35 and USD 0.38.
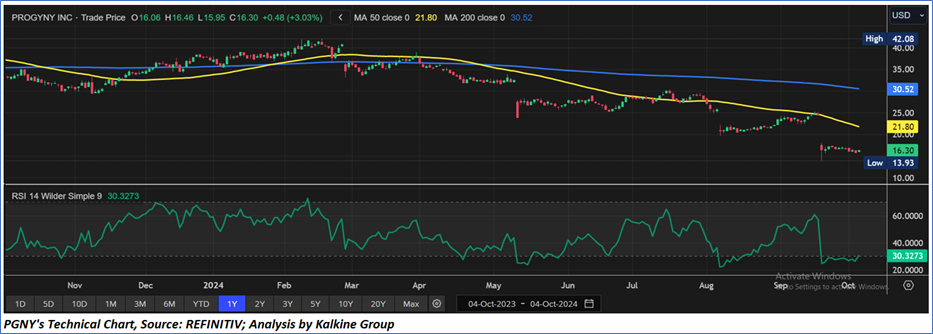
Technical Observation (on the daily chart):
The Relative Strength Index (RSI) over a 14-day period stands at a value of 30.33, currently consolidating near oversold levels, with expectations of an upward momentum once the price breaks an important resistance of USD 17.50. Additionally, the stock's current positioning is below both the 50-period SMA and 200-period SMA, which may serve as dynamic short to medium-term resistance levels.
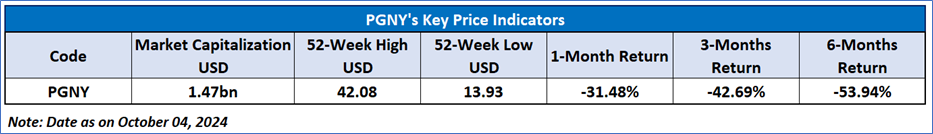
As per the above-mentioned price action, recent key business and financial updates, momentum in the stock over the last month, and technical indicators analysis, a ‘Buy’ rating has been given to Progyny, Inc. (NASDAQ: PGNY) at the closing market price of USD 16.30 as of October 04, 2024.
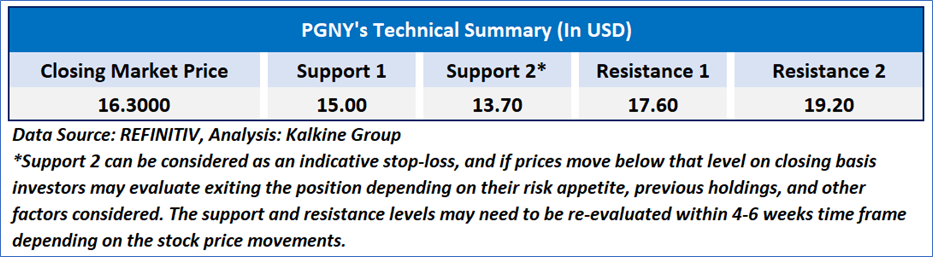
Individuals can evaluate the stock based on the support and resistance levels provided in the report in case of keen interest taking into consideration the risk-reward scenario.
Markets are trading in a highly volatile zone currently due to certain macro-economic issues and prevailing geopolitical tensions. Therefore, it is prudent to follow a cautious approach while investing.
Related Risk: This report may be looked at from a high-risk perspective and a recommendation is provided for a short duration. This report is solely based on technical parameters, and the fundamental performance of the stocks has not been considered in the decision-making process. Other factors which could impact the stock prices include market risks, regulatory risks, interest rates risks, currency risks, social and political instability risks etc.
Note 1: Past performance is not a reliable indicator of future performance.
Note 2: The reference date for all price data, currency, technical indicators, support, and resistance level is October 04, 2024. The reference data in this report has been partly sourced from REFINITIV.
Note 3: Investment decisions should be made depending on an individual's appetite for upside potential, risks, holding duration, and any previous holdings. An 'Exit' from the stock can be considered if the Target Price mentioned as per the Valuation and or the technical levels provided has been achieved and is subject to the factors discussed above.
Note 4: Target Price refers to a price level that the stock is expected to reach as per the relative valuation method and or technical analysis taking into consideration both short-term and long-term scenarios.
Note 5: ‘Kalkine reports are prepared based on the stock prices captured either from the New York Stock Exchange (NYSE), NASDAQ Capital Markets (NASDAQ), and or REFINITIV. Typically, all sources (NYSE, NASDAQ, or REFINITIV) may reflect stock prices with a delay which could be a lag of 15-20 minutes. There can be no assurance that future results or events will be consistent with the information provided in the report. The information is subject to change without any prior notice.

 Please wait processing your request...