This report is an updated version of the report published on the 3 May 2024 at 10:28 AM PST.
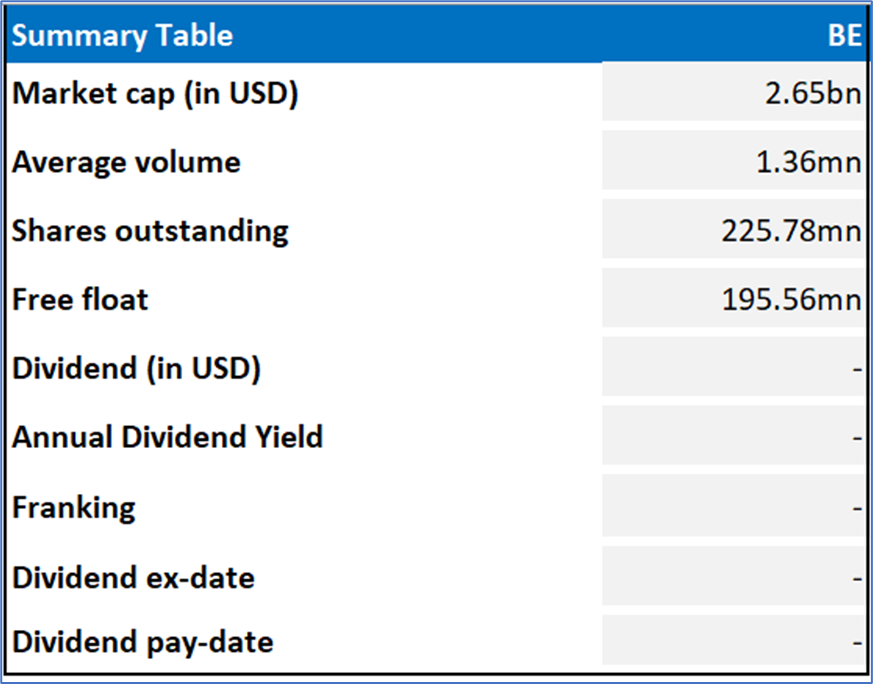
Bloom Energy Corporation (NYSE: BE)
Bloom Energy Corporation (NYSE: BE) provides commercially viable solid oxide fuel-cell based power generation platform that offers power to businesses essential services, critical infrastructure, and communities.
Recommendation Rationale – SELL at USD 12.17
- Financial Performance: BE's total revenue increased by nearly 11.2% YoY and stood at USD 1,333.47mn in FY23 vs USD 1,199.13mn in FY22. This growth was primarily assisted by an increase in revenue across all segments during the period. The company's gross profit for FY23 reached USD 197.79mn, while in FY22 it was USD 148.29mn, supported by revenue growth. Additionally, non-GAAP profit-loss from operations turned positive at USD 19.18mn in FY23, compared to a loss of USD 33.47mn in FY22.
- Recent Update: On 29 April 2024, BE announced a partnership deal with Quanta Computer Inc., a premier Taiwanese electronics manufacturer. The move aids BE’s capability to meet the mounting time-to-power challenges of the promising AI sector.
- Outlook: The company expects its revenue to be between USD 1.4bn and USD 1.6bn for FY24, indicating a meaningful growth trajectory compared to previous periods. BE aims to achieve a non-GAAP gross margin of approximately 28% in FY24.
- Emerging Risks: BE revenue and backlog heavily rely on a few key customers, and a loss or significant decrease in orders from them could profoundly impact the company's operating results and other critical metrics.
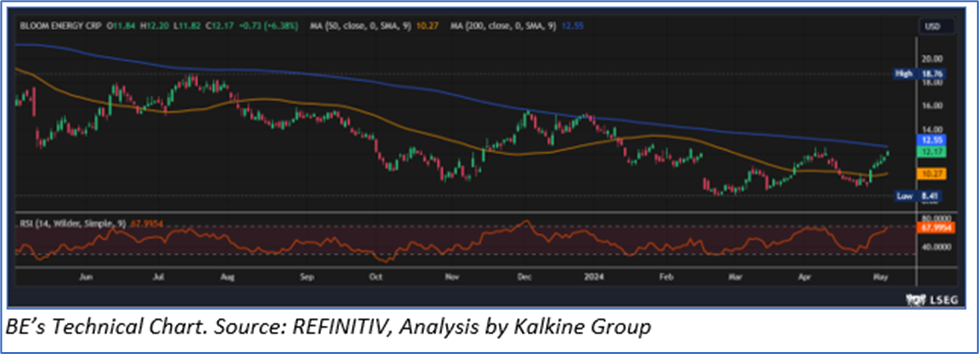
BE Daily Chart
Valuation Methodology: EV/Sales Approach (FY December'24E) (Illustrative)

Given the expected revenue growth in FY24, receipt of up to USD 75mn tax credit, agreements with Shell, etc, the company might trade at a slight premium to its peers. For valuation, few peers like Shoals Technologies Group Inc (NASDAQ: SHLS), Fuelcell Energy Inc (NASDAQ: FCEL), Plug Power Inc (NASDAQ: PLUG), and others have been considered. Considering the current trading levels, resistance 1 attainment, risks associated, downside indicated by valuation, and volatile market conditions on the back of higher interest rates, a ‘Sell’ recommendation is given on the stock at the current market price of USD 12.17 (as of 03rd May 2024 at 07:02 AM PST).
Markets are trading in a highly volatile zone currently due to certain macro-economic issues and geopolitical tensions prevailing. Therefore, it is prudent to follow a cautious approach while investing.
Note 1: Past performance is neither an indicator nor a guarantee of future performance.
Note 2: The reference date for all price data, currency, technical indicators, support, and resistance levels is 3 May 2024. The reference data in this report has been partly sourced from REFINITIV.
Note 3: Investment decisions should be made depending on an individual's appetite for upside potential, risks, holding duration, and any previous holdings. An 'Exit' from the stock can be considered if the Target Price mentioned as per the Valuation and or the technical levels provided has been achieved and is subject to the factors discussed above.
Technical Indicators Defined: -
Support: A level at which the stock prices tend to find support if they are falling, and a downtrend may take a pause backed by demand or buying interest. Support 1 refers to the nearby support level for the stock and if the price breaches the level, then Support 2 may act as the crucial support level for the stock.
Resistance: A level at which the stock prices tend to find resistance when they are rising, and an uptrend may take a pause due to profit booking or selling interest. Resistance 1 refers to the nearby resistance level for the stock and if the price surpasses the level, then Resistance 2 may act as the crucial resistance level for the stock.
Stop-loss: It is a level to protect further losses in case of unfavourable movement in the stock prices.

 Please wait processing your request...