NIKE Inc
NIKE, Inc. (NYSE: NKE) is engaged in the designing, marketing, and distributing of athletic footwear, apparel, equipment and accessories and services for sports and fitness activities. The Company's operating segments include North America; Europe, Middle East & Africa (EMEA); Greater China; and Asia Pacific & Latin America (APLA).
Recent Financial and Business Updates:
- Fourth Quarter Revenue Performance: In the fourth quarter, NIKE, Inc. reported revenues of USD 12.6 billion, reflecting a 2 percent decline on a reported basis and stability on a currency-neutral basis. The NIKE Brand contributed USD 12.1 billion, experiencing a 1 percent decrease on a reported basis but a 1 percent increase on a currency-neutral basis, driven by growth in Greater China, APLA, and EMEA, partially offset by a decline in North America.
- Direct and Wholesale Revenue Insights: NIKE Direct revenues amounted to USD 5.1 billion, marking an 8 percent decrease on a reported basis and a 7 percent decline on a currency-neutral basis, influenced by a 10 percent drop in NIKE Brand Digital sales and a 2 percent decrease in NIKE-owned stores. Conversely, wholesale revenues improved, reaching USD 7.1 billion, up 5 percent on a reported basis and 8 percent on a currency-neutral basis. Revenues for Converse stood at USD 480 million, declining 18 percent on a reported basis and 17 percent on a currency-neutral basis, primarily due to decreased sales in North America and Western Europe.
- Improvement in Gross Margin: The gross margin increased by 110 basis points to 44.7 percent, driven by strategic pricing actions, reduced ocean freight and logistics costs, and lower warehousing expenses. These gains were partially offset by lower margins in NIKE Direct and unfavorable currency exchange rate changes.
- Reduction in Operating Expenses: Selling and administrative expenses decreased by 7 percent to USD 4.1 billion. Demand creation expenses remained flat at USD 1.1 billion, while operating overhead expenses decreased by 9 percent to USD 3.0 billion, mainly due to lower wage-related expenses, including USD 39 million in restructuring charges.
- Tax Rate and Net Income Growth: The effective tax rate was 13.1 percent, compared to 17.3 percent the previous year, influenced by changes in earnings mix and reduced benefits from stock-based compensation. Net income rose by 45 percent to USD 1.5 billion, with diluted earnings per share at USD 0.99, including USD 0.02 in restructuring charges. Excluding these charges, diluted earnings per share would have been USD 1.01.
- Fiscal 2024 Revenue and Margin Overview: For fiscal 2024, NIKE, Inc. reported revenues of USD 51.4 billion, compared to USD 51.2 billion in the previous year, representing a 1 percent increase on a currency-neutral basis. The NIKE Brand generated USD 49.3 billion, reflecting a 1 percent increase on both reported and currency-neutral bases, with growth in Greater China and APLA offsetting a decline in North America. The gross margin increased by 110 basis points to 44.6 percent, driven by strategic pricing actions and lower ocean freight and logistics costs, partially offset by higher product input costs, lower margins in NIKE Direct, and unfavorable currency exchange rate changes.
- Expense Analysis and Earnings Improvement: Selling and administrative expenses rose by 1 percent to USD 16.6 billion, including USD 379 million in restructuring charges. Demand creation expenses increased by 6 percent to USD 4.3 billion, reflecting higher advertising and marketing costs. Operating overhead expenses remained flat at USD 12.3 billion, with lower wage-related expenses and reduced technology spending offset by restructuring charges. The effective tax rate was 14.9 percent, compared to 18.2 percent the previous year, due to changes in earnings mix and one-time benefits. Net income increased by 12 percent to USD 5.7 billion, with diluted earnings per share at USD 3.73, including USD 0.22 in restructuring charges. Excluding these charges, diluted earnings per share would have been USD 3.95.
- May 31, 2024, Balance Sheet Review: As of May 31, 2024, NIKE, Inc.'s inventories were valued at USD 7.5 billion, reflecting an 11 percent decrease compared to the previous year, attributable to a reduction in units. Cash and equivalents, along with short-term investments, amounted to USD 11.6 billion, an increase of USD 0.9 billion from the previous year, as operational cash generation was partially offset by share repurchases, cash dividends, and capital expenditures.
- Consistent Shareholder Returns: NIKE continues its strong track record of enhancing shareholder returns, marking 22 consecutive years of increasing dividend payouts. In the fourth quarter, the Company returned approximately USD 1.6 billion to shareholders, comprising USD 560 million in dividends, a 7 percent increase from the prior year, and USD 1.0 billion in share repurchases, reflecting 11.1 million shares retired under the four-year, USD 18 billion program approved by the Board of Directors in June 2022. Throughout fiscal 2024, the Company returned approximately USD 6.4 billion to shareholders, including USD 2.2 billion in dividends, up 8 percent from the prior year, and USD 4.3 billion in share repurchases, totaling 41.4 million shares retired under the same program. As of May 31, 2024, NIKE had repurchased a total of 84.9 million shares, amounting to approximately USD 9.1 billion.
Technical Observation (on the daily chart)
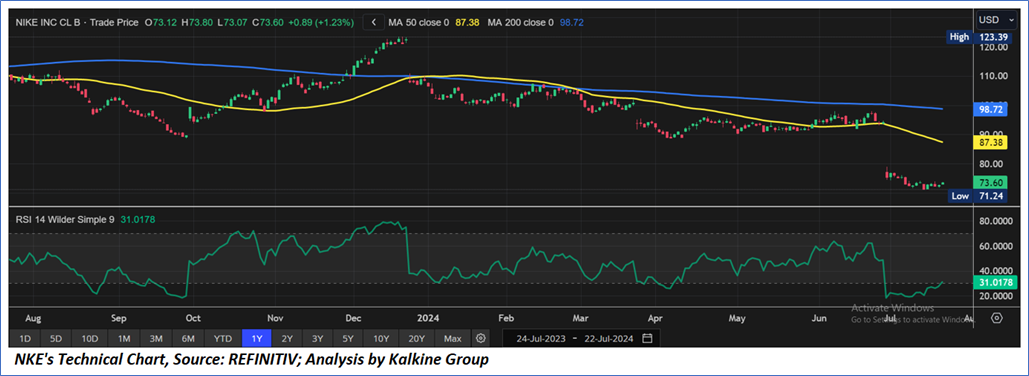
The Relative Strength Index (RSI) over a 14-day period stands at 31.02 recovering from oversold zone, indicating a state of potential consolidation or a short-term upward momentum. This upward momentum might take the stock closer to a significant resistance level at USD 85-USD 90. Additionally, the stock's current positioning is below both the 50-day Simple Moving Average (SMA) and the 200-day SMA, which may serve as dynamic short-term resistance levels.
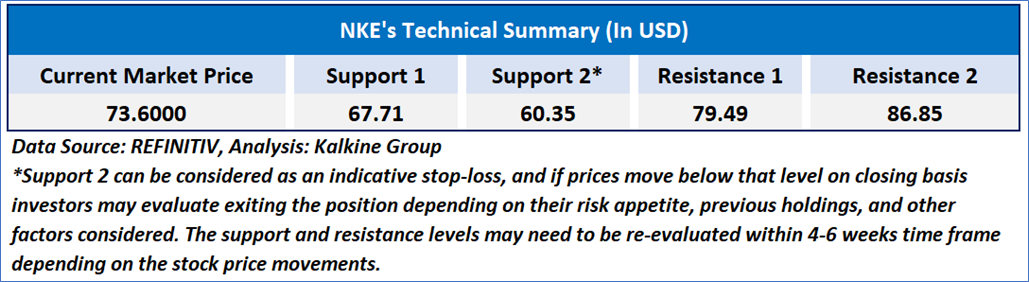
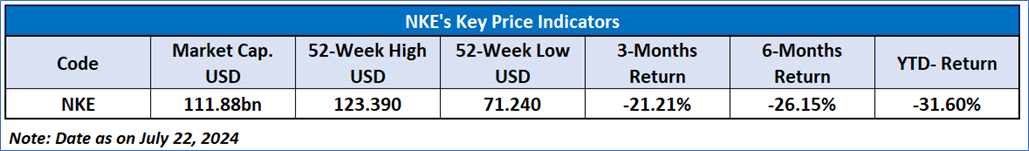
As per the above-mentioned price action, recent key business and financial updates, momentum in the stock over the last month, and technical indicators analysis, a ‘Buy’ rating has been given to NIKE, Inc. (NYSE: NKE) at the current market price of USD 73.60 as of July 22, 2024, at 07:35 am PDT.
Individuals can evaluate the stock based on the support and resistance levels provided in the report in case of keen interest taking into consideration the risk-reward scenario.
Markets are trading in a highly volatile zone currently due to certain macro-economic issues and prevailing geopolitical tensions. Therefore, it is prudent to follow a cautious approach while investing.
Related Risk: This report may be looked at from a high-risk perspective and a recommendation is provided for a short duration. This report is solely based on technical parameters, and the fundamental performance of the stocks has not been considered in the decision-making process. Other factors which could impact the stock prices include market risks, regulatory risks, interest rates risks, currency risks, social and political instability risks etc.
Note 1: Past performance is not a reliable indicator of future performance.
Note 2: The reference date for all price data, currency, technical indicators, support, and resistance level is July 22, 2024. The reference data in this report has been partly sourced from REFINITIV.
Note 3: Investment decisions should be made depending on an individual's appetite for upside potential, risks, holding duration, and any previous holdings. An 'Exit' from the stock can be considered if the Target Price mentioned as per the Valuation and or the technical levels provided has been achieved and is subject to the factors discussed above.
Note 4: Target Price refers to a price level that the stock is expected to reach as per the relative valuation method and or technical analysis taking into consideration both short-term and long-term scenarios.
Note 5: ‘Kalkine reports are prepared based on the stock prices captured either from the New York Stock Exchange (NYSE), NASDAQ Capital Markets (NASDAQ), and or REFINITIV. Typically, all sources (NYSE, NASDAQ, or REFINITIV) may reflect stock prices with a delay which could be a lag of 15-20 minutes. There can be no assurance that future results or events will be consistent with the information provided in the report. The information is subject to change without any prior notice.

 Please wait processing your request...