GreenTree Hospitality Group Ltd
GreenTree Hospitality Group Ltd (NYSE: GHG) is a China-based company principally engaged in the operation of franchised hotels. The Company’s hotel network is mostly comprised of franchised-and-managed hotels. The Company is dedicated to operating mid-scale hotels and its main brand is called GreenTree Inns. The Company operates its business mainly in China.
Recent Business and Financial Updates
- Revenue Performance: The total revenues for the second quarter of 2024 amounted to RMB 329.7 million (USD 45.4 million), reflecting a 20.5% decline compared to the same period in the previous year. Revenue from hotel operations was RMB 264.6 million (USD 36.4 million), a decrease of 14.8% year-over-year, largely driven by a 10.8% decline in RevPAR and the closure of five leased-and-operated (L&O) hotels due to lease expirations and strategic decisions. Restaurant revenues saw a sharper decline of 37.8%, amounting to RMB 65.3 million (USD 9.0 million), primarily due to lower average daily sales (ADS) and the closure of unprofitable L&O restaurants.
- Operating Costs and Expenses: Operating costs for the second quarter of 2024 stood at RMB 198.3 million (USD 27.3 million), a reduction of 19.0% year-over-year. Hotel business operating costs decreased by 4.5% to RMB 143.4 million (USD 19.7 million), while restaurant business operating costs dropped significantly by 42.0% to RMB 55.1 million (USD 7.6 million). The decrease in operating costs was largely attributed to lower personnel expenses, reduced material consumption, and utility savings, particularly due to the closure of L&O hotels and restaurants.
- Profitability Metrics: Gross profit for the second quarter of 2024 was RMB 131.4 million (USD 18.1 million), a 22.8% year-over-year decline, with the gross margin decreasing to 39.8% from 41.0%. The hotel business generated a gross profit of RMB 121.2 million (USD 16.7 million), reflecting a 24.5% decline, while the restaurant business posted a gross profit of RMB 10.2 million (USD 1.4 million), a slight increase of 3.2%. Net income for the second quarter of 2024 was RMB 62.3 million (USD 8.6 million), down from RMB 101.9 million in the second quarter of 2023, resulting in a net margin of 18.9%.
- Adjusted EBITDA and Core Net Income: Adjusted EBITDA (non-GAAP) for the second quarter of 2024 amounted to RMB 83.1 million (USD 11.4 million), a 34.5% decrease compared to the prior year. The adjusted EBITDA margin dropped to 25.2% from 30.6% a year earlier. Core net income (non-GAAP) for the second quarter rose slightly by 2.4% to RMB 70.2 million (USD 9.7 million), with a core net margin of 21.3%, an improvement from 16.5% in the prior year. Earnings per ADS (basic and diluted) decreased to RMB 0.61 (USD 0.36) from RMB 1.01 in the second quarter of 2023.
- Cash Flow and Financial Position: Operating cash inflow for the second quarter of 2024 was RMB 69.2 million (USD 9.5 million), primarily driven by income from operations. Investing cash inflow amounted to RMB 157.6 million (USD 21.7 million), largely due to gains from the disposal of property and loan repayments from franchisees. Financing cash outflow was minimal at RMB 1.0 million (USD 0.1 million). As of June 30, 2024, the Company’s cash and cash equivalents, restricted cash, and short-term investments totaled RMB 1,737.2 million (USD 239.0 million), up from RMB 1,517.3 million as of March 31, 2024.
- Guidance and Dividend Distribution: Based on the performance of the first half of 2024 and the impact of closing several L&O hotels due to lease expirations and strategic decisions, the Company has revised its revenue guidance for the hotel business, anticipating flat growth for the remainder of 2024 compared to 2023. Additionally, the board of directors has approved a cash dividend of USD 0.10 per ordinary share, or USD 0.10 per American Depositary Share (ADS), payable to shareholders on record as of September 30, 2024. The revised guidance reflects the Company's current outlook but may not be indicative of results for the full year.
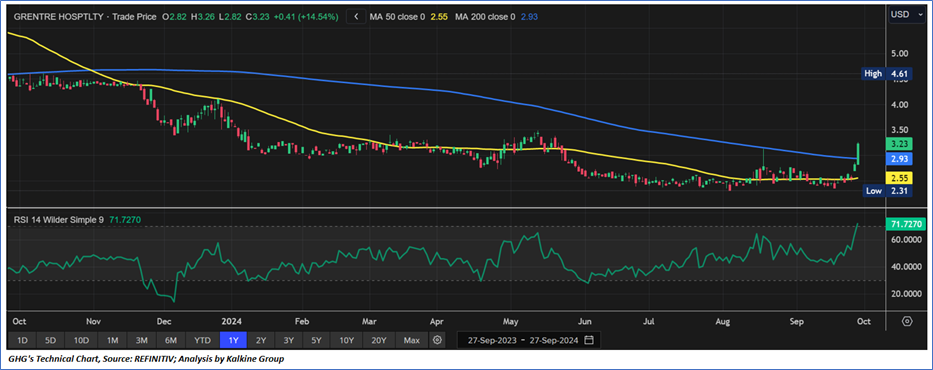
Technical Observation (on the daily chart):
The Relative Strength Index (RSI) over a 14-day period stands at a value of 71.73, currently upward trending, with expectations of a consolidation or an upward momentum as an important resistance of USD3.00 is broken. Additionally, the stock's current positioning is above both the 50-period SMA and 200-period SMA, which may serve as dynamic short to medium-term support levels.
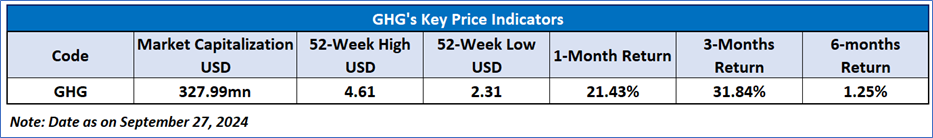
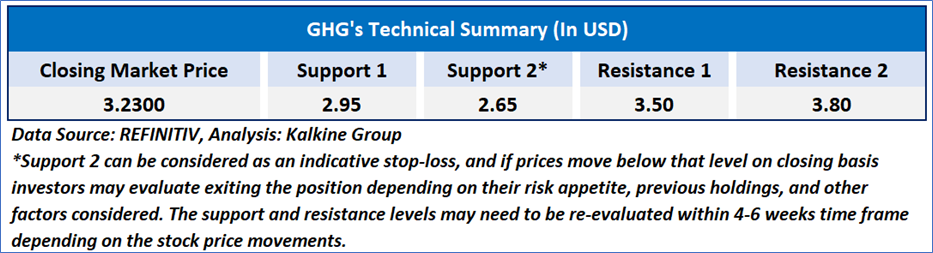 As per the above-mentioned price action, recent key business and financial updates, momentum in the stock over the last month, and technical indicators analysis, a ‘Speculative Buy’ rating has been given to GreenTree Hospitality Group Ltd (NYSE: GHG) at the closing market price of USD 3.23 as of September 27, 2024.
Individuals can evaluate the stock based on the support and resistance levels provided in the report in case of keen interest taking into consideration the risk-reward scenario.
Markets are trading in a highly volatile zone currently due to certain macro-economic issues and prevailing geopolitical tensions. Therefore, it is prudent to follow a cautious approach while investing.
Related Risk: This report may be looked at from a high-risk perspective and a recommendation is provided for a short duration. This report is solely based on technical parameters, and the fundamental performance of the stocks has not been considered in the decision-making process. Other factors which could impact the stock prices include market risks, regulatory risks, interest rates risks, currency risks, social and political instability risks etc.
Note 1: Past performance is not a reliable indicator of future performance.
Note 2: The reference date for all price data, currency, technical indicators, support, and resistance level is September 27, 2024. The reference data in this report has been partly sourced from REFINITIV.
Note 3: Investment decisions should be made depending on an individual's appetite for upside potential, risks, holding duration, and any previous holdings. An 'Exit' from the stock can be considered if the Target Price mentioned as per the Valuation and or the technical levels provided has been achieved and is subject to the factors discussed above.
Note 4: Target Price refers to a price level that the stock is expected to reach as per the relative valuation method and or technical analysis taking into consideration both short-term and long-term scenarios.
Note 5: ‘Kalkine reports are prepared based on the stock prices captured either from the New York Stock Exchange (NYSE), NASDAQ Capital Markets (NASDAQ), and or REFINITIV. Typically, all sources (NYSE, NASDAQ, or REFINITIV) may reflect stock prices with a delay which could be a lag of 15-20 minutes. There can be no assurance that future results or events will be consistent with the information provided in the report. The information is subject to change without any prior notice.
 Please wait processing your request...