

Section1: Company Overview
Shopify Inc. (TSX: SHOP) offers an e-commerce platform primarily to small and midsize businesses. The firm has two segments: subscription solutions and merchant solutions, The subscription solutions segment allows Shopify merchants to conduct e-commerce on a variety of platforms, including the company's website, physical stores, pop-up stores, kiosks, social networks (Facebook), and Amazon. Merchant solutions are add-on products for the platform that facilitate e-commerce and include Shopify Payments, Shopify Shipping, and Shopify Capital. This Report covers the Investment Highlights, Key Financial Metrics, Risks, Technical Analysis along with the Valuation, Target Price, and Recommendation on the stock.
1.1 The Key Positives, Negatives, Investment Highlights, and Risks


Section2: Financial Highlights
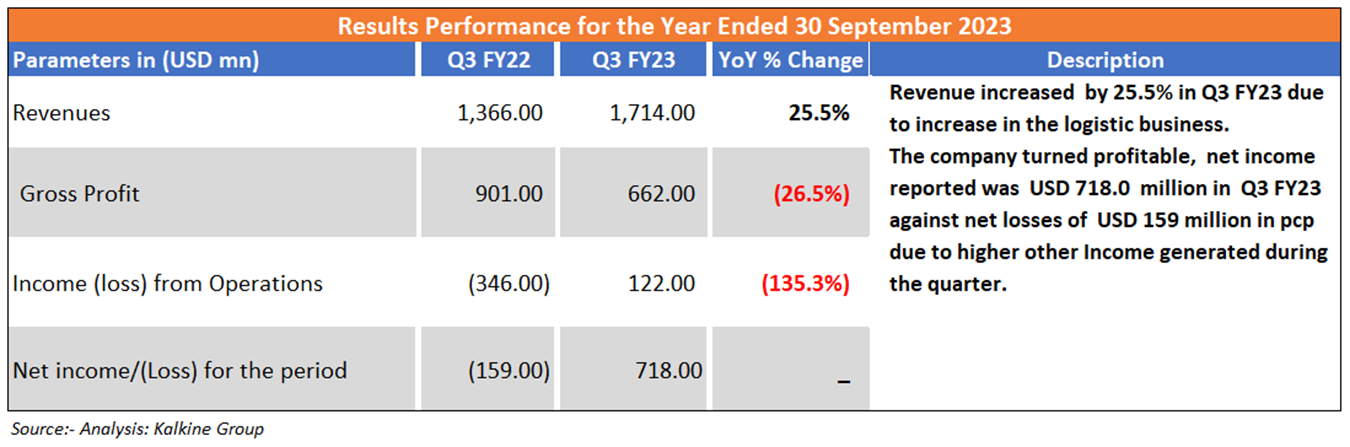
2.1 Key Financial Highlights
Section 3: Stock Recommendation Summary
3.1 Valuation Methodology
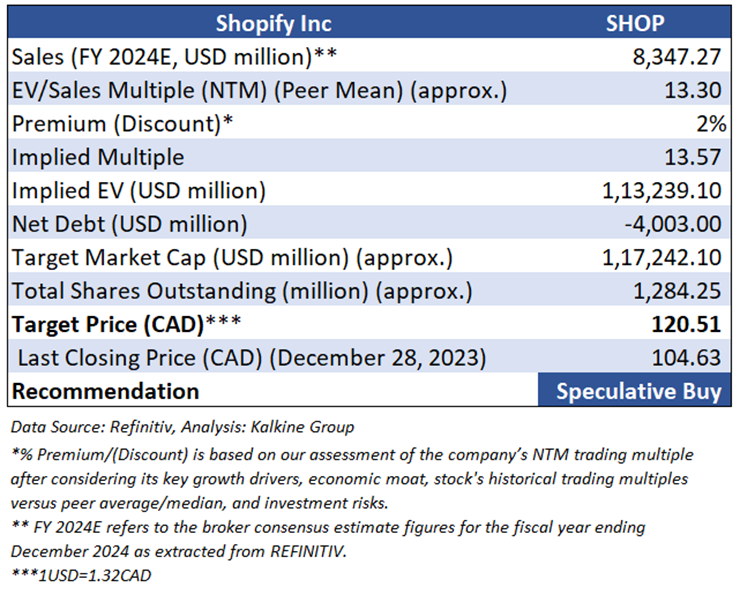
Valuation Methodology (Illustrative): EV to Sales based.
3.2 Price Performance and Stock Recommendation

The stock has witnessed an upside of ~3.46% in 1 week and ~4.80% over the last 1 month. Moreover, the stock is trading above the average 52-week high price of CAD 106.68 and 52-week low price of CAD 44.06 providing an opportunity to ride the trend.

3.3 One-Year Technical Price Chart
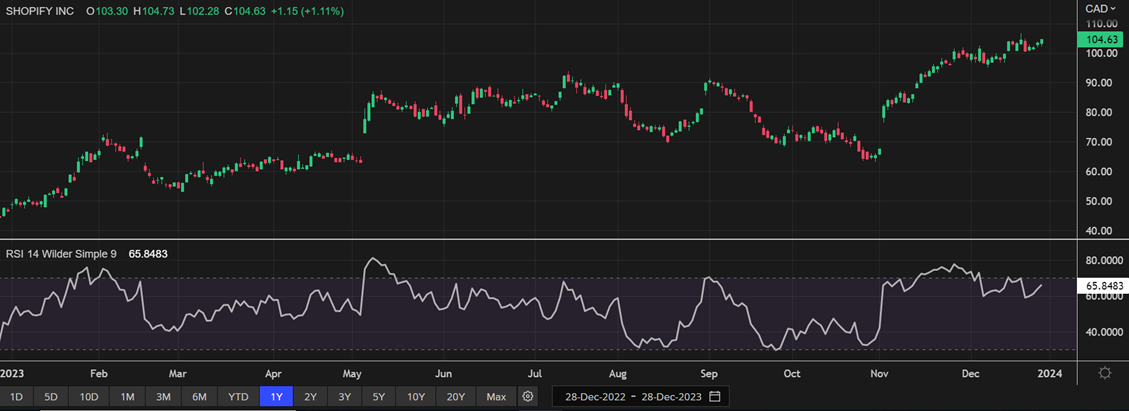
One-Year Technical Price Chart (as of December 28, 2023). Source: REFINITIV, Analysis: Kalkine Group
3.4 Technical Summary
Note 1: Past performance is not a reliable indicator of future performance.
Note 2: The reference date for all price data, currency, technical indicators, support, and resistance levels as on December 28, 2023. The reference data in this report has been partly sourced from REFINITIV.
Note 3: Investment decisions should be made depending on an individual's appetite for upside potential, risks, holding duration, and any previous holdings. An 'Exit' from the stock can be considered if the Target Price mentioned as per the Valuation and or the technical levels provided has been achieved and is subject to the factors discussed above.
Note 4: Dividend Yield may vary as per the stock price movement.
Technical Indicators Defined: -
Support: A level at which the stock prices tend to find support if they are falling, and a downtrend may take a pause backed by demand or buying interest.
Resistance: A level at which the stock prices tend to find resistance when they are rising, and the uptrend may take a pause due to profit booking or selling interest.
Stop-loss: In general, it is a level to protect further losses in case of any unfavourable movement in the stock prices.
Section1: Company Overview
Intact Financial Corp (TSX: IFC) is a property and casualty insurance company that provides written premiums in Canada. The company distributes insurance under the Intact Insurance brand through a network of brokers and a wholly-owned subsidiary, BrokerLink, and directly to consumers through Belairdirect. This Report covers the Investment Highlights, Key Financial Metrics, Risks, Technical Analysis along with the Valuation, Target Price, and Recommendation on the stock.
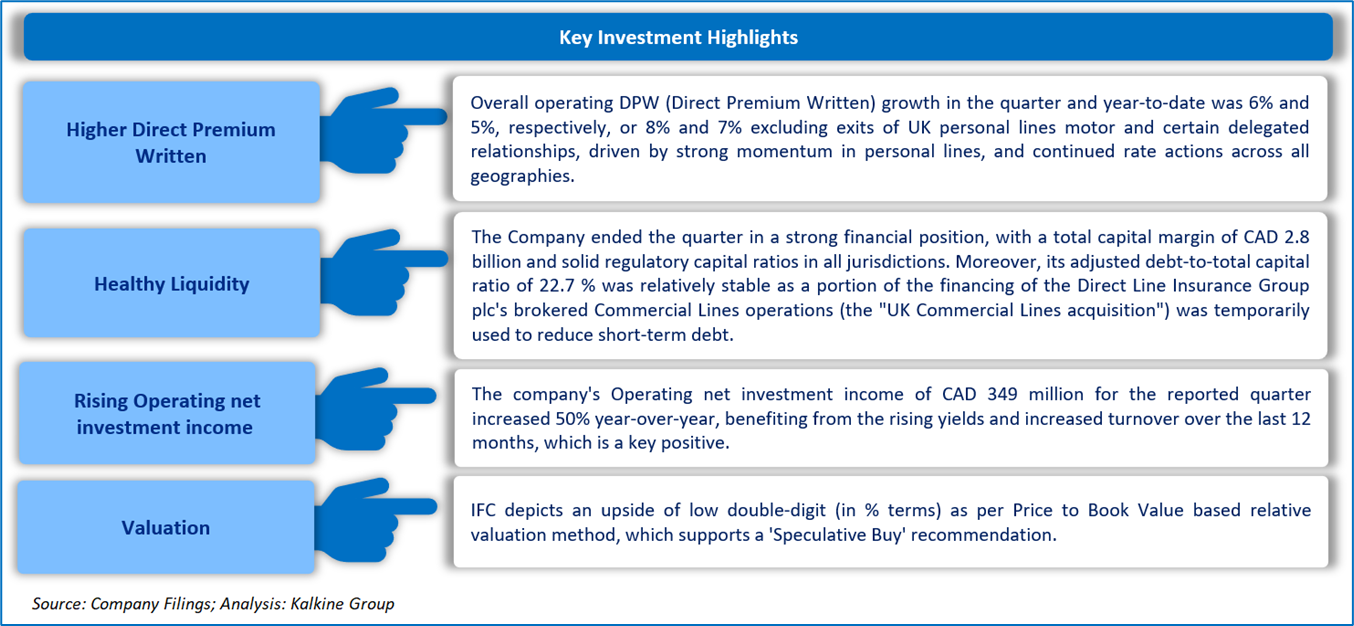
1.1 The Key Positives, Negatives, Investment Highlights, and Risks

Section2: Financial Highlights
2.1 Key Financial Highlights

Section 3: Stock Recommendation Summary
3.1 Valuation Methodology
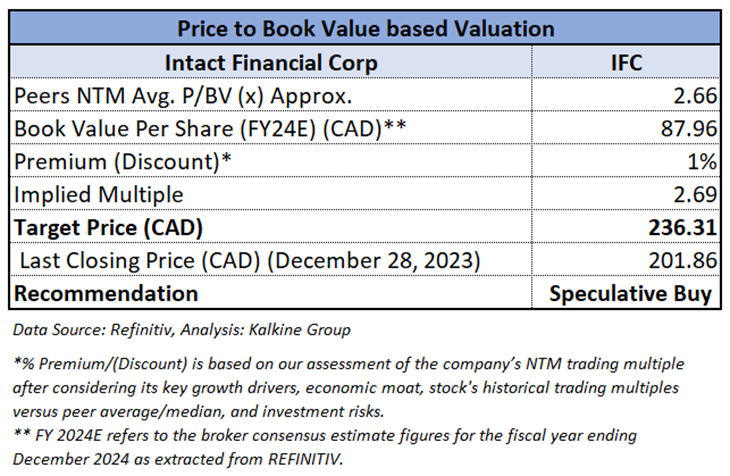
Valuation Methodology (Illustrative): Price to Book Value based.
3.2 Price Performance and Stock Recommendation

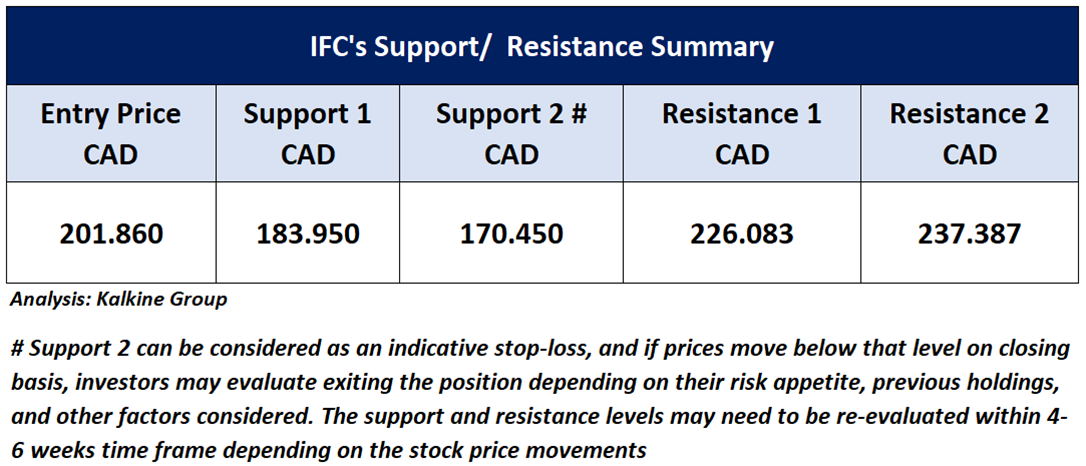
The stock has witnessed an upside of ~1.53% in 1 week and a downside of ~4.57% over the last 1 month. Moreover, the stock is trading above the average 52-week high price of CAD 214.68 and 52-week low price of CAD 182.01 providing an opportunity to ride the trend.

3.3 One-Year Technical Price Chart
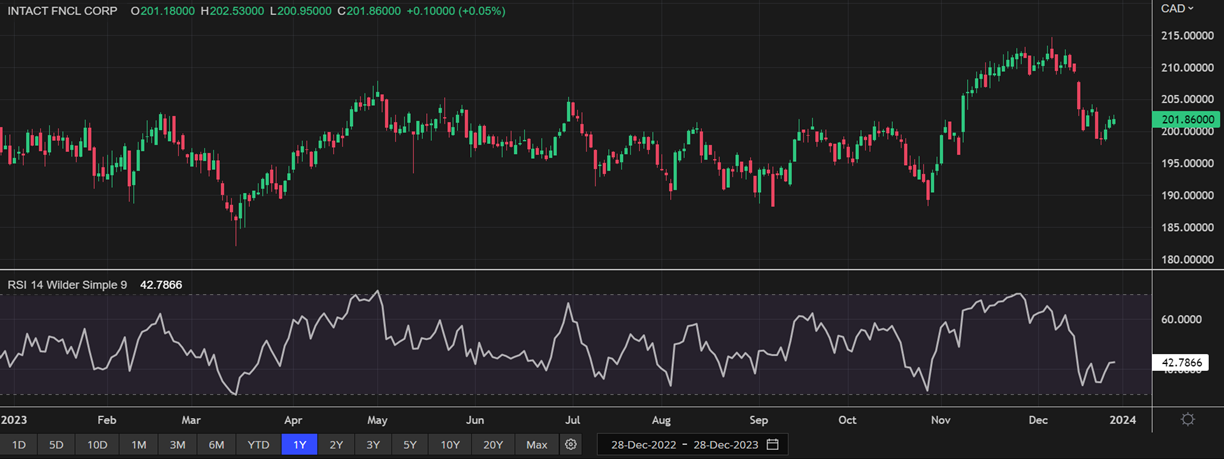
One-Year Technical Price Chart (as of December 28, 2023). Source: REFINITIV, Analysis: Kalkine Group
3.4 Technical Summary
Note 1: Past performance is not a reliable indicator of future performance.
Note 2: The reference date for all price data, currency, technical indicators, support, and resistance levels as on December 28, 2023. The reference data in this report has been partly sourced from REFINITIV.
Note 3: Investment decisions should be made depending on an individual's appetite for upside potential, risks, holding duration, and any previous holdings. An 'Exit' from the stock can be considered if the Target Price mentioned as per the Valuation and or the technical levels provided has been achieved and is subject to the factors discussed above.
Note 4: Dividend Yield may vary as per the stock price movement.
Technical Indicators Defined: -
Support: A level at which the stock prices tend to find support if they are falling, and a downtrend may take a pause backed by demand or buying interest.
Resistance: A level at which the stock prices tend to find resistance when they are rising, and the uptrend may take a pause due to profit booking or selling interest.
Stop-loss: In general, it is a level to protect further losses in case of any unfavourable movement in the stock prices.
Section1: Company Overview
Magna International (TSX: MG) prides itself on a highly entrepreneurial culture and a corporate constitution that outlines distribution of profits to various stakeholders. This automotive supplier's product groups include exteriors, interiors, seating, roof systems, body and chassis, powertrain, vision and electronic systems, closure systems, electric vehicle systems, tooling and engineering, and contracted vehicle assembly. This Report covers the Investment Highlights, Key Financial Metrics, Risks, Technical Analysis along with the Valuation, Target Price, and Recommendation on the stock.
1.1 The Key Positives, Negatives, Investment Highlights, and Risks


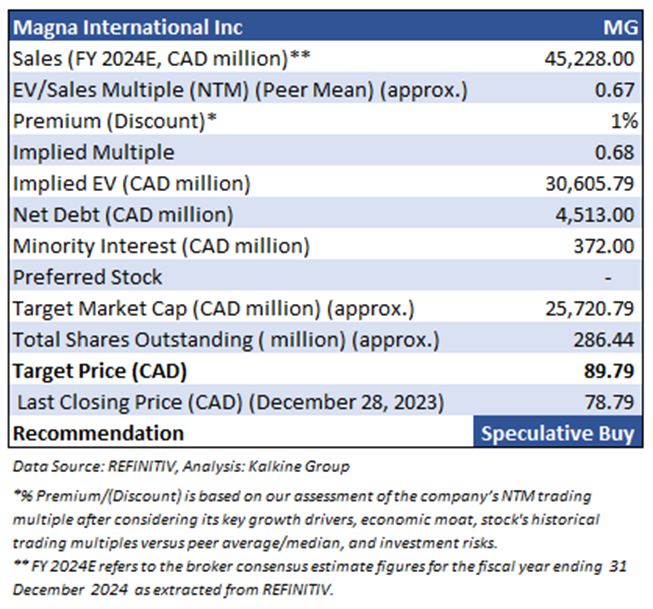
Section2: Financial Highlights
2.1 Key Financial Highlights

Section 3: Stock Recommendation Summary
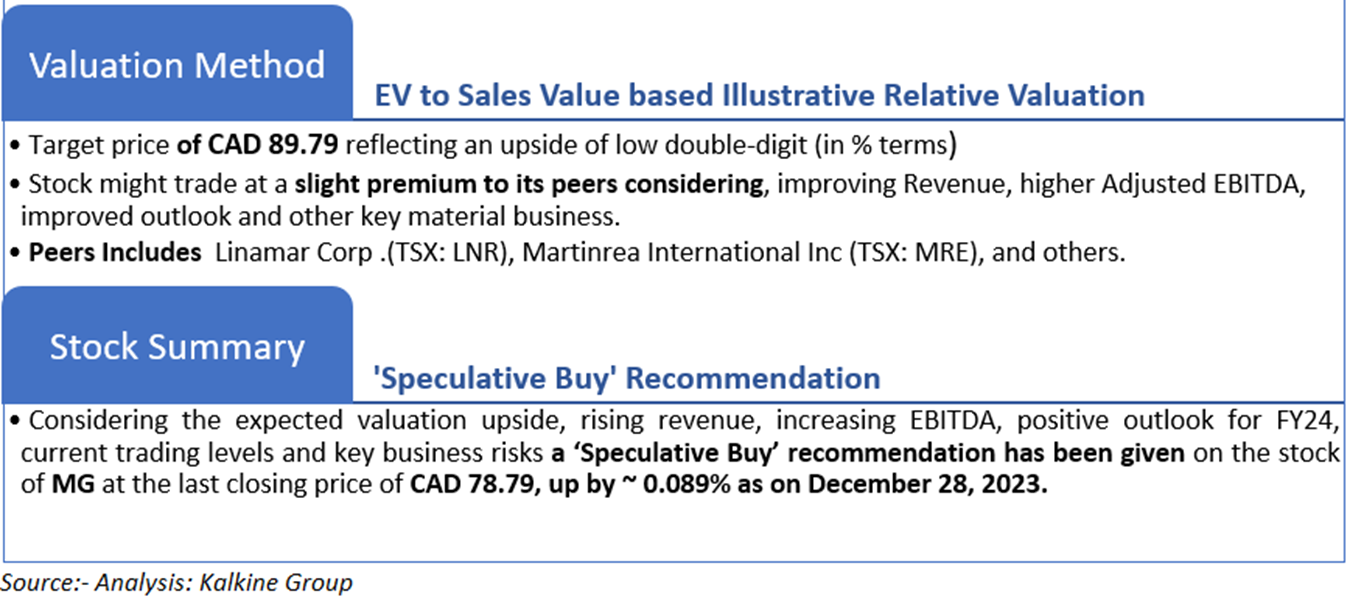
3.1 Valuation Methodology
Valuation Methodology (Illustrative): EV to Sales Value based
3.2 Price Performance and Stock Recommendation

The stock has witnessed an upside of ~7.91% and ~ 8.82% over the last 1 month and 3 months respectively. Moreover, the stock is trading below the average of 52-week high price of CAD 91.74 and 52-week low price of CAD 64.41 providing an opportunity to accumulate the stock. Magna International Inc (TSX: MG) was last covered in a report dated ‘30th August 2023’.
3.3 One-Year Technical Price Chart
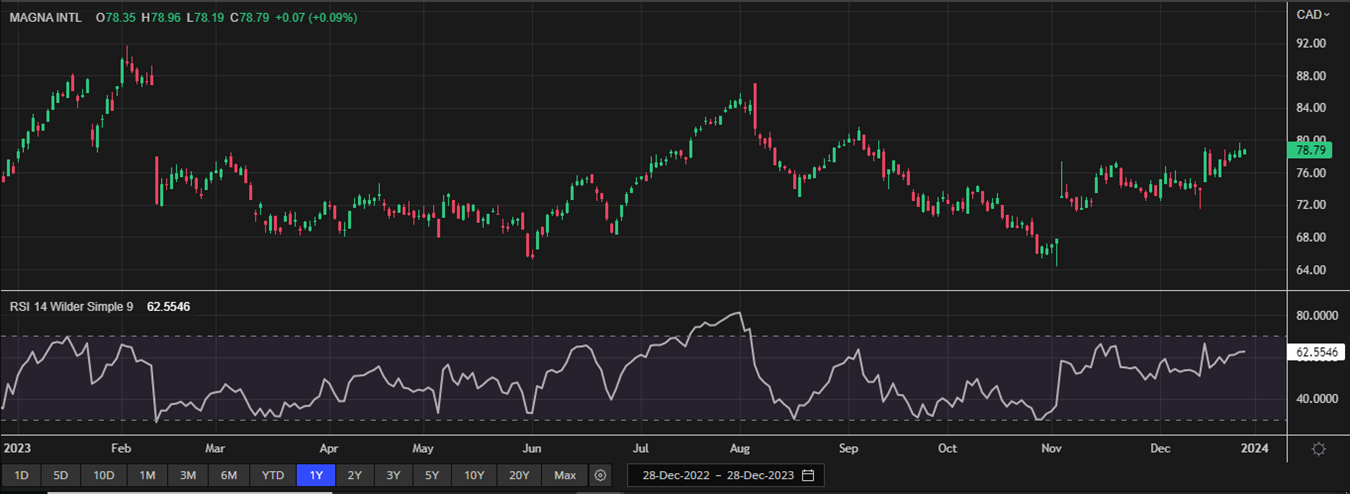
One-Year Technical Price Chart (as of December 28, 2023). Source: REFINITIV, Analysis: Kalkine Group
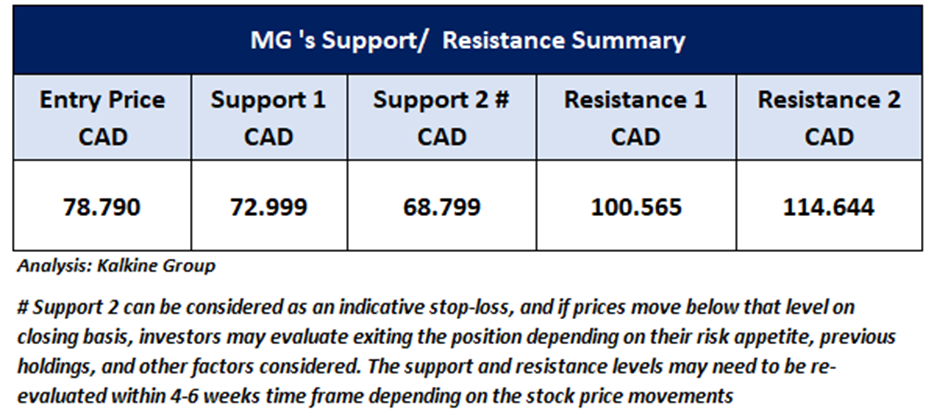
3.4 Technical Summary
Note 1: Past performance is not a reliable indicator of future performance.
Note 2: The reference date for all price data, currency, technical indicators, support, and resistance levels as on December 28, 2023. The reference data in this report has been partly sourced from REFINITIV.
Note 3: Investment decisions should be made depending on an individual's appetite for upside potential, risks, holding duration, and any previous holdings. An 'Exit' from the stock can be considered if the Target Price mentioned as per the Valuation and or the technical levels provided has been achieved and is subject to the factors discussed above.
Note 4: Dividend Yield may vary as per the stock price movement.
Technical Indicators Defined: -
Support: A level at which the stock prices tend to find support if they are falling, and a downtrend may take a pause backed by demand or buying interest.
Resistance: A level at which the stock prices tend to find resistance when they are rising, and the uptrend may take a pause due to profit booking or selling interest.
Stop-loss: In general, it is a level to protect further losses in case of any unfavourable movement in the stock prices.
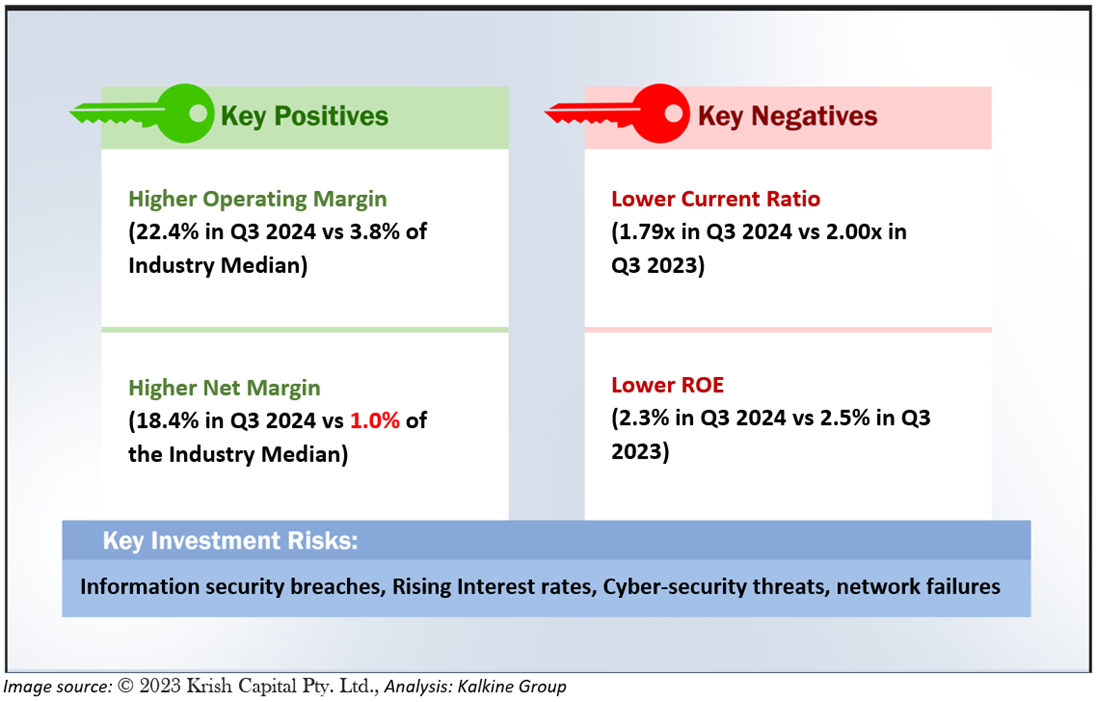
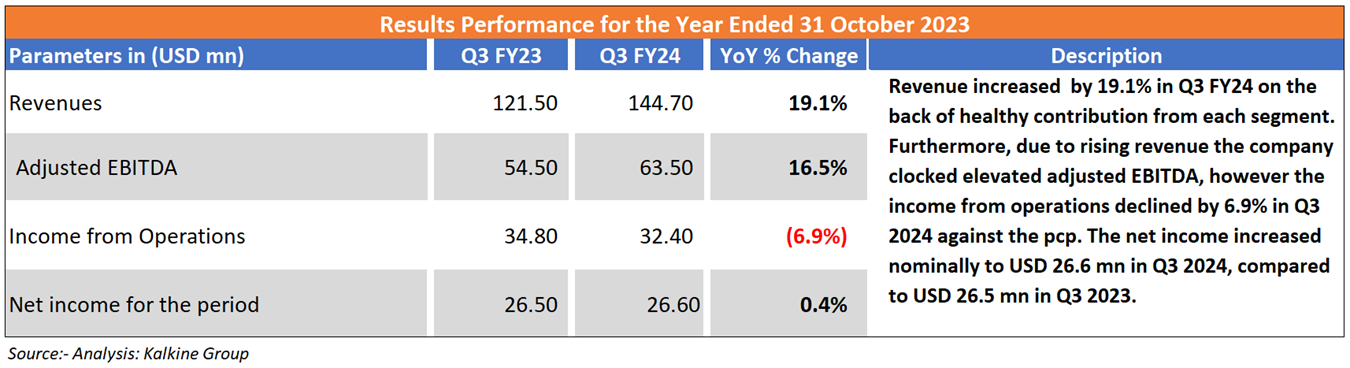
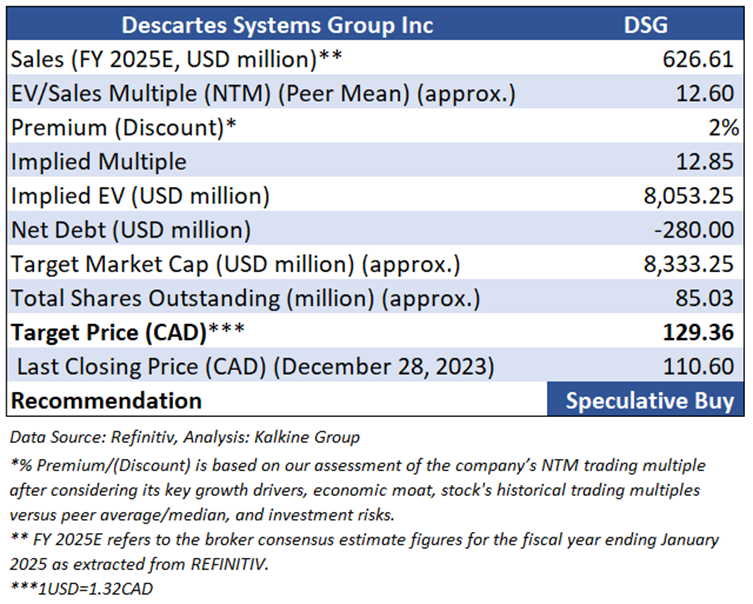
Section1: Company Overview
Descartes Systems Group (TSX: DSG) provides a software solution that allows users in the shipping industry to communicate with one another. The core product is the Global Logistics Network, which is best understood as transaction driven. Descartes charges clients to send/receive messages, data, and documents on the GLN (the transactions). This Report covers the Investment Highlights, Key Financial Metrics, Risks, Technical Analysis along with the Valuation, Target Price, and Recommendation on the stock.
1.1 The Key Positives, Negatives, Investment Highlights, and Risks
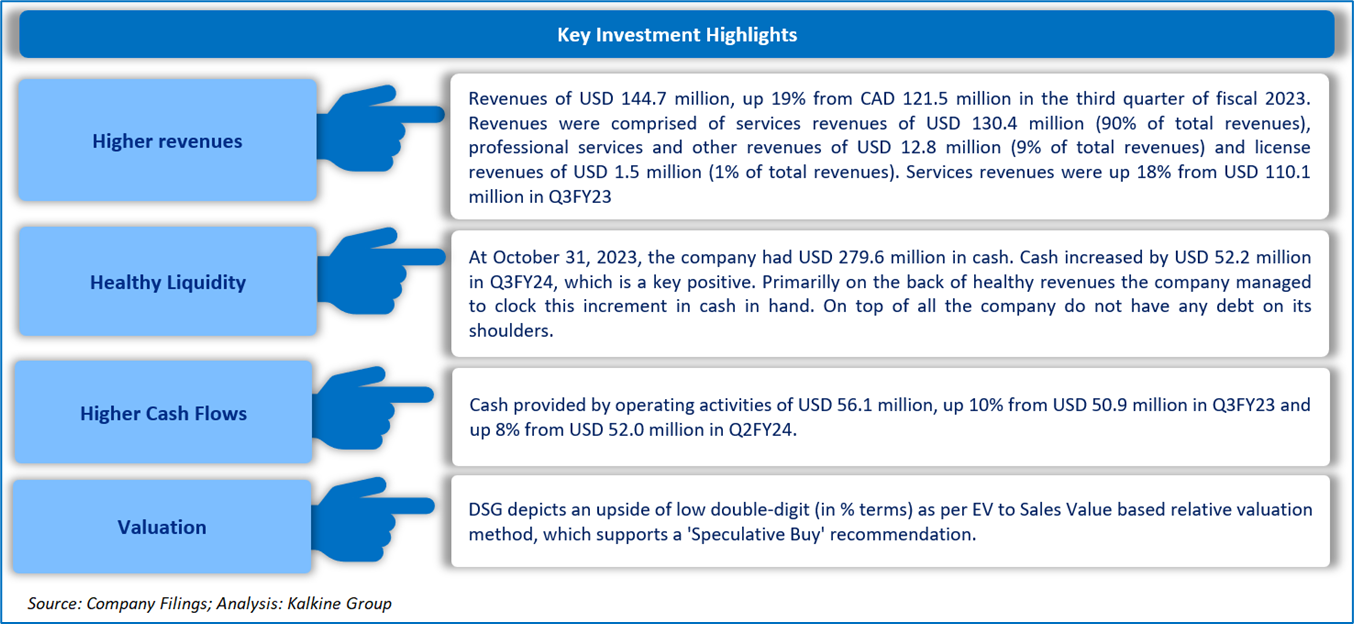
Section2: Financial Highlights
2.1 Key Financial Highlights
Section 3: Stock Recommendation Summary
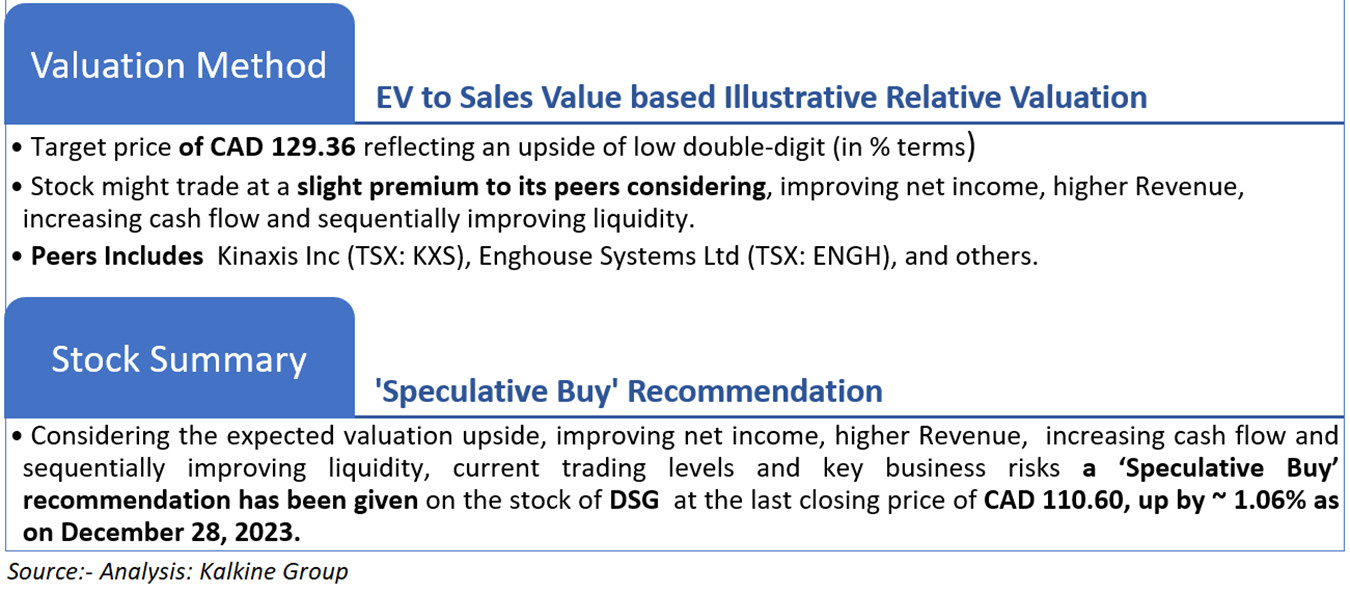
3.1 Valuation Methodology
Valuation Methodology (Illustrative): EV to Sales based.
3.2 Price Performance and Stock Recommendation

The stock has witnessed an upside of ~0.63% in 1 week and ~0.46% over the last 1 month. Moreover, the stock is trading above the average 52-week high price of CAD 116.69 and 52-week low price of CAD 90.22 providing an opportunity to ride the trend.
3.3 One-Year Technical Price Chart

One-Year Technical Price Chart (as of December 28, 2023). Source: REFINITIV, Analysis: Kalkine Group
3.4 Technical Summary
Note 1: Past performance is not a reliable indicator of future performance.
Note 2: The reference date for all price data, currency, technical indicators, support, and resistance levels as on December 28, 2023. The reference data in this report has been partly sourced from REFINITIV.
Note 3: Investment decisions should be made depending on an individual's appetite for upside potential, risks, holding duration, and any previous holdings. An 'Exit' from the stock can be considered if the Target Price mentioned as per the Valuation and or the technical levels provided has been achieved and is subject to the factors discussed above.
Note 4: Dividend Yield may vary as per the stock price movement.
Technical Indicators Defined: -
Support: A level at which the stock prices tend to find support if they are falling, and a downtrend may take a pause backed by demand or buying interest.
Resistance: A level at which the stock prices tend to find resistance when they are rising, and the uptrend may take a pause due to profit booking or selling interest.
Stop-loss: In general, it is a level to protect further losses in case of any unfavourable movement in the stock prices.

 Please wait processing your request...