First Solar, Inc.
Company Overview:
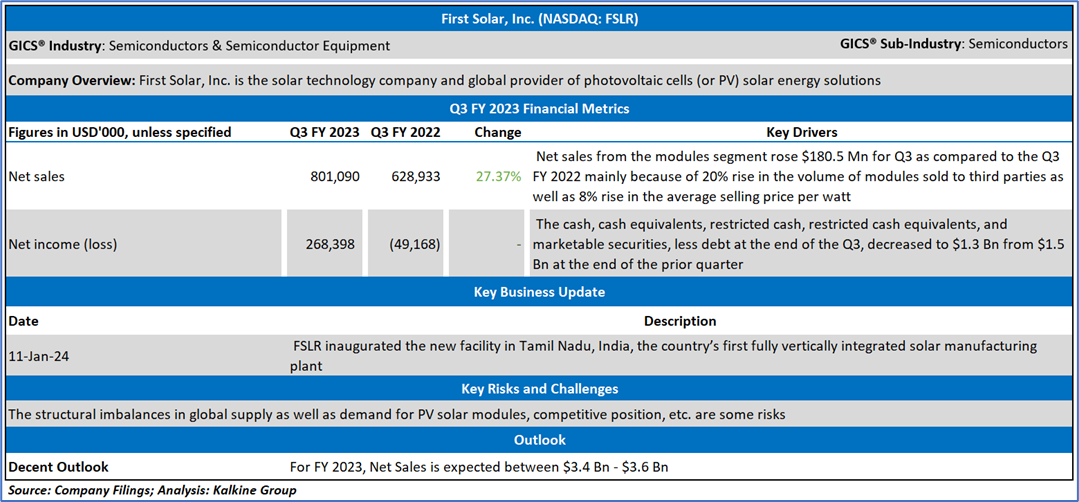
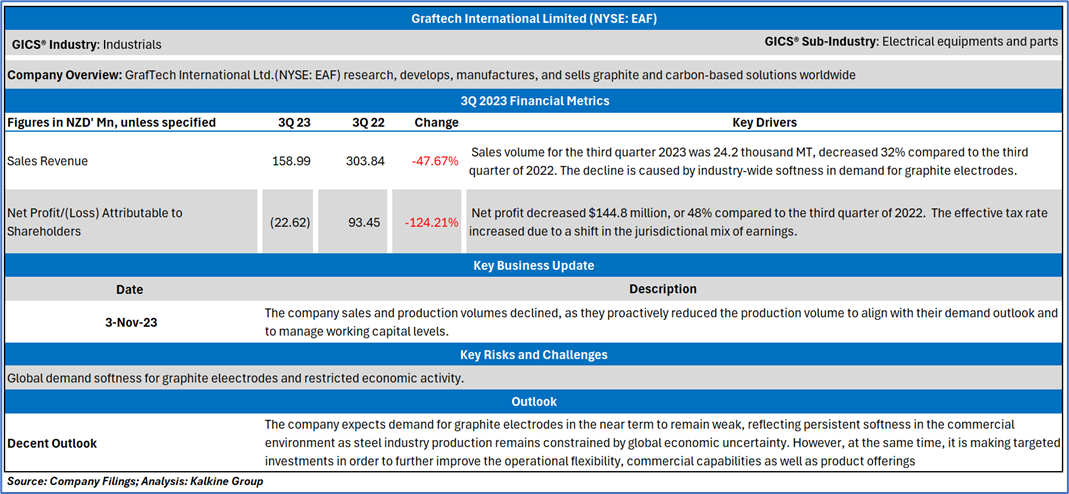
First Solar, Inc. (NASDAQ: FSLR) designs as well as manufactures solar photovoltaic panels, modules, and systems for use in utility-scale development projects. Graftech International Ltd (NYSE: EAF) researches, develops, manufactures, and sells graphite and carbon-based solutions worldwide. The company offers graphite electrodes to produce electric arc furnace steel and other ferrous and non-ferrous metals; and petroleum needle coke, a crystalline form of carbon used in the production of graphite electrodes and synthetic graphite.
Kalkine’s Daily Report covers the Investment Highlights, Key Financial Metrics, Risks, Outlook, Technical Analysis along with the Valuation, Target Price, and Recommendation on the stock.
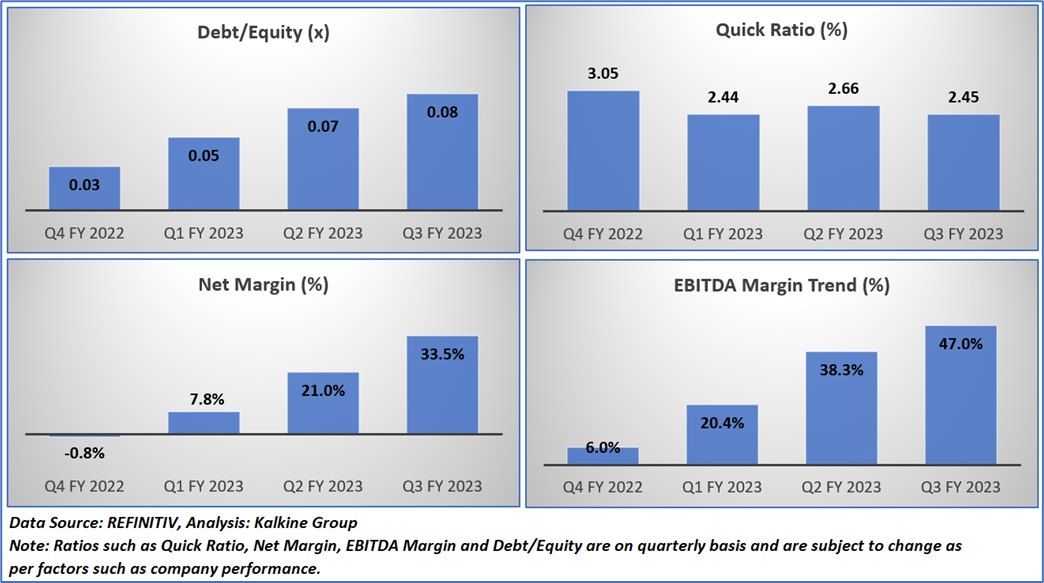
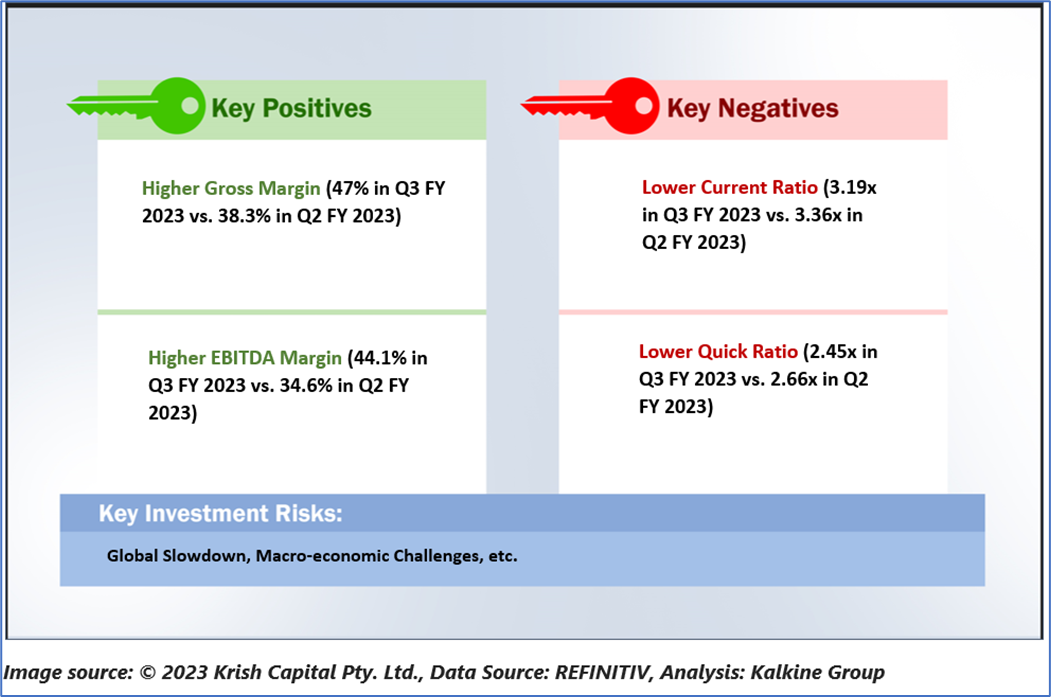
Section 1.0: Key Metrics in Pictures
Having looked at the key metrics above, the below sections provide an in-depth fundamental, and technical analysis on one Media stock along with recommendation, technical support and resistance levels and indicative stop-loss.
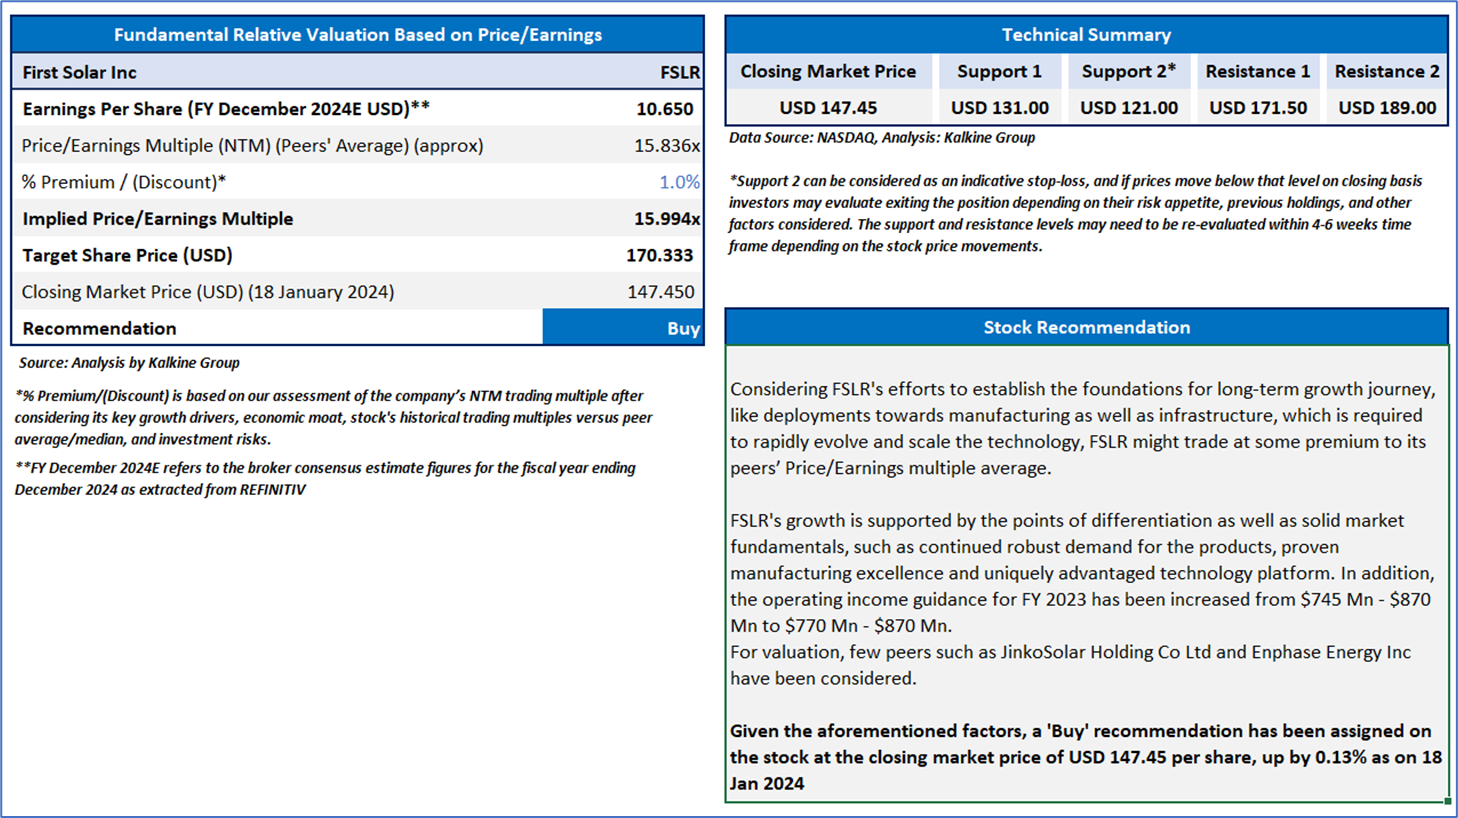
Section 2.0: First Solar, Inc. (Buy at USD 147.45 closing price as on 18th January 2024)
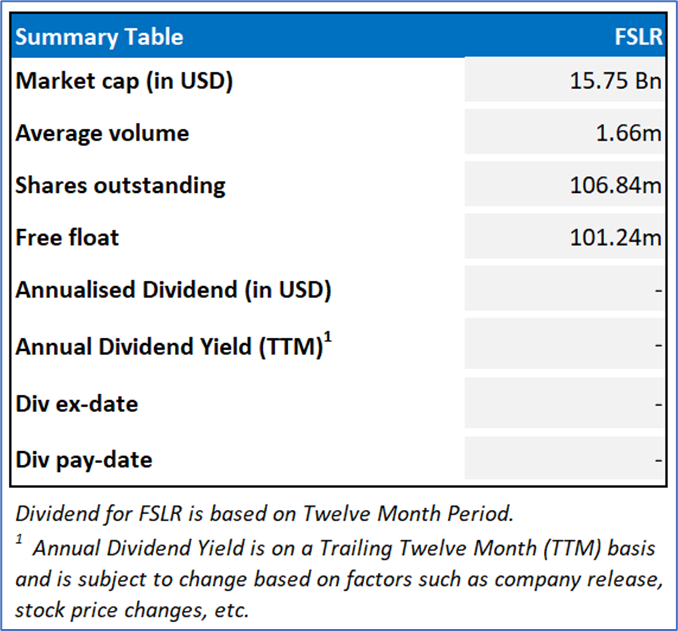
2.1 Company Details
2.2 Valuation and Technical Guidance
The stock has witnessed a fall of ~25.6% in 6 months. The stock has a 52-week low and 52-week high of USD 129.215 and USD 232, respectively.
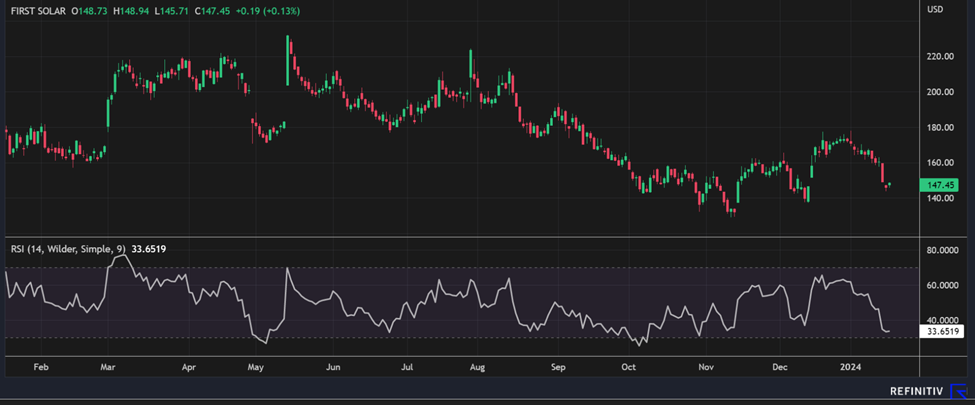
FSLR Daily Technical Chart, Data Source: REFINITIV
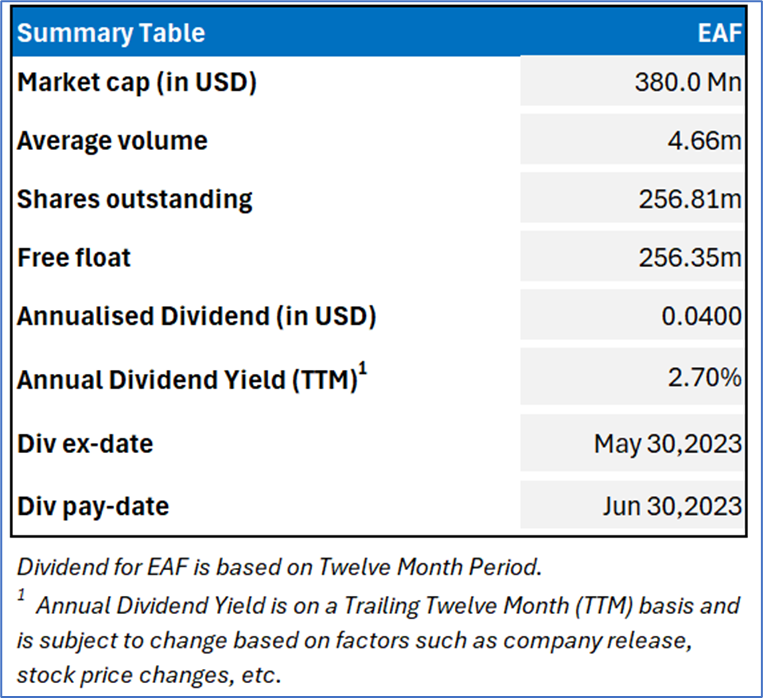
Graftech International Ltd
Section 1.0: Key Metrics in Pictures
Having looked at the key financial metrics above the below sections provide an in-depth fundamental, and technical analysis on one renewable energy stock along with recommendation, technical support and resistance levels and indicative stop-loss.
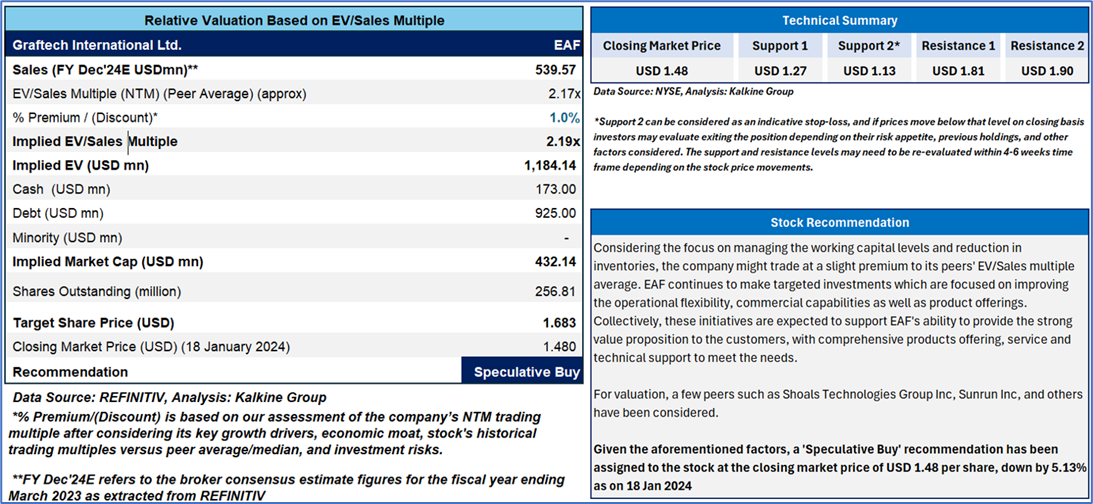
Section 2.0: Graftech International Limited (‘Speculative Buy’ at USD 1.48 closing market price as on 18th January 2024)
2.1 Company Details
2.2 Recommendation and Technical Guidance
The stock has a 52-week high and 52-week low of USD 6.74 and USD 1.53, respectively.
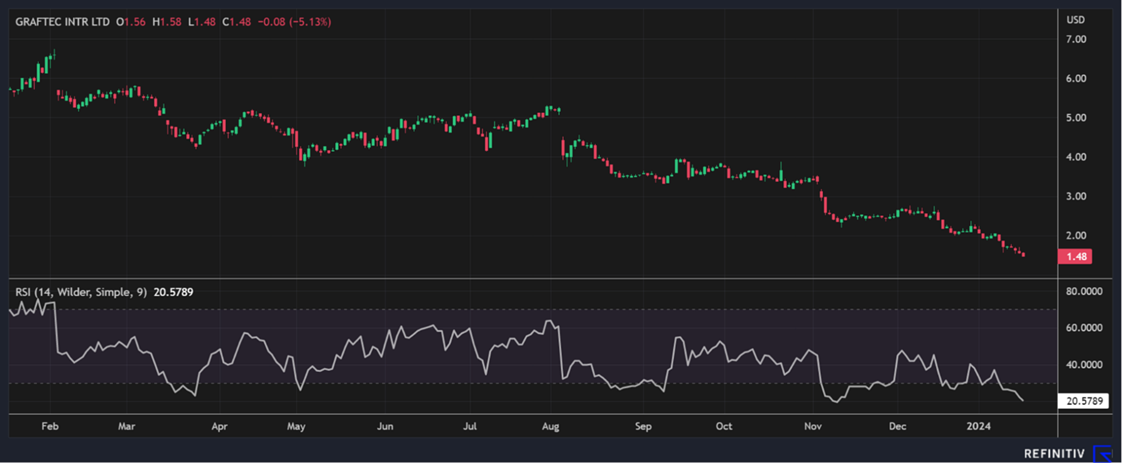 EAF Daily Technical Chart, Data Source: REFINITIV
Markets are trading in a highly volatile zone currently due to certain macro-economic issues and geopolitical tensions prevailing. Therefore, it is prudent to follow a cautious approach while investing.
Note 1: Past performance is not a reliable indicator of future performance.
Note 2: The reference date for all price data, currency, technical indicators, support, and resistance levels is January 18, 2024. The reference data in this report has been partly sourced from REFINITIV.
Note 3: Investment decisions should be made depending on an individual's appetite for upside potential, risks, holding duration, and any previous holdings. An 'Exit' from the stock can be considered if the Target Price mentioned as per the Valuation and or the technical levels provided has been achieved and is subject to the factors discussed above.
Technical Indicators Defined: -
Support: A level at which the stock prices tend to find support if they are falling, and a downtrend may take a pause backed by demand or buying interest. Support 1 refers to the nearby support level for the stock and if the price breaches the level, then Support 2 may act as the crucial support level for the stock.
Resistance: A level at which the stock prices tend to find resistance when they are rising, and an uptrend may take a pause due to profit booking or selling interest. Resistance 1 refers to the nearby resistance level for the stock and if the price surpasses the level, then Resistance 2 may act as the crucial resistance level for the stock.
Stop-loss: It is a level to protect further losses in case of unfavourable movement in the stock prices.

 Please wait processing your request...