Duos Technologies Group Inc
Duos Technologies Group, Inc., (NASDAQ: DUOT) through its wholly owned subsidiary, Duos Technologies, Inc., designs, develops, deploys, and operates intelligent vision-based technology solutions using machine vision and artificial intelligence (AI) to analyze fast moving freight, passenger and transit trains and trucks streamlining operations, improving safety, and reducing costs.
Recent Business and Financial Updates
- Second Quarter 2024 Operational Highlights: During the second quarter of 2024, the company secured a significant 5-year support services and data-sharing agreement with a Class 1 railroad valued at USD 10.9 million. This agreement ensures full data availability for seven existing client portals and introduces data from an eighth portal from a Mexican railroad, with subscription marketing initiatives planned for the third quarter of 2024. The company performed over 2.3 million comprehensive railcar scans across 13 portals, scanning 383,000 unique railcars across the U.S., Canada, and Mexico, representing approximately 24% of North America's total freight car population. Furthermore, the company installed an Edge Data Center for Amtrak and received its 10th patent, demonstrating continued innovation in the automated visual inspection of railcars. Two new subsidiaries, "Duos Edge AI" and "Duos Energy Corporation," were also formed to expand into the Edge Data Center market and address the growing demand for power to support new data centers.
- Financial Performance in Q2 2024: Total revenues for the second quarter of 2024 decreased by 15% to USD 1.51 million, compared to USD 1.77 million in the same quarter of the previous year. The revenue decrease was driven by a 38% increase in recurring services and consulting revenue, which was offset by a drop in technology systems revenue. Despite the decline in total revenues, the increase in recurring revenue highlights new AI and subscription customers, as well as increased service contract prices. However, the cost of revenues increased by 13% to USD 1.73 million, primarily due to amortization expenses. This resulted in a negative gross margin of USD 215,000, compared to USD 241,000 in the prior year.
- Operating Expenses and Net Loss: Operating expenses for Q2 2024 decreased by 11% to USD 3.00 million, attributed to reductions in development and administrative costs. However, these savings were partially offset by increased investments in sales resources. Despite efforts to reduce costs, the company's net operating loss totaled USD 3.22 million, slightly higher than the USD 3.15 million net operating loss reported in Q2 2023. The company reported a net loss of USD 3.20 million, a 7% increase compared to USD 2.99 million in the same quarter of the previous year. This increase was primarily driven by timing delays in revenue, which the company expects to recover from in the upcoming quarters.
- Six-Month Financial Overview for 2024: For the first half of 2024, total revenues decreased by 42% to USD 2.58 million, largely due to delays in delivering high-speed rail inspection portals (RIPs) for a passenger transit client. Although technology systems revenue dropped significantly, recurring services and consulting revenue increased by 19%, driven by the completion and implementation of AI detection systems. The cost of revenues decreased by 26% to USD 2.70 million due to timing delays in project work, but gross margin decreased to a negative USD 120,000 compared to USD 779,000 in the same period of 2023.
- Outlook and Future Prospects: As of the end of Q2 2024, the company reported USD 19.6 million in contract backlog, including near-term extensions and renewals, of which USD 6.9 million is expected to be recognized by the end of 2024. This backlog primarily consists of multi-year service and software agreements, with a significant portion allocated to data access supporting the new subscription business. The company anticipates that subscription business growth will be offset by royalty payments, and continued cost control measures should help mitigate future losses.
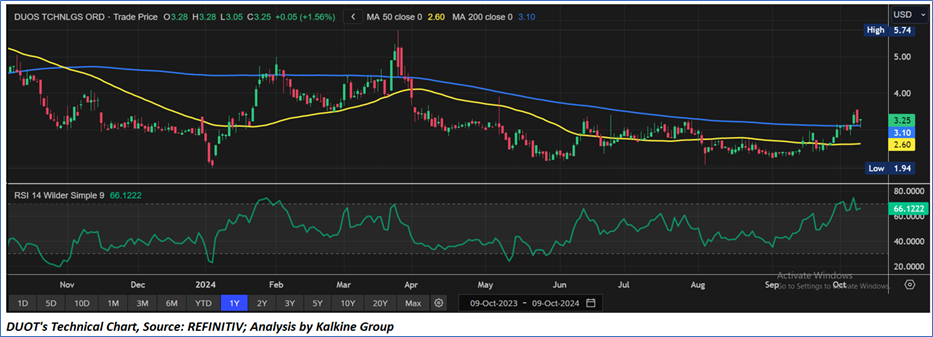
Technical Observation (on the daily chart):
The Relative Strength Index (RSI) over a 14-day period stands at a value of 66.12, currently consolidating after a correction from overbought zone, with expectations of a consolidation or an upward momentum if an important resistance of USD3.50- USD 3.80 is broken. Additionally, the stock's current positioning is above both the 50-period SMA and 200-period SMA, which may serve as dynamic short to medium-term support levels.
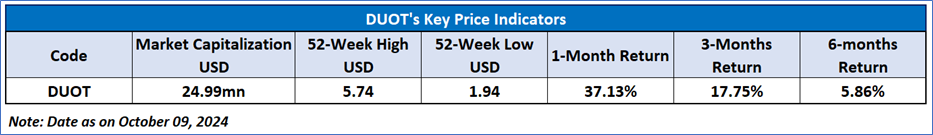
As per the above-mentioned price action, recent key business and financial updates, momentum in the stock over the last month, and technical indicators analysis, a ‘WATCH’ rating has been given to Duos Technologies Group, Inc., (NASDAQ: DUOT) at the closing market price of USD 3.25 as of October 09, 2024.
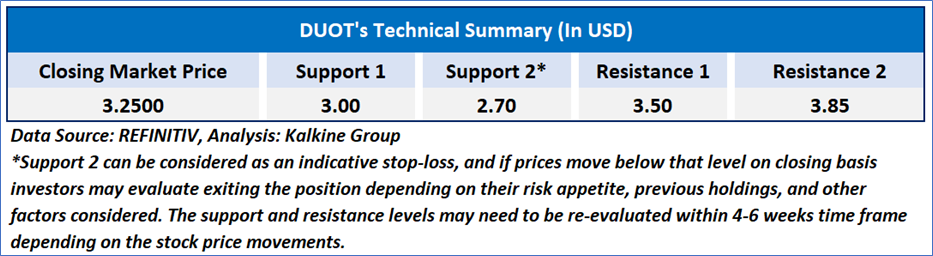
Individuals can evaluate the stock based on the support and resistance levels provided in the report in case of keen interest taking into consideration the risk-reward scenario.
Markets are trading in a highly volatile zone currently due to certain macro-economic issues and prevailing geopolitical tensions. Therefore, it is prudent to follow a cautious approach while investing.
Related Risk: This report may be looked at from a high-risk perspective and a recommendation is provided for a short duration. This report is solely based on technical parameters, and the fundamental performance of the stocks has not been considered in the decision-making process. Other factors which could impact the stock prices include market risks, regulatory risks, interest rates risks, currency risks, social and political instability risks etc.
Note 1: Past performance is not a reliable indicator of future performance.
Note 2: The reference date for all price data, currency, technical indicators, support, and resistance level is October 09, 2024. The reference data in this report has been partly sourced from REFINITIV.
Note 3: Investment decisions should be made depending on an individual's appetite for upside potential, risks, holding duration, and any previous holdings. An 'Exit' from the stock can be considered if the Target Price mentioned as per the Valuation and or the technical levels provided has been achieved and is subject to the factors discussed above.
Note 4: Target Price refers to a price level that the stock is expected to reach as per the relative valuation method and or technical analysis taking into consideration both short-term and long-term scenarios.
Note 5: ‘Kalkine reports are prepared based on the stock prices captured either from the New York Stock Exchange (NYSE), NASDAQ Capital Markets (NASDAQ), and or REFINITIV. Typically, all sources (NYSE, NASDAQ, or REFINITIV) may reflect stock prices with a delay which could be a lag of 15-20 minutes. There can be no assurance that future results or events will be consistent with the information provided in the report. The information is subject to change without any prior notice.

 Please wait processing your request...