Velocity Financial Inc
Velocity Financial Inc (NYSE: VEL) is a United States-based real estate finance company. The company primarily originates and manages investor loans secured by 1–4-unit residential rental and small commercial properties. The company earns revenue in the form of interest income. It operates in New York, California, Florida, New Jersey, and other states.
Recent Business and Financial Updates
- Net Income and Earnings Performance: The company reported a net income of USD 14.7 million for the second quarter of 2024 (2Q24), reflecting a 21.3% increase from USD 12.2 million in the second quarter of 2023 (2Q23). Diluted earnings per share (EPS) rose to USD 0.42, up USD 0.06 from USD 0.36 per share in 2Q23. Core net income stood at USD 15.9 million, marking a 23.1% increase compared to USD 12.9 million in 2Q23. Core diluted EPS increased to USD 0.45 per share from USD 0.38 per share in the previous year. These improvements were driven by higher loan production volumes, growth in net interest income, and successful loan resolution activities.
- Loan Production and Securitization Activity: Loan production for 2Q24 amounted to USD 422.2 million in unpaid principal balance (UPB), representing an 11.5% increase from the first quarter of 2024 (1Q24) and a 63.2% increase from 2Q23. The company completed two significant securitizations—VCC 2024-2 and VCC 2024-3—resulting in the issuance of USD 286.2 million and USD 204.6 million in securities, respectively. However, these securitizations led to a USD 0.06 per share reduction in EPS due to additional issuance costs. Additionally, Century Health & Housing Capital, LLC acquired USD 3.6 million in mortgage servicing rights (MSRs), tied to USD 227.6 million in commercial GNMA mortgages.
- Portfolio Performance and Margins: The company’s total loan portfolio stood at USD 4.5 billion in UPB as of June 30, 2024, reflecting a 20.4% increase from USD 3.7 billion in UPB as of June 30, 2023. Growth was driven by a 20.3% rise in loans collateralized by Investor 1-4 Rental properties and a 36.9% increase in loans secured by “Other” commercial properties. The portfolio's net interest margin (NIM) improved to 3.54%, up 30 basis points (bps) from 3.24% in 2Q23, supported by higher yields on loans, with recent loan production generating average coupons exceeding 11.0%.
- Nonperforming Loans and Credit Quality: Nonperforming loans (NPL) totaled USD 470.6 million in UPB as of June 30, 2024, representing 10.5% of loans held for investment (HFI), compared to 10.0% in 2Q23. This increase was primarily due to a rise in foreclosures. Charge-offs for 2Q24 totaled USD 244.6 thousand, down from USD 716.6 thousand in 2Q23. The loan loss reserve increased by 13.3% year-over-year to USD 5.2 million, reflecting an expansion in the individually assessed component of the CECL reserve. Loans held for sale or carried at fair value are not subject to the CECL reserve.
- Revenue Growth and Operating Income: Net revenue for 2Q24 was USD 54.8 million, a 41.3% increase from USD 38.7 million in 2Q23. This growth was primarily driven by higher loan production volumes and the company's focus on maintaining spreads with loan origination rates at 11.0%. Total net interest income, inclusive of corporate debt interest expense and loan loss provisions, reached USD 32.2 million, marking a 28.7% year-over-year increase. Portfolio net interest income was USD 38.6 million, reflecting a 31.0% increase, while total other operating income rose to USD 22.6 million in 2Q24, up from USD 14.0 million in 2Q23.
- Nonperforming Loan Resolutions: During 2Q24, the company resolved USD 80.7 million in UPB of nonperforming loans, realizing 101.3% of UPB resolved. This compares to resolutions of USD 50.1 million in UPB and a 103.0% realization in 2Q23. The loan resolutions for 2Q24 accounted for 18.7% of nonperforming loans as of March 31, 2024. These resolutions align with the company's five-quarter resolution average of USD 64.4 million in UPB, with an average realization rate of 102.0%. The company’s ability to resolve NPLs successfully continues to contribute positively to its financial performance.
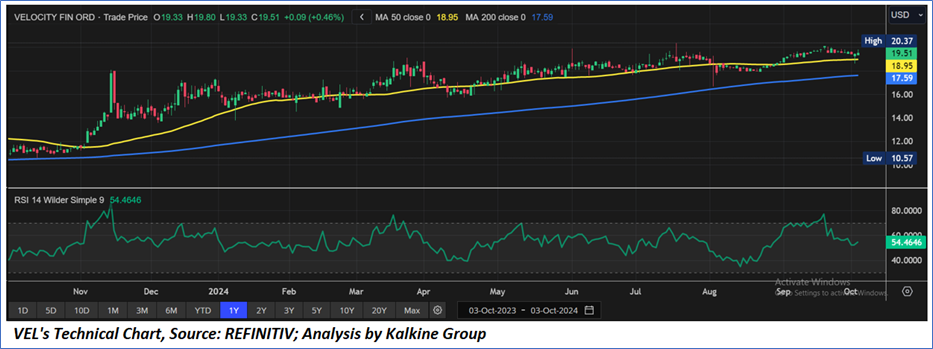
Technical Observation (on the daily chart):
The Relative Strength Index (RSI) over a 14-day period stands at a value of 54.46, currently downward trending, with expectations of a consolidation or an upward momentum in case the price breaks an important resistance of USD 20-USD 20.50. Additionally, the stock's current positioning is above both the 50-period SMA and 200-period SMA, which may serve as dynamic short to medium-term support levels.

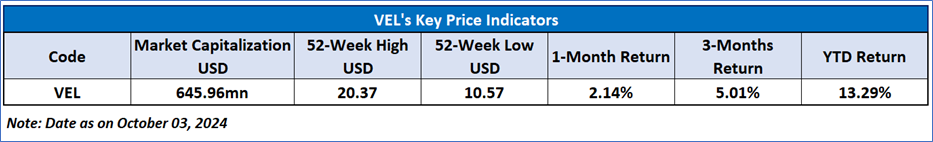
As per the above-mentioned price action, recent key business and financial updates, momentum in the stock over the last month, and technical indicators analysis, a ‘Watch’ rating has been given to Velocity Financial Inc (NYSE: VEL) at the closing market price of USD 19.51 as of October 03, 2024.
Individuals can evaluate the stock based on the support and resistance levels provided in the report in case of keen interest taking into consideration the risk-reward scenario.
Markets are trading in a highly volatile zone currently due to certain macro-economic issues and prevailing geopolitical tensions. Therefore, it is prudent to follow a cautious approach while investing.
Related Risk: This report may be looked at from a high-risk perspective and a recommendation is provided for a short duration. This report is solely based on technical parameters, and the fundamental performance of the stocks has not been considered in the decision-making process. Other factors which could impact the stock prices include market risks, regulatory risks, interest rates risks, currency risks, social and political instability risks etc.
Note 1: Past performance is not a reliable indicator of future performance.
Note 2: The reference date for all price data, currency, technical indicators, support, and resistance level is October 03, 2024. The reference data in this report has been partly sourced from REFINITIV.
Note 3: Investment decisions should be made depending on an individual's appetite for upside potential, risks, holding duration, and any previous holdings. An 'Exit' from the stock can be considered if the Target Price mentioned as per the Valuation and or the technical levels provided has been achieved and is subject to the factors discussed above.
Note 4: Target Price refers to a price level that the stock is expected to reach as per the relative valuation method and or technical analysis taking into consideration both short-term and long-term scenarios.
Note 5: ‘Kalkine reports are prepared based on the stock prices captured either from the New York Stock Exchange (NYSE), NASDAQ Capital Markets (NASDAQ), and or REFINITIV. Typically, all sources (NYSE, NASDAQ, or REFINITIV) may reflect stock prices with a delay which could be a lag of 15-20 minutes. There can be no assurance that future results or events will be consistent with the information provided in the report. The information is subject to change without any prior notice.

 Please wait processing your request...