Section 1: Company Overview, Shariah Compliance Standards and Fundamentals
Section 1.1: Advanced Micro Devices, Inc. (NASDAQ: AMD) is a global semiconductor company. The Company is focused on high-performance computing, graphics and visualization technologies. Its segments include Data Center, Client and Gaming, and Embedded. Data Center segment includes artificial intelligence (AI) accelerators, microprocessors (CPUs) for servers, graphics processing units (GPUs), accelerated processing units (APUs), data processing units (DPUs), Field Programmable Gate Arrays (FPGAs), smart network interface Cards (SmartNICs) and Adaptive system-on-Chip (SoC) products for data centers.
Kalkine’s ‘The Shariah Compliance Report’ covers the Investment Highlights, Shariah-compliance standards, Key Financial Metrics, Risks, and Technical Analysis along with the Valuation, Target Price, and Recommendation on the stock.

Section 1.2: What are the Key Metrics for Shariah Compliance to be Considered?
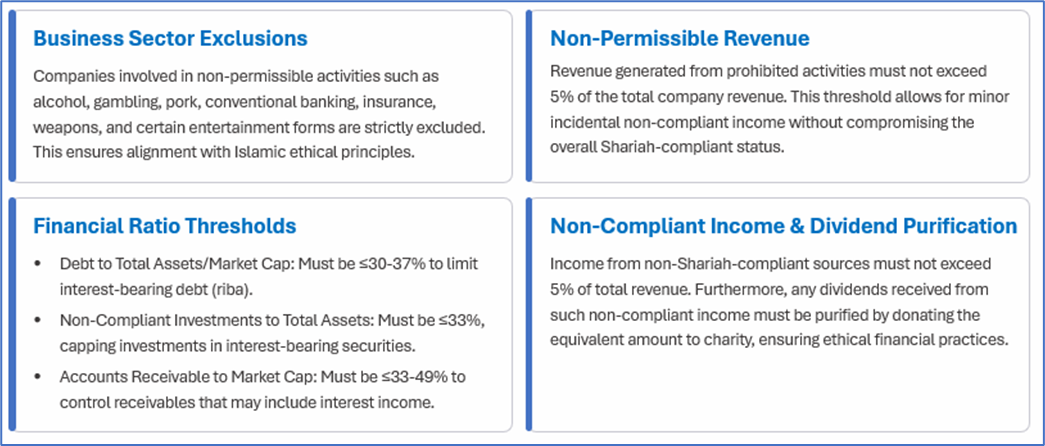
The Shariah Compliance Report aims to identify equities that align with Shariah and ethical principles, providing valuable insights on financial metrics, business activities and compliance with Islamic finance norms.
Key Shariah Screening Criteria and Thresholds
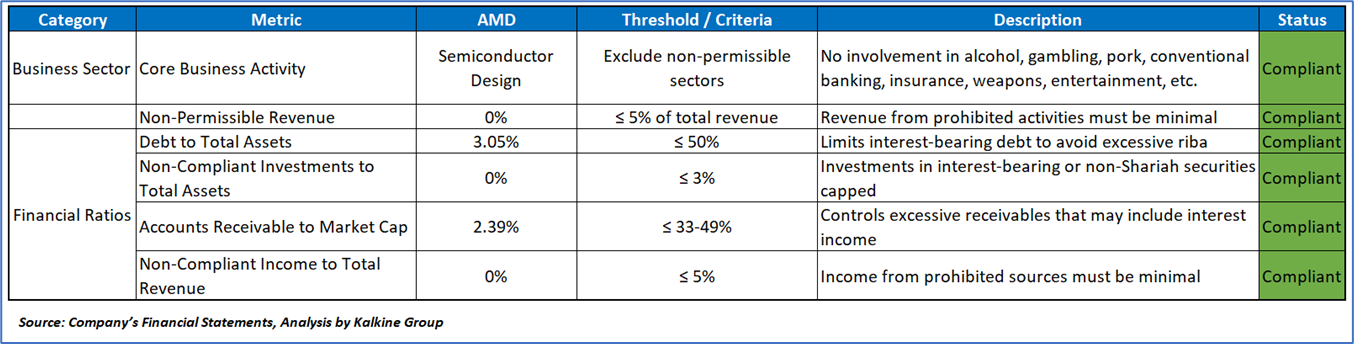
Shariah Metrics for Advanced Micro Devices Inc (NASDAQ: AMD):
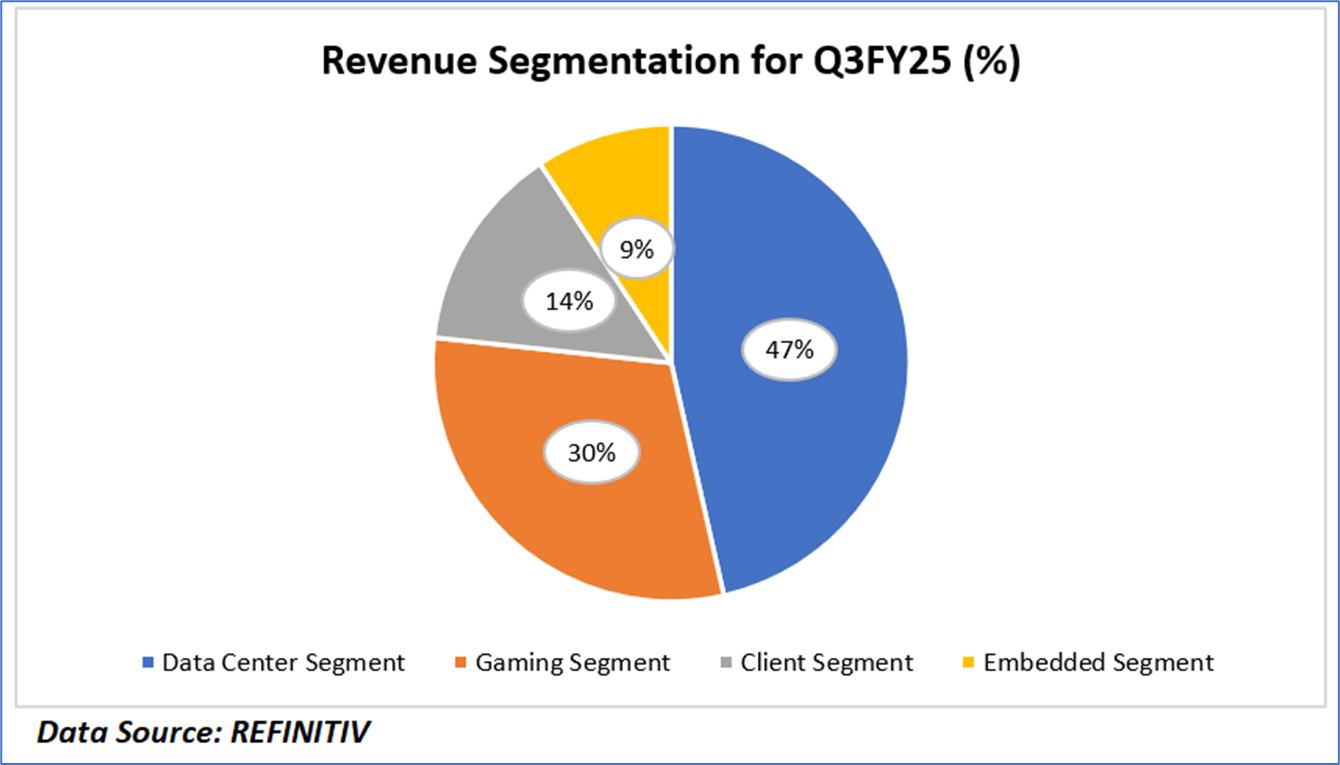
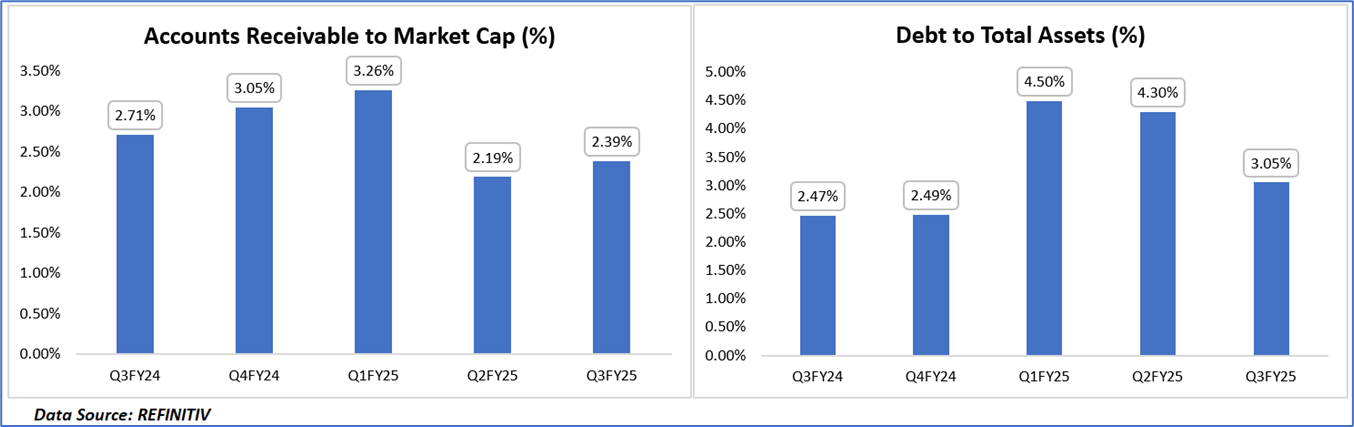
Revenue Segmentation of AMD in Q3FY25 & Historical Compliance of Financial Ratios:
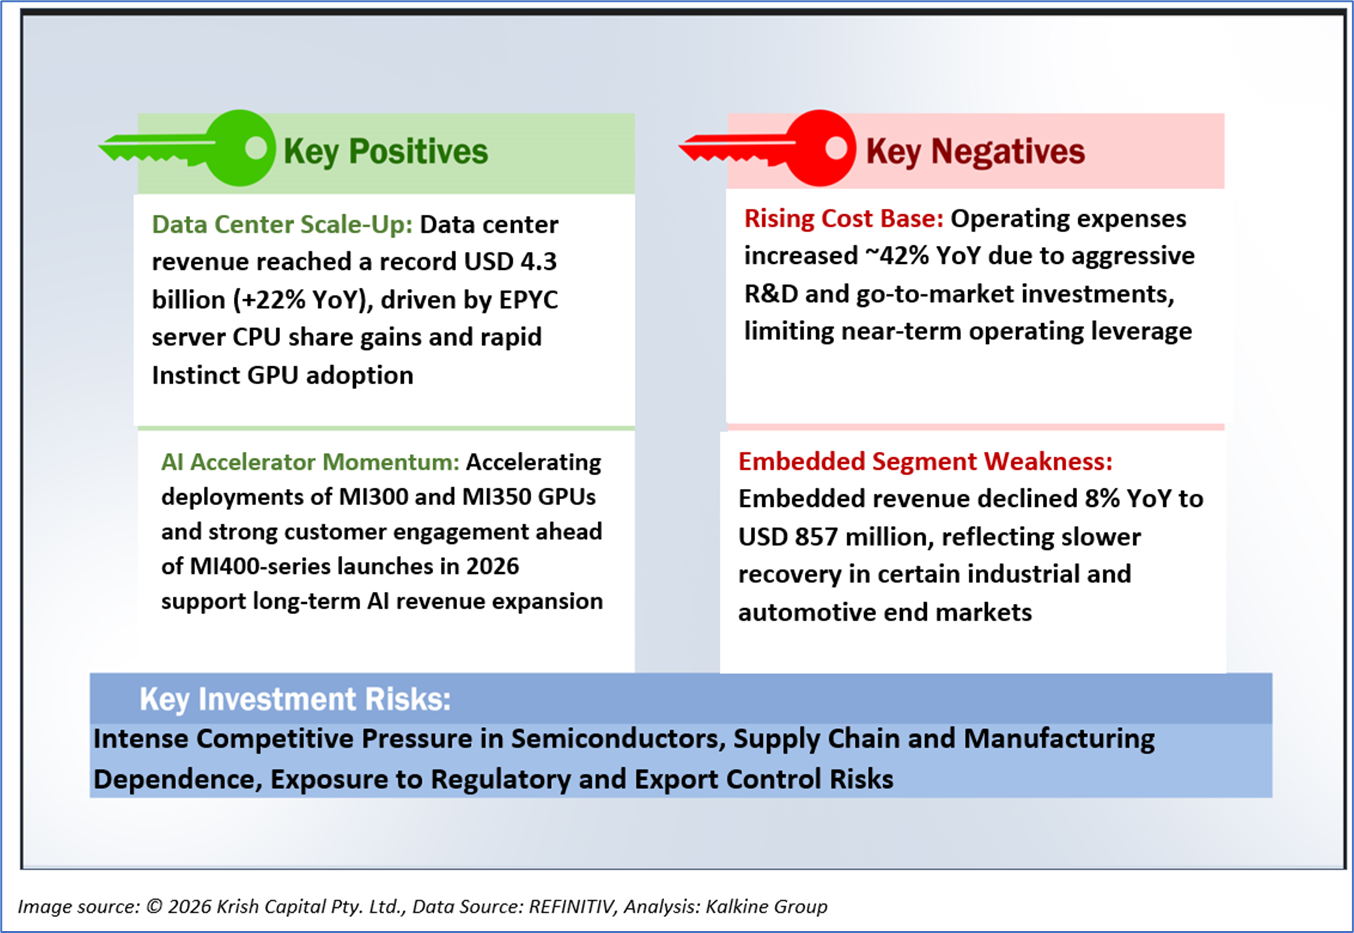
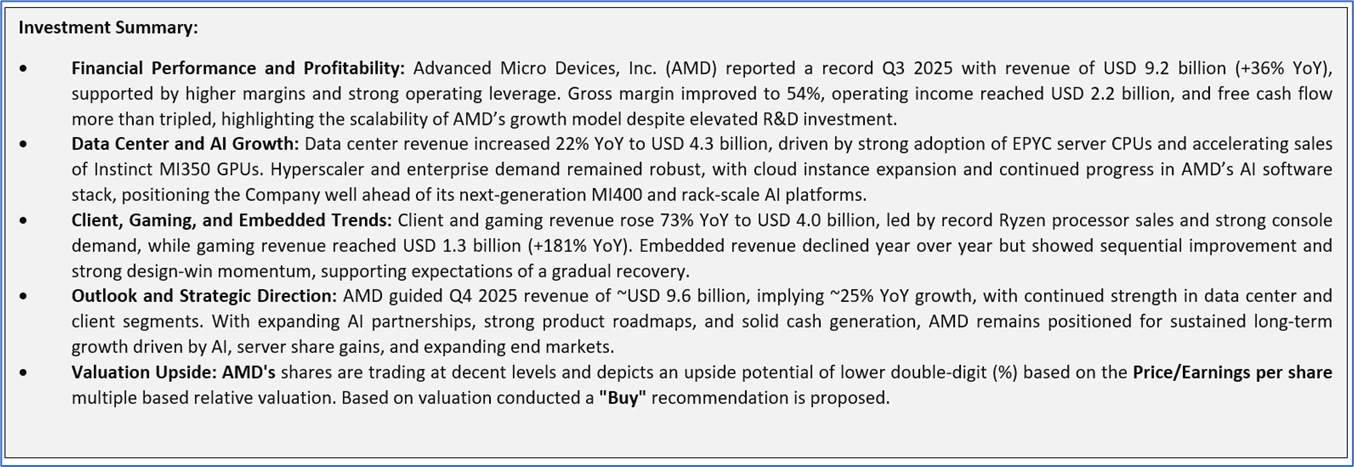
1.3 The Key Positives, Negatives, and Investment summary
1.4 Top 10 shareholders:
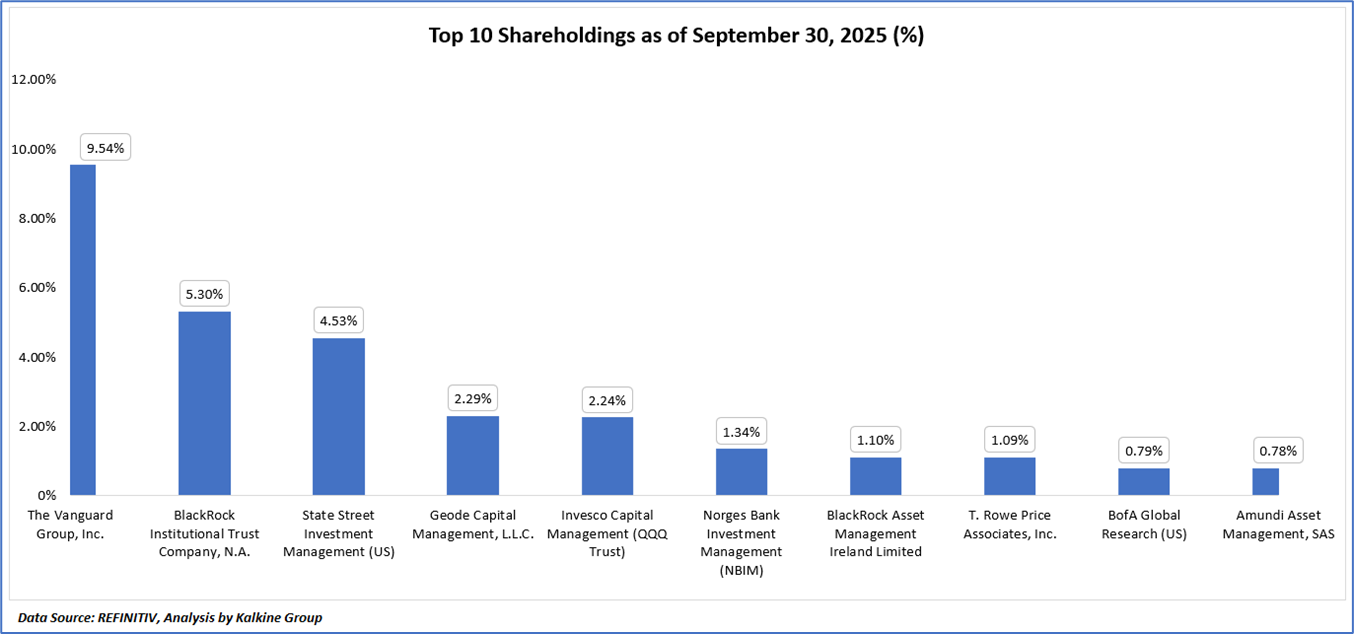
The top 10 shareholders together form ~29.13% of the total shareholding, signifying concentrated shareholding. The Vanguard Group, Inc., and BlackRock Institutional Trust Company, N.A. are the biggest shareholders, holding the maximum stake in the company at ~9.49% and ~5.33%, respectively.
1.5 Key Metrics:
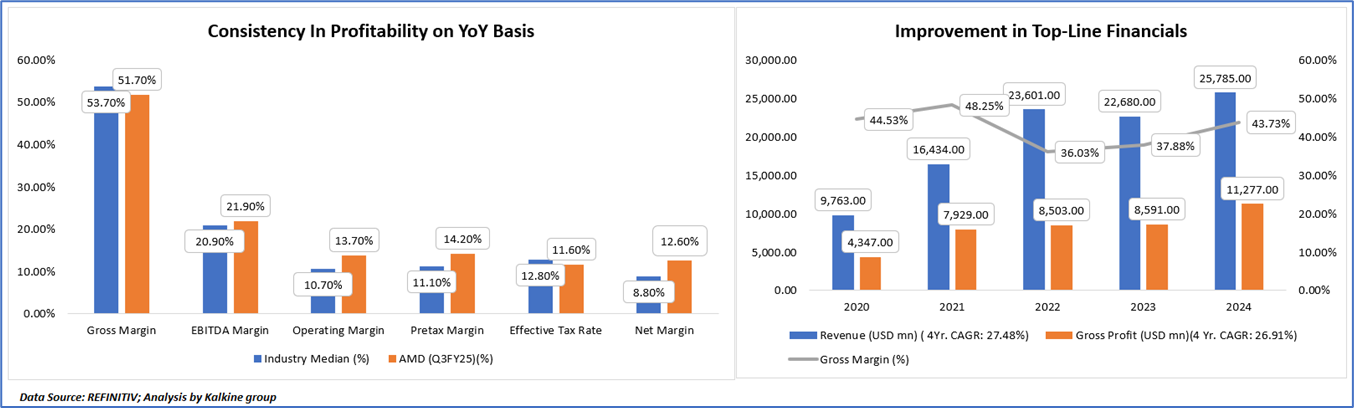
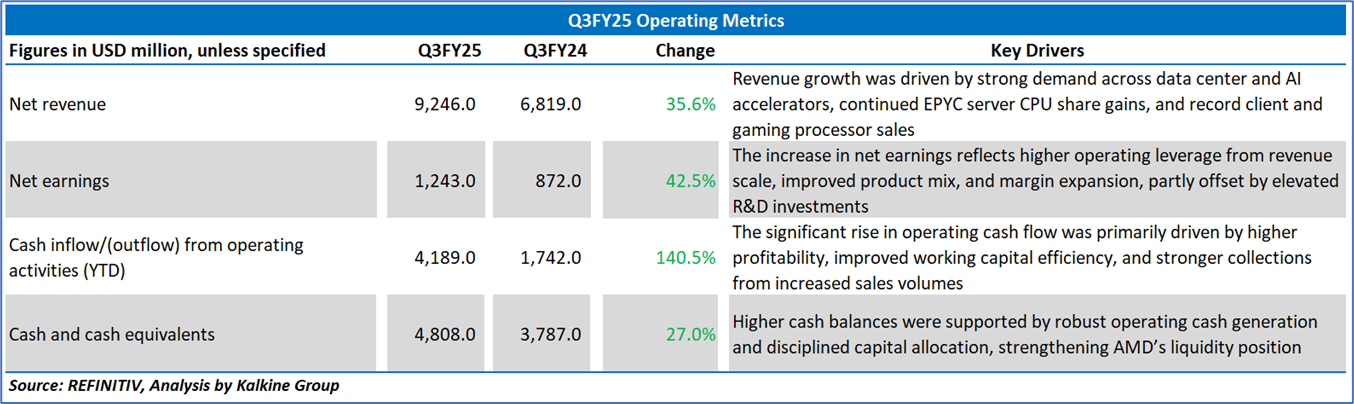
AMD’s top line has compounded at ~27% over the last four years (USD 9.8B → 25.8B), with gross profit compounding ~27% as well. After a margin trough in 2022 (GM 36.0% amid PC destocking/Xilinx integration), gross margin recovered to 43.7% in 2024 as mix skewed toward higher-ASP EPYC/Ryzen. Q2 FY25 revenue rose 32% YoY to ~USD 7.7B on record EPYC/Ryzen and strong semi-custom, consistent with management’s guide to a further step-up in Q3 on MI350 accelerators and continued CPU share gains.
Advanced Micro Devices, Inc. (AMD) exhibited a generally stronger profitability profile than the industry median in Q3 FY2025, despite a modestly lower gross margin of 51.7% versus the industry’s 53.7%, reflecting a product mix skewed toward rapidly scaling AI and data center solutions with elevated upfront costs. This margin gap was more than offset at lower levels of the income statement, with EBITDA margin of 21.9%, operating margin of 13.7%, and pretax margin of 14.2%, all meaningfully exceeding industry medians, underscoring superior operating leverage, cost discipline, and scale benefits. A comparatively lower effective tax rate of 11.6% further enhanced profitability, resulting in a net margin of 12.6%, well above the industry benchmark of 8.8%. Overall, the margin structure highlights AMD’s ability to translate revenue growth into superior bottom-line performance, even while continuing to invest aggressively in AI, R&D, and go-to-market initiatives.
Section 2: Business Updates and Financial Highlights
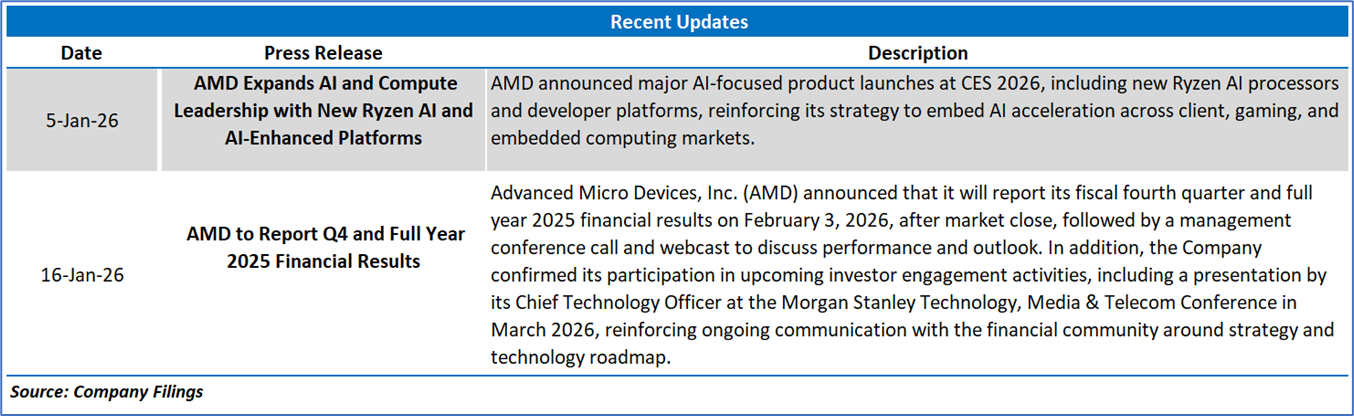
2.1 Recent Updates:
The below picture gives an overview of the recent updates:
2.2 Insights of Q3FY25:
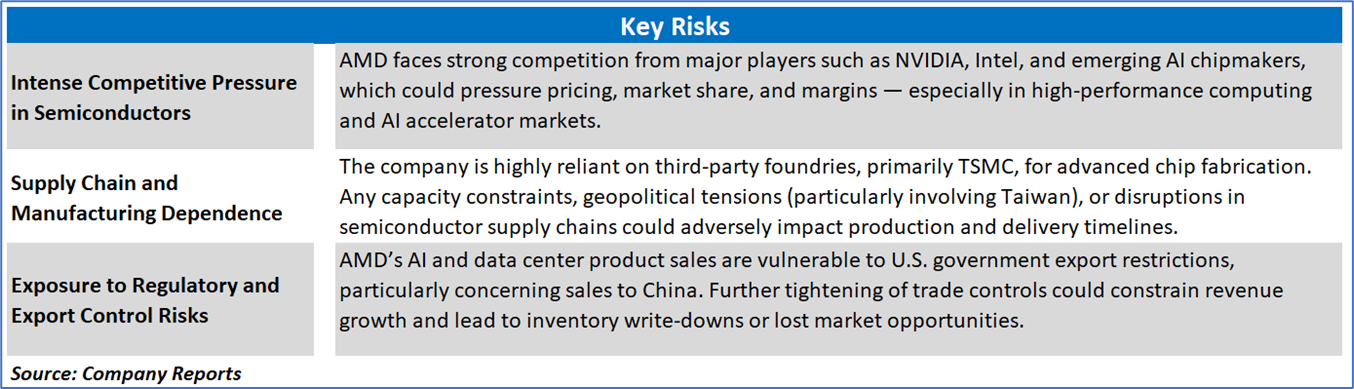
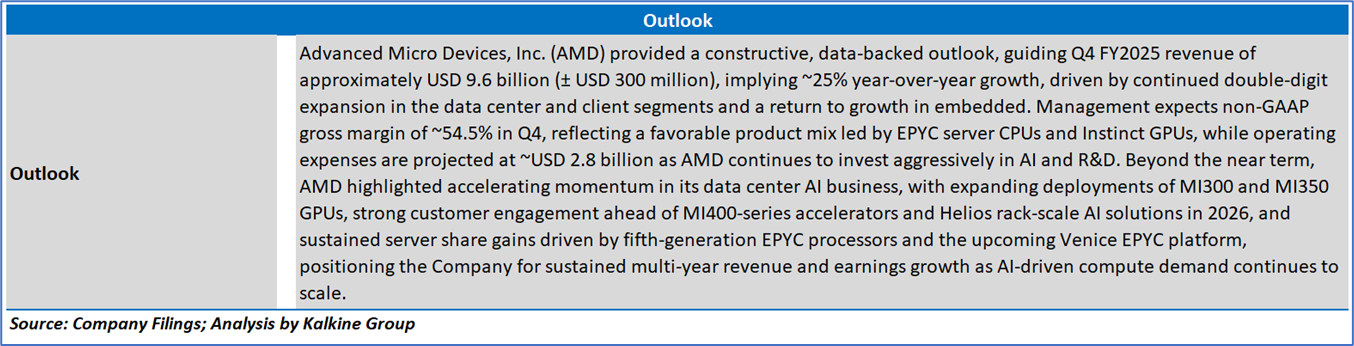
Section 3: Key Risks and Outlook:
Section 4: Stock Recommendation Summary:
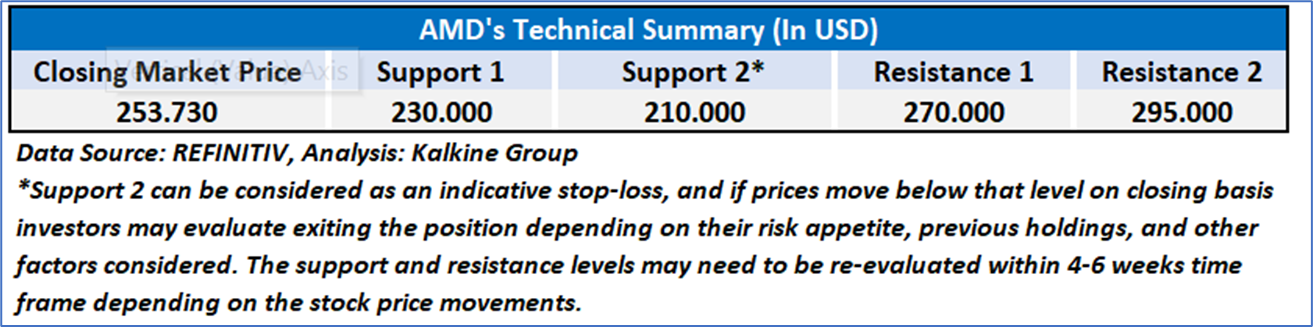
4.1 Technical Summary:
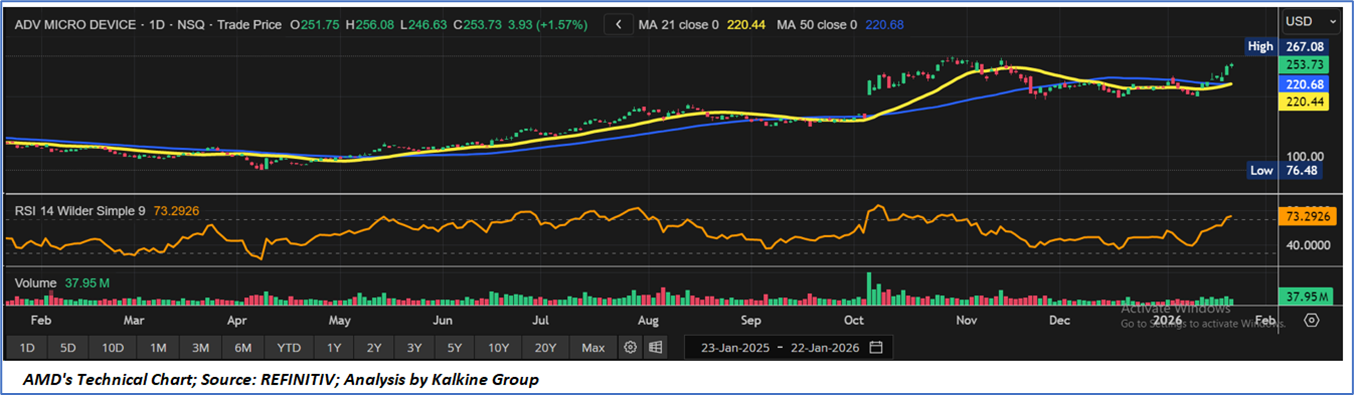
- Trend Structure and Moving Averages: Advanced Micro Devices, Inc. (AMD) remains in a clear primary uptrend, with price holding firmly above the rising 21-day and 50-day moving averages. Recent pullbacks have been orderly and corrective in nature, indicating consolidation within an ongoing bullish trend rather than a structural reversal.
- Momentum and Relative Strength: The RSI remains elevated in the low-70s, reflecting strong momentum and sustained buying interest. Although technically overbought, the lack of meaningful bearish divergence suggests that upside momentum remains intact, with any near-term weakness more likely to manifest as consolidation rather than a trend breakdown.
- Volume and Technical Outlook: Volume behavior continues to support the prevailing uptrend, with stronger participation on advances and lighter turnover during pullbacks. Overall, the technical bias remains positive, contingent on price sustaining above key moving-average support levels, with a failure to do so potentially signaling a shift toward a broader consolidation phase.
4.2 Fundamental Valuation
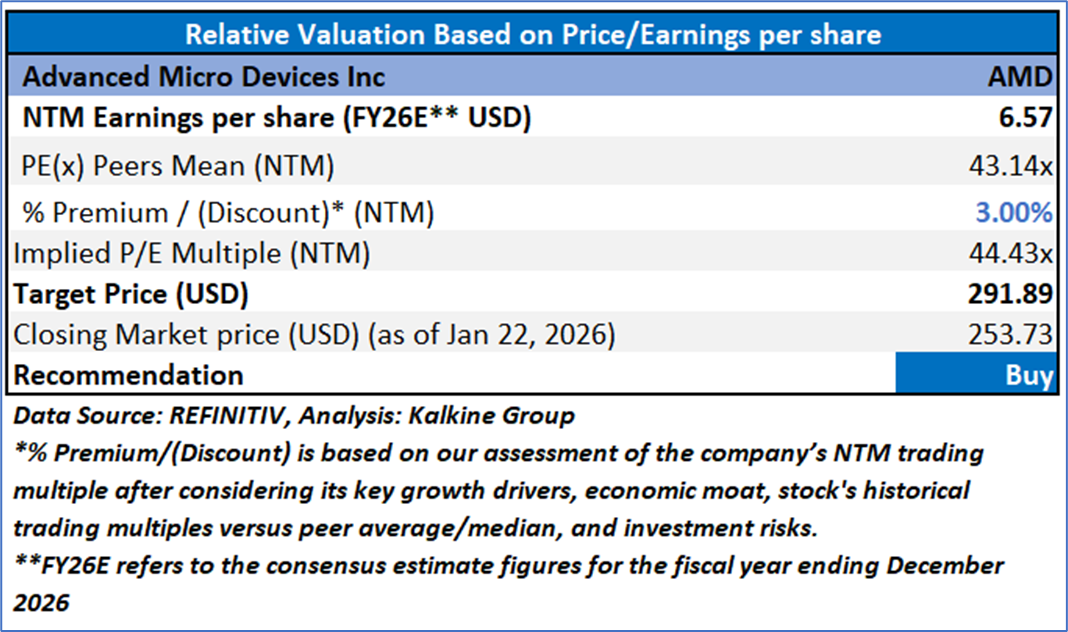
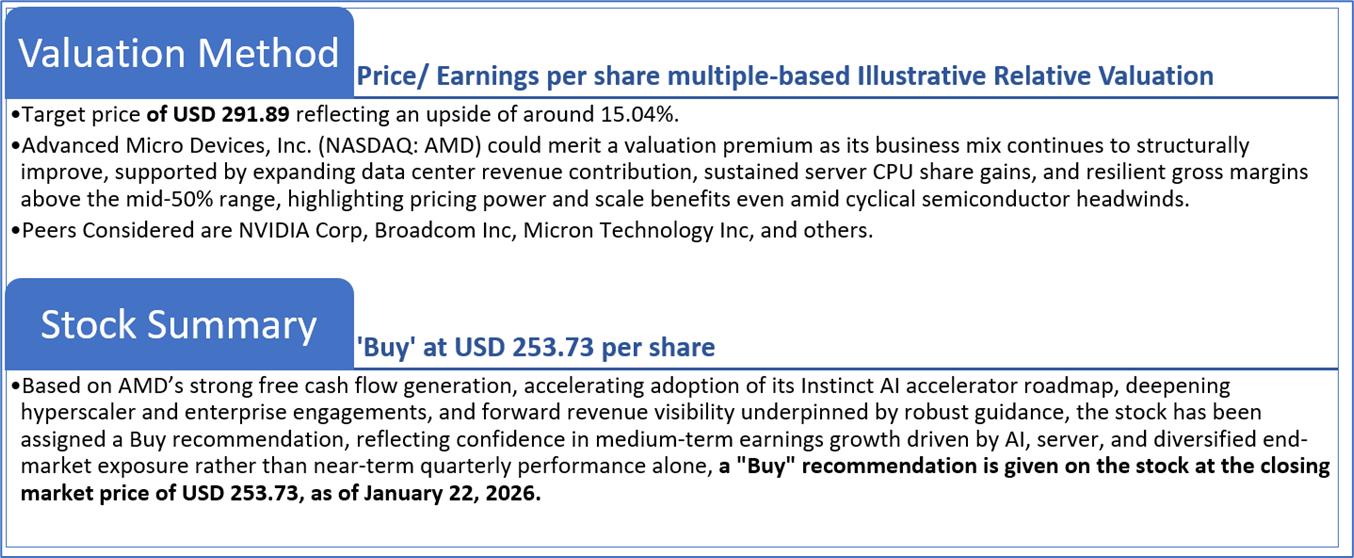
Valuation Methodology: Price/Earnings Per Share Multiple Based Relative Valuation
Markets are trading in a highly volatile zone currently due to certain macroeconomic issues and geopolitical tensions prevailing. Therefore, it is prudent to follow a cautious approach while investing.
Note 1: Past performance is not a reliable indicator of future performance.
Note 2: The reference date for all price data, currency, technical indicators, support, and resistance levels is January 22, 2026. The reference data in this report has been partly sourced from REFINITIV.
Note 3: Investment decisions should be made depending on an individual's appetite for upside potential, risks, holding duration, and any previous holdings. An 'Exit' from the stock can be considered if the Target Price mentioned as per the Valuation and or the technical levels provided have been achieved and is subject to the factors discussed above.
Note 4: The report publishing date is as per the Pacific Time Zone.
Technical Indicators Defined: -
Support: A level at which the stock prices tend to find support if they are falling, and a downtrend may take a pause backed by demand or buying interest. Support 1 refers to the nearby support level for the stock and if the price breaches the level, then Support 2 may act as the crucial support level for the stock.
Resistance: A level at which the stock prices tend to find resistance when they are rising, and an uptrend may take a pause due to profit booking or selling interest. Resistance 1 refers to the nearby resistance level for the stock and if the price surpasses the level, then Resistance 2 may act as the crucial resistance level for the stock.
Stop-loss: It is a level to protect against further losses in case of unfavorable movement in the stock prices.
Past performance is not a reliable indicator of future performance.

 NZ
 UK
 US
 AU
 IND

 CA

 Please wait processing your request...