Section 1: Company Overview and Fundamentals
1.1 Company Overview:
Palantir Technologies Inc (NASDAQ: PLTR) develops advanced software platforms that enable organizations to integrate, analyze, and act on complex data for operational and decision-making purposes. Its core offerings—Gotham, Foundry, Apollo, and AIP—support applications across government and commercial sectors, combining data integration, analytics, and artificial intelligence to enhance efficiency, insights, and real-time decision-making.
Kalkine’s Diversified Opportunities Report covers the Company Overview, Key positives & negatives, Investment summary, Key investment metrics, Top 10 shareholding, Business updates and insights into company recent financial results, Key Risks & Outlook, Price performance and technical summary, Target Price, and Recommendation on the stock.
Stock Performance:
- The stock shows a prior uptrend followed by a broad consolidation phase since late 2025, with price oscillating within a range rather than making sustained higher highs.
- Price is currently trading around the 20-day and 50-day moving averages, indicating a lack of strong directional momentum and a neutral near-term trend. The flattening of both averages suggests consolidation.
- RSI is around 51, indicating neutral momentum with no clear overbought or oversold conditions, suggesting the stock may continue to trade sideways in the near term.
- Volume remains relatively stable with occasional spikes, indicating participation but no strong conviction-driven move yet.
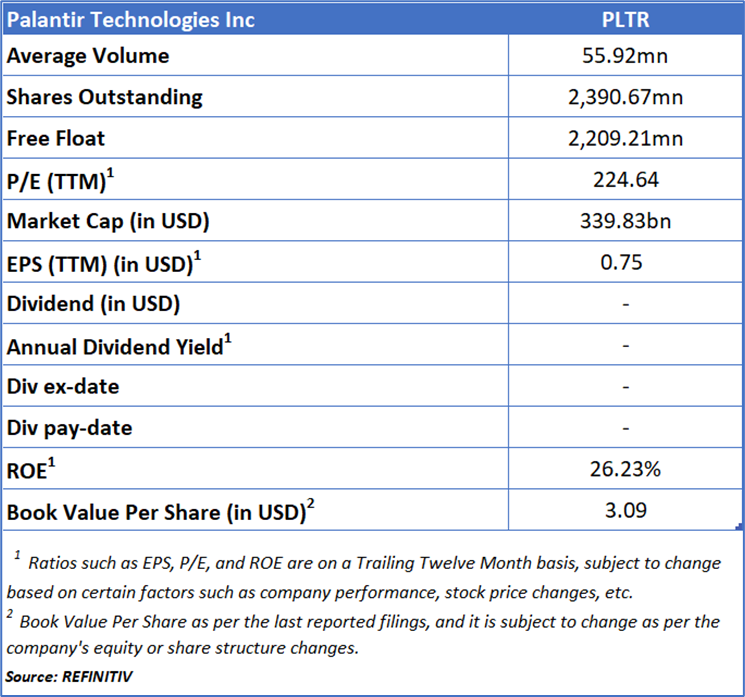
1.2 The Key Positives, Negatives, and Investment summary
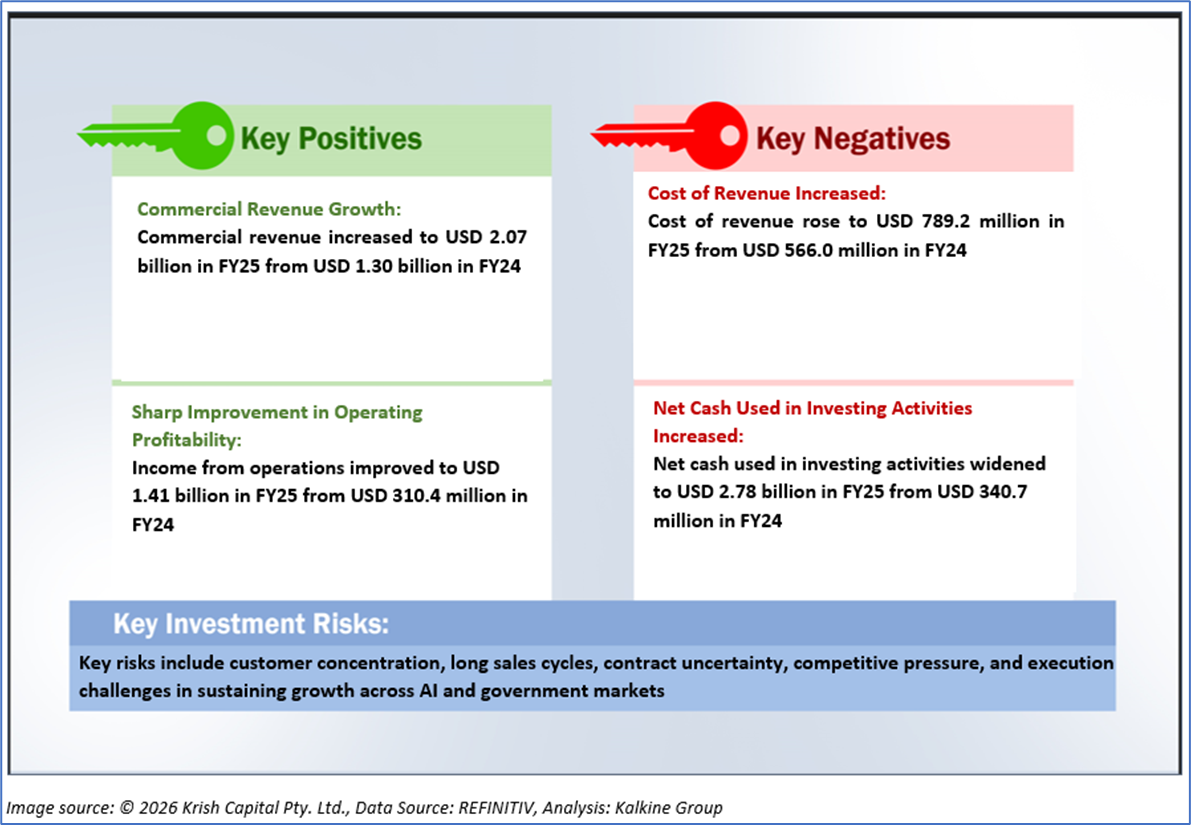
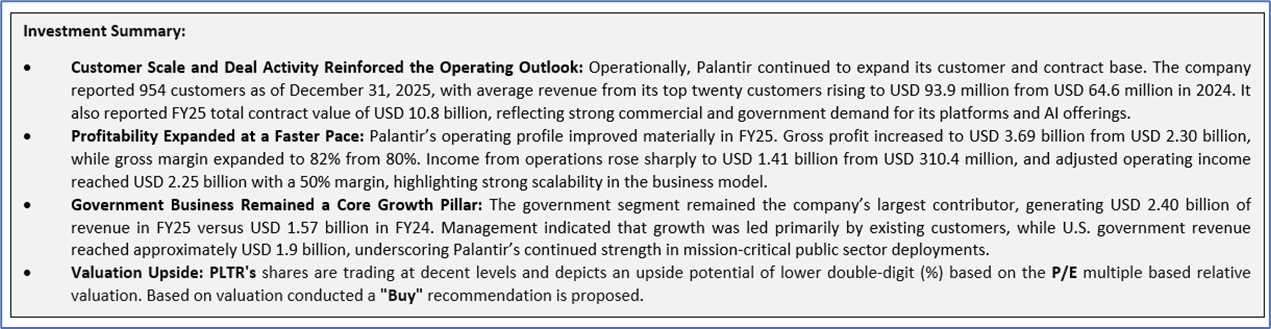
1.3 Top 10 shareholders:
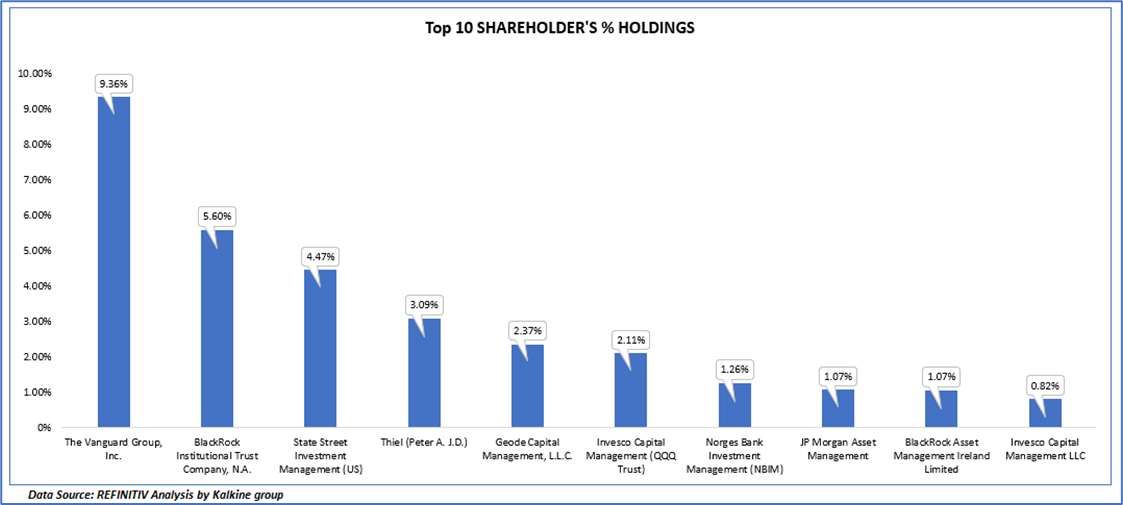
The top 10 shareholders together form ~ 31.21% of the total shareholding, signifying concentrated shareholding. The Vanguard Group, Inc. and BlackRock Institutional Trust Company, N.A. are the biggest shareholders, holding the maximum stake in the company at 9.36% and 5.60%, respectively.
1.4 Key Metrics:
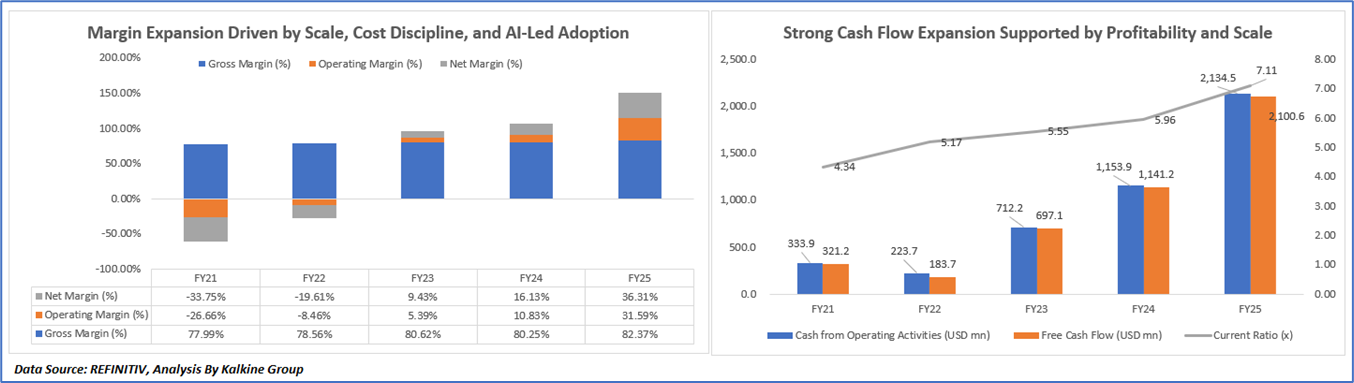
Margin Expansion Driven by Scale, Cost Discipline, and AI-Led Adoption
Palantir’s margin profile reflects a transition from an investment-heavy phase to a scalable, profitable software model. Gross margins remained consistently strong due to its high-margin software offerings, while operating and net margins improved significantly as revenue growth enabled better cost absorption and operating leverage. Reduced relative impact of stock-based compensation, disciplined expense management, and strong growth in both government and commercial segments further supported profitability. Additionally, increasing adoption of its AI platform (AIP) and broader product ecosystem enhanced efficiency and value delivery, reinforcing sustained margin expansion over the period.
Strong Cash Flow Expansion Supported by Profitability and Scale
The upward trend in operating cash flow and free cash flow from FY22 to FY25 is primarily driven by strong revenue growth across government and commercial segments, improving operating margins, and enhanced cost discipline. As Palantir scaled, higher net income and better operating leverage translated into stronger cash generation. Additionally, improved collections from customers and favorable working capital dynamics supported operating cash flow. The steady rise in free cash flow reflects disciplined capital expenditure and efficient resource allocation. Meanwhile, the consistent improvement in the current ratio indicates a strengthening liquidity position, supported by growing cash reserves and investments in short-term securities, reinforcing financial stability over the period.
Section 2: Business Updates and Corporate Business Highlights
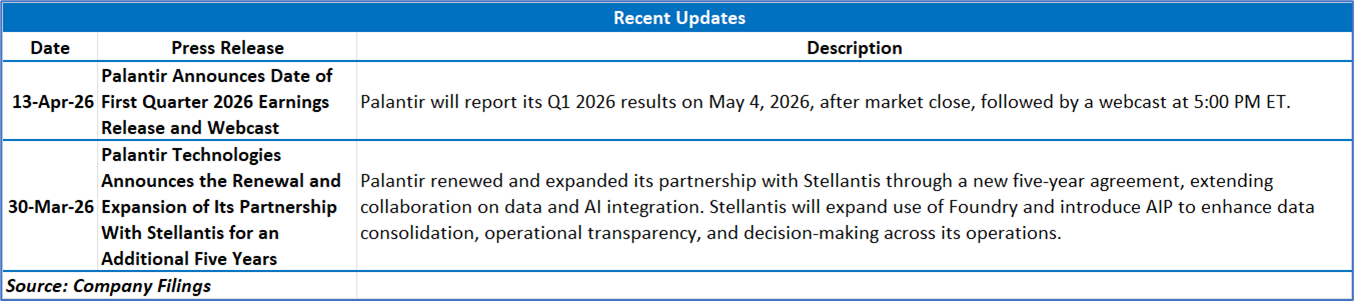
2.1 Recent Business Updates
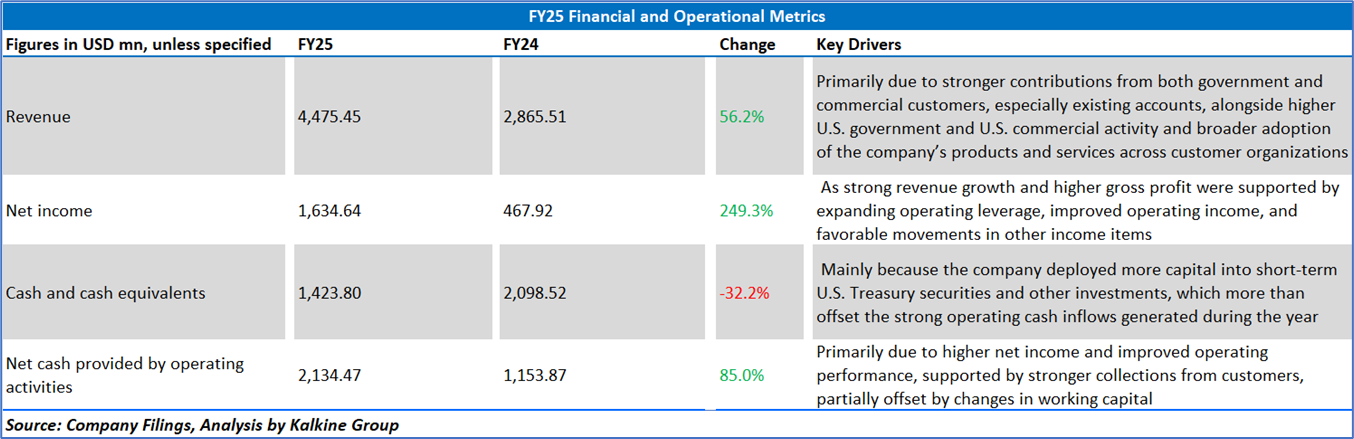
2.2 Insights of FY25:
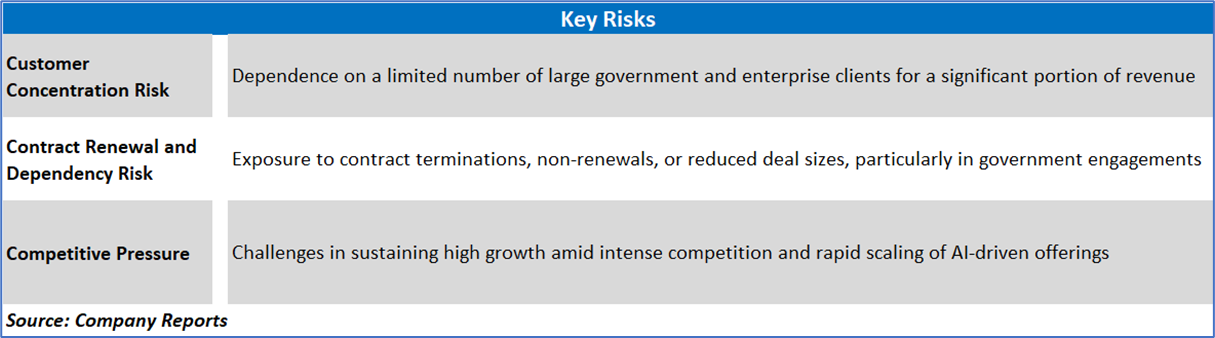
Section 3: Key Risks & Outlook
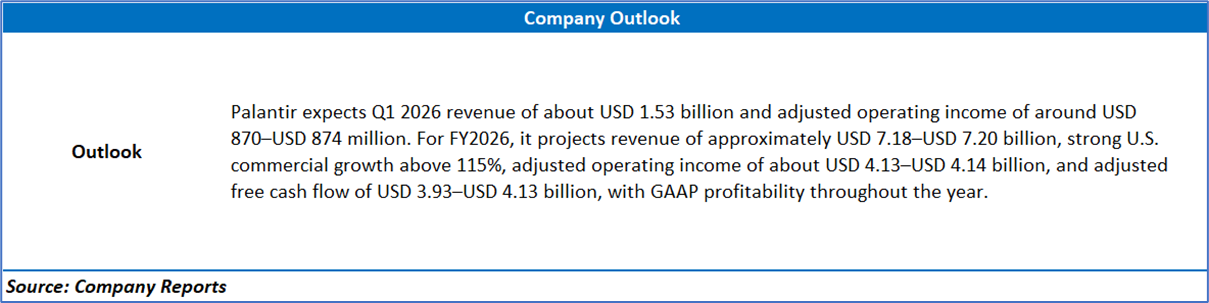
Section 4: Stock Recommendation Summary:
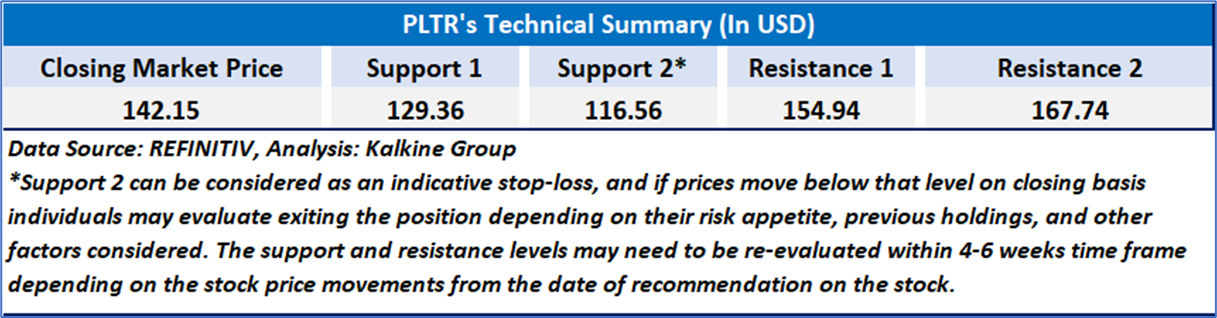
4.1 Price Performance and Technical Summary:
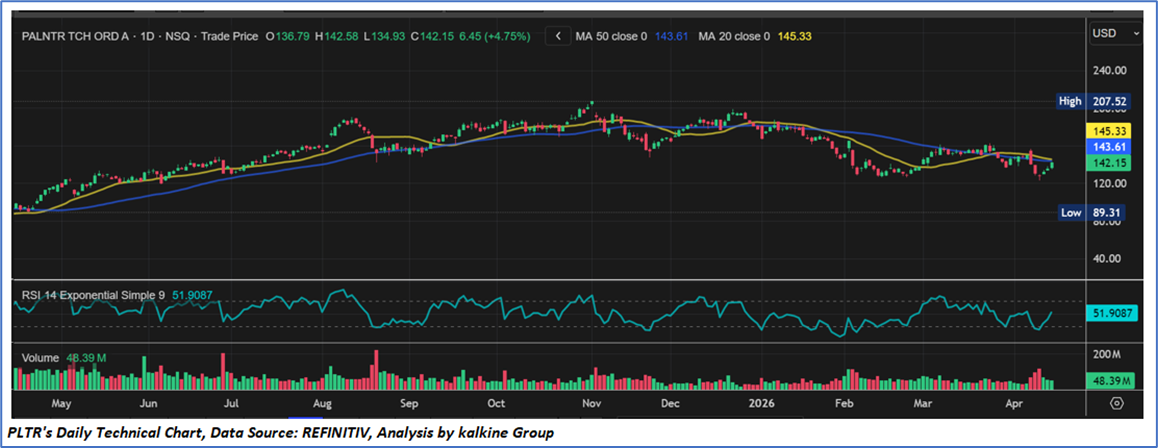
Stock Performance:
- The stock shows a prior uptrend followed by a broad consolidation phase since late 2025, with price oscillating within a range rather than making sustained higher highs.
- Price is currently trading around the 20-day and 50-day moving averages, indicating a lack of strong directional momentum and a neutral near-term trend. The flattening of both averages suggests consolidation.
- RSI is around 51, indicating neutral momentum with no clear overbought or oversold conditions, suggesting the stock may continue to trade sideways in the near term.
- Volume remains relatively stable with occasional spikes, indicating participation but no strong conviction-driven move yet.
4.2 Fundamental Valuation
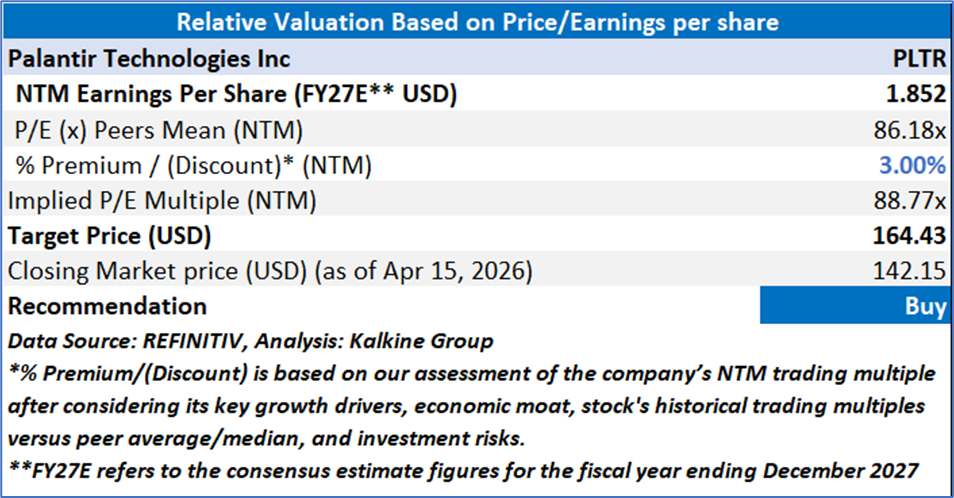
Valuation Methodology: Price/Earnings Per Share Multiple Based Relative Valuation
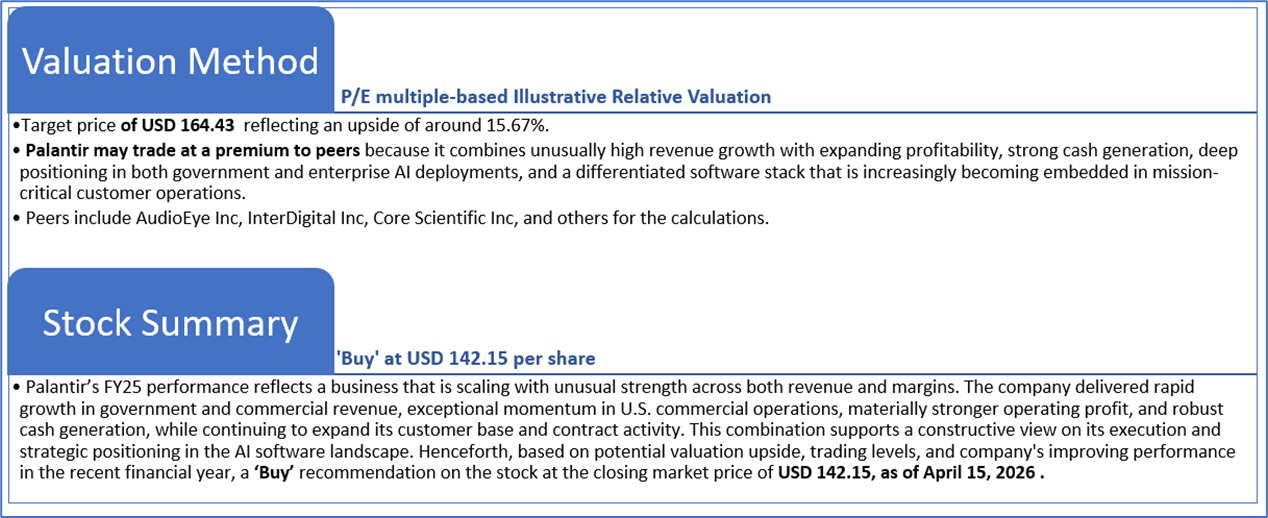
Markets are trading in a highly volatile zone currently due to certain macroeconomic issues and geopolitical tensions prevailing. Therefore, it is prudent to follow a cautious approach while investing.
Note 1: Past performance is not a reliable indicator of future performance.
Note 2: The reference date for all price data, currency, technical indicators, support, and resistance levels is April 15, 2026. The reference data in this report has been partly sourced from REFINITIV.
Note 3: Investment decisions should be made depending on an individual's appetite for upside potential, risks, holding duration, and any previous holdings. An 'Exit' from the stock can be considered if the Target Price mentioned as per the Valuation and or the technical levels provided has been achieved and is subject to the factors discussed above.
Note 4: The report publishing date is as per the Pacific Time Zone.
Technical Indicators Defined: -
Support: A level at which the stock prices tend to find support if they are falling, and a downtrend may take a pause backed by demand or buying interest. Support 1 refers to the nearby support level for the stock and if the price breaches the level, then Support 2 may act as the crucial support level for the stock.
Resistance: A level at which the stock prices tend to find resistance when they are rising, and an uptrend may take a pause due to profit booking or selling interest. Resistance 1 refers to the nearby resistance level for the stock and if the price surpasses the level, then Resistance 2 may act as the crucial resistance level for the stock.
Stop-loss: It is a level to protect against further losses in case of unfavorable movement in the stock prices.
Past performance is not a reliable indicator of future performance.

 NZ
 UK
 US
 AU
 IND

 CA

 Please wait processing your request...