Section1: Commodity Update:
Canada has the third-largest proven oil reserve in the world, most of which is in the oil sands. Total Canadian proven oil reserves are estimated at ~ 171.0 billion barrels, of which 166.3 billion barrels are found in Alberta's oil sands and an additional 4.7 billion barrels in conventional, offshore, and tight oil formations. Canada accounts for 10% of the world’s proven oil reserves. Recently, WTI crude oil futures steadied around $67 per barrel, heading for its biggest monthly decline since September, as US economic concerns and broader market uncertainty weighed on the energy demand outlook. President Trump revoked Chevron's license to operate in Venezuela, following fresh sanctions on Iran earlier in the month, both of which could tighten global supply. He also reaffirmed tariffs on Mexico and Canada, including a 10% levy on Canadian energy imports, effective March 4, 2025.
Data Source: Government of Canada
Section 2: Company Overview and Fundamental Insights:
2.1 ompany Overview:
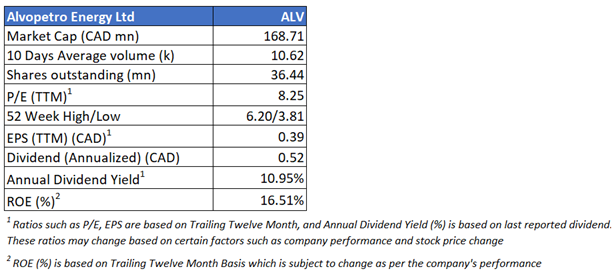
Alvopetro Energy Ltd (TSXV: ALV) is a Canada-based resource company engaged in the exploration, acquisition, development, and production of hydrocarbons in Brazil. It generates revenue from Natural gas, oil, and condensate sales, and all of its revenue is derived from Brazil.
Kalkine’s Penny Report covers the Investment Highlights, Key Financial Metrics, Risks, Technical Analysis along with the Valuation, Target Price, and Recommendation on the stock.
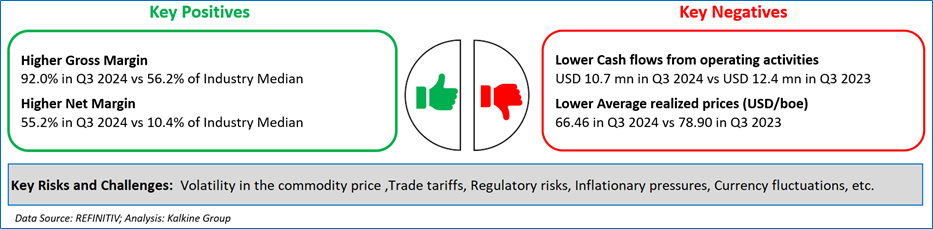
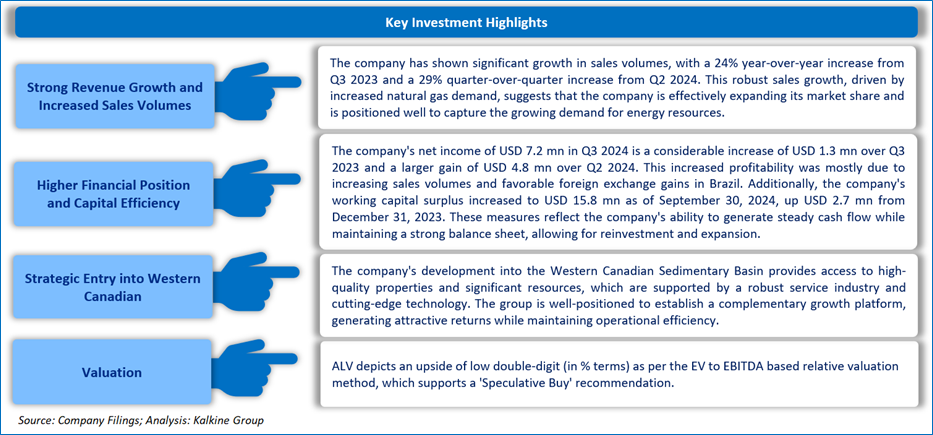
2.2 The Key Positives, Negatives, Investment Highlights and Risks
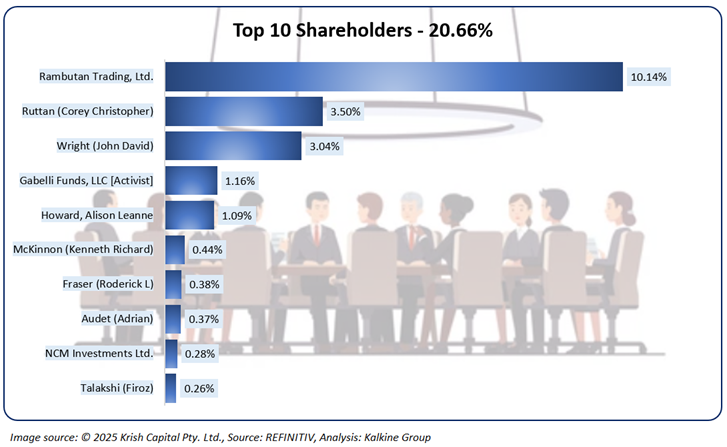
2.3 Top 10 Shareholders:
The top 10 shareholders together form ~20.66% of the total shareholding. Rambutan Trading, Ltd. and Ruttan (Corey Christopher) hold a maximum stake in the company at ~10.14% and ~3.50%, respectively.
2.4 Key Metrics:
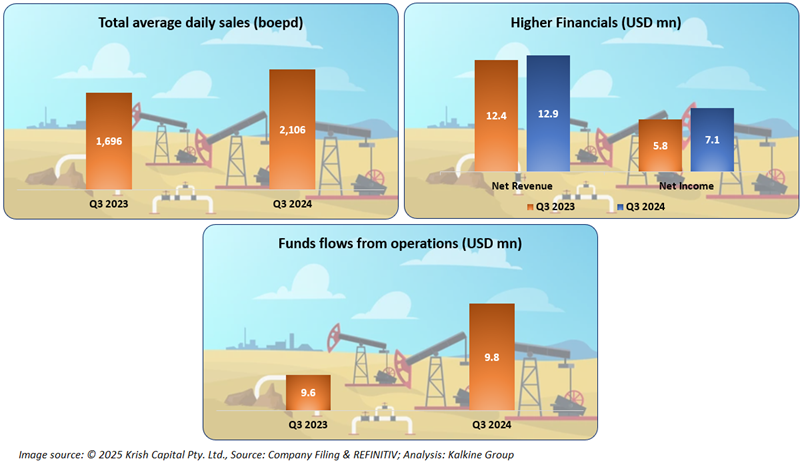
The company witnessed a rising trend in its total average daily sales volume, which is a key positive. Additionally, it is reporting a decent upsurge in its financials, where its top line as well as bottom line increased. The company’s funds flow from operations also grew, demonstrating its strength and adaptability.
Section 3: Business Updates and Financial Highlights
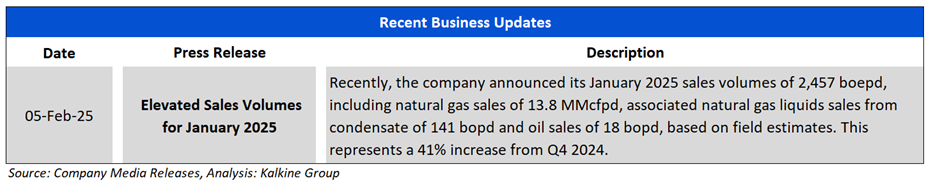
3.1 Recent Updates: The below picture gives an overview of the company’s recent activities, such as the announcement regarding operational update for the month of January 2025.
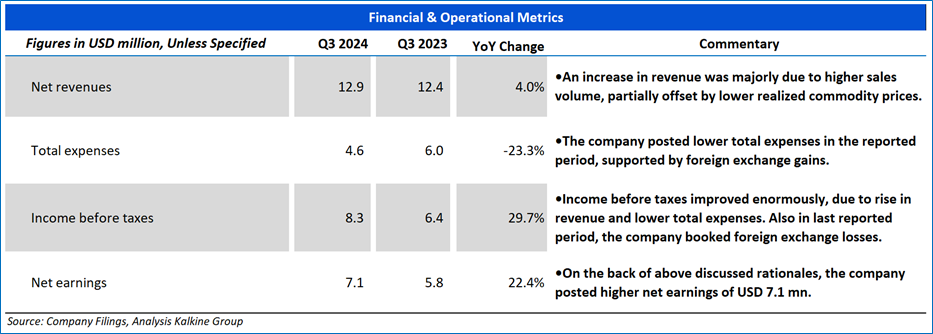
3.2 Insights into Q3 2024 Financial Performance:
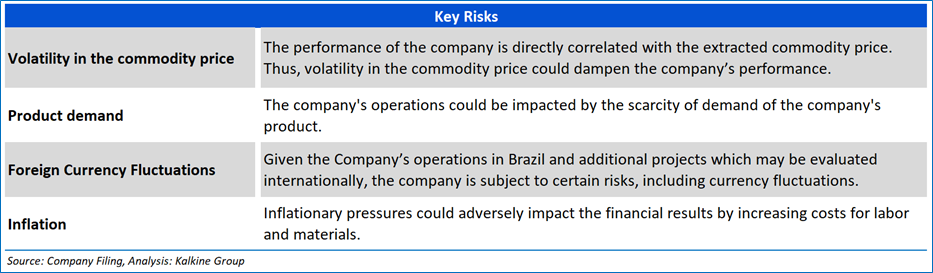
Section 4: Key Risks
Section 5: Stock Recommendation Summary:
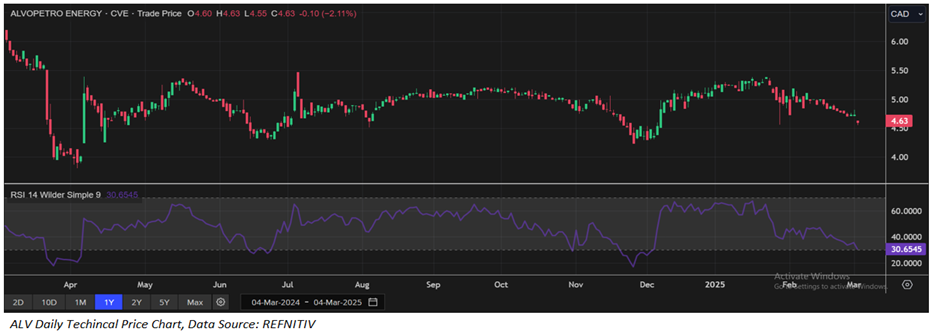
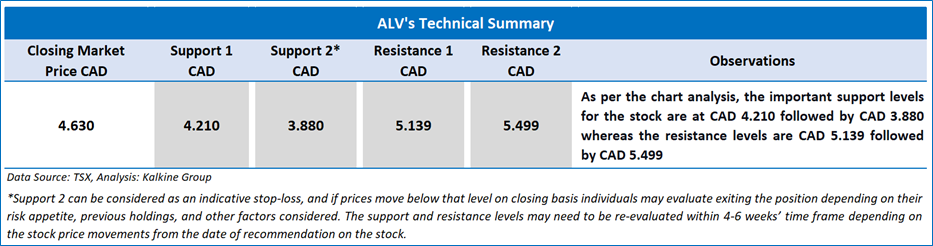
5.1 Price Performance and Technical Summary:

The stock has witnessed a downside of ~8.31% in 1 month and an upside of ~6.92% over the last 3 months respectively. Moreover, the stock is trading below the average of 52-week high price of CAD 6.20 and 52-week low price of CAD 3.81, providing an opportunity to accumulate the stock.
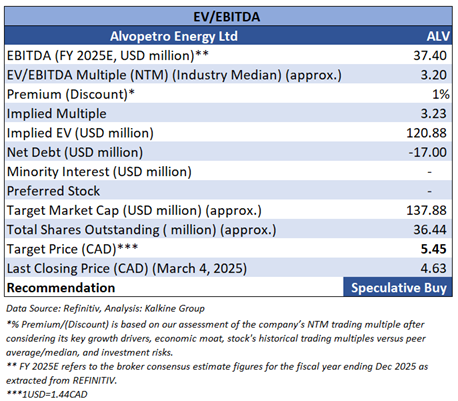
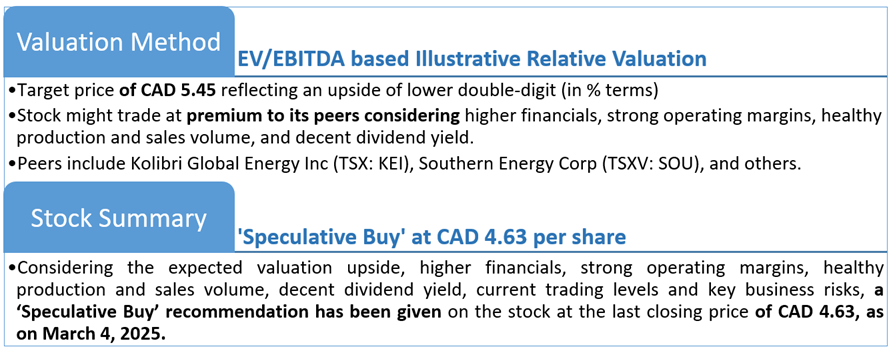
5.2 Fundamental Valuation
Valuation Methodology: EV to EBITDA Multiple Based Relative Valuation (Illustrative)
Markets are trading in a highly volatile zone currently due to certain macroeconomic issues and geopolitical tensions prevailing. Therefore, it is prudent to follow a cautious approach while investing.
Note 1: Past performance is not a reliable indicator of future performance.
Note 2: The reference date for all price data, currency, technical indicators, support, and resistance levels is March 4, 2025. The reference data in this report has been partly sourced from REFINITIV.
Note 3: Investment decisions should be made depending on an individual's appetite for upside potential, risks, holding duration, and any previous holdings. An 'Exit' from the stock can be considered if the Target Price mentioned as per the Valuation and or the technical levels provided has been achieved and is subject to the factors discussed above.
Note 4: Dividend Yield may vary as per the stock price movement.
Note 5: Kalkine reports are prepared based on the stock prices captured either from REFINITIV or Trading View. Typically, REFINITIV or Trading View may reflect stock prices with a delay which could be a lag of 25-30 minutes. There can be no assurance that future results or events will be consistent with the information provided in the report. The information is subject to change without any prior notice.
Technical Indicators Defined: -
Support: A level at which the stock prices tend to find support if they are falling, and a downtrend may take a pause backed by demand or buying interest. Support 1 refers to the nearby support level for the stock and if the price breaches the level, then Support 2 may act as the crucial support level for the stock.
Resistance: A level at which the stock prices tend to find resistance when they are rising, and an uptrend may take a pause due to profit booking or selling interest. Resistance 1 refers to the nearby resistance level for the stock and if the price surpasses the level, then Resistance 2 may act as the crucial resistance level for the stock.
Stop-loss: It is a level to protect further losses in case of unfavourable movement in the stock prices.
Past performance is not a reliable indicator of future performance.

 Please wait processing your request...