Section 1: Company Overview and Fundamentals
1.1 Company Overview:
Antofagasta PLC (OTC: ANFGF) is a UK-listed mining company with operations primarily in Chile, focused on copper and related by-products. The business is structured into two segments: Mining and Transport. Within Mining, it operates four sites—Los Pelambres and Centinela, which mainly produce copper concentrates with gold, silver, and molybdenum by-products, and Antucoya and Zaldívar, which produce copper cathodes.
Kalkine’s Diversified Opportunities Report covers the Company Overview, Key positives & negatives, Investment summary, Key investment metrics, Top 10 shareholding, Business updates and insights into company recent financial results, Key Risks & Outlook, Price performance and technical summary, Target Price, and Recommendation on the stock.
Stock Performance:
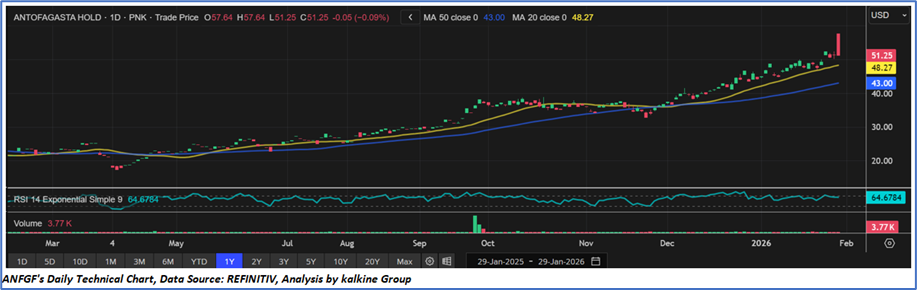
- The stock remains in a strong uptrend, consistently forming higher highs and higher lows over the past year, reflecting sustained bullish price action.
- Prices are firmly above both the 20-day (USD48.3) and 50-day (USD43.0) moving averages, with both averages sloping upward — confirming trend strength and positive momentum. The widening gap between the short- and medium-term moving averages suggests accelerating upside rather than a weakening rally.
- RSI near 65 indicates healthy bullish momentum while still below overbought levels, leaving room for further upside but signaling rising short-term fatigue risk.
1.2 The Key Positives, Negatives, and Investment summary
1.3 Top 10 shareholders:
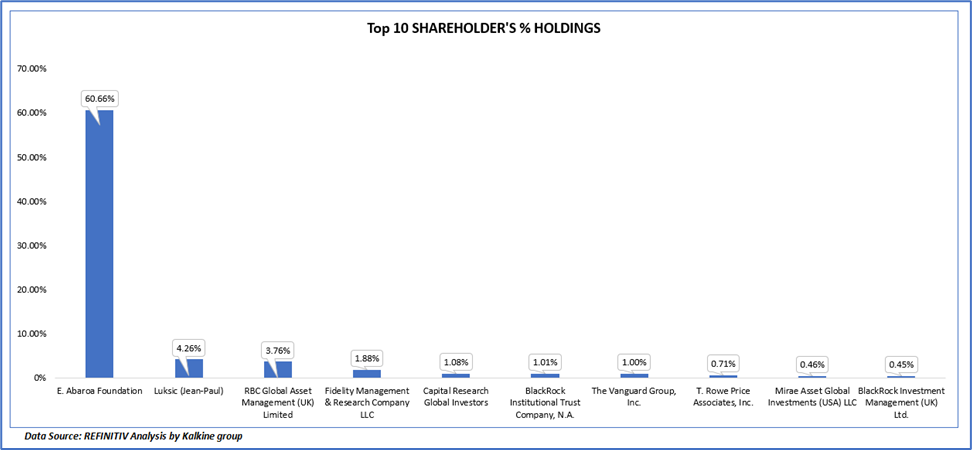
The top 10 shareholders together form ~ 75.27% of the total shareholding, signifying concentrated shareholding. E. Abaroa Foundation and Luksic (Jean-Paul) are the biggest shareholders, holding the maximum stake in the company at 60.66% and 4.26%, respectively.
1.4 Key Metrics:
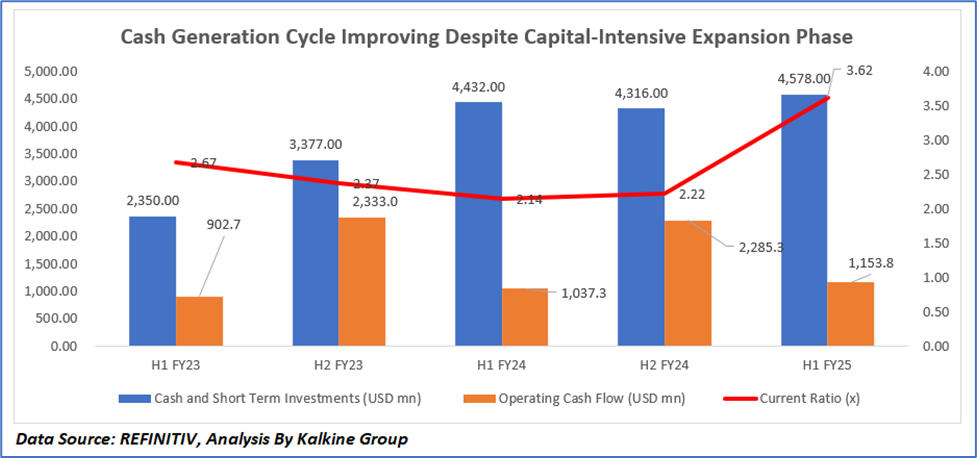
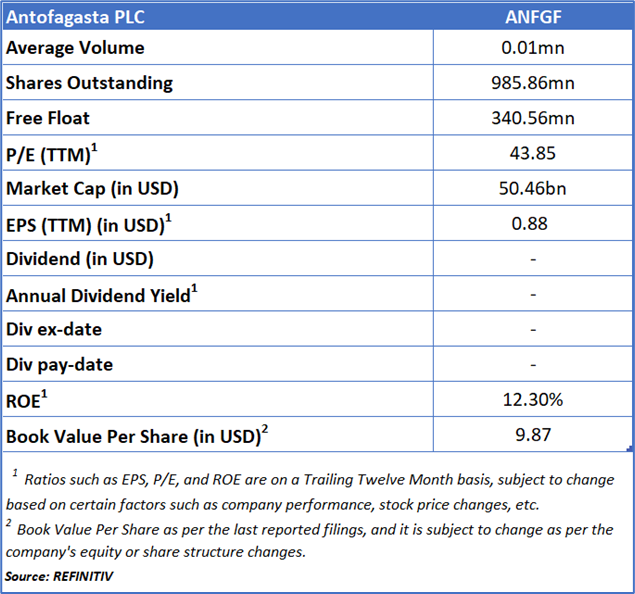
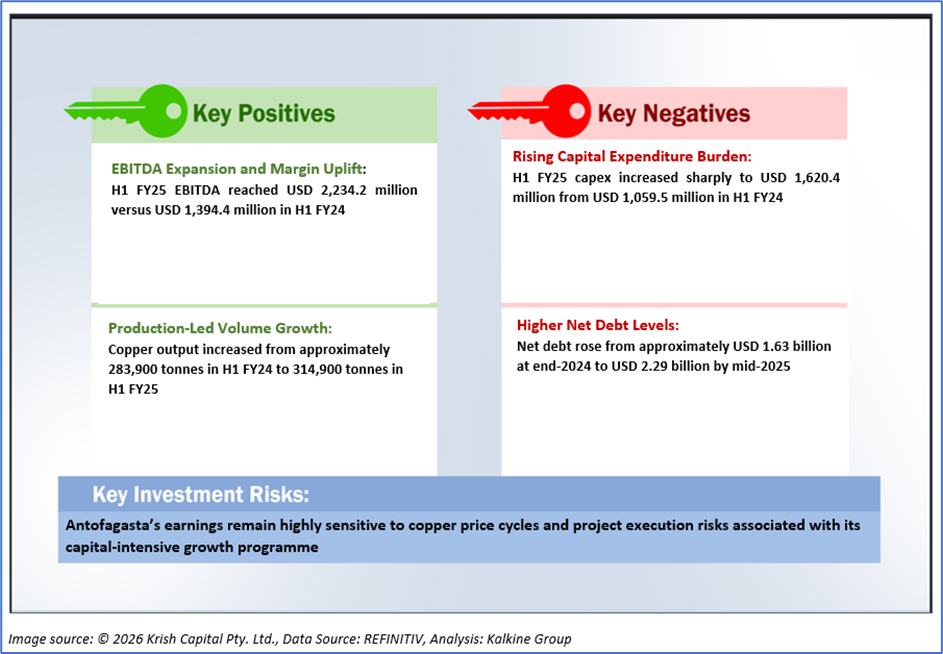
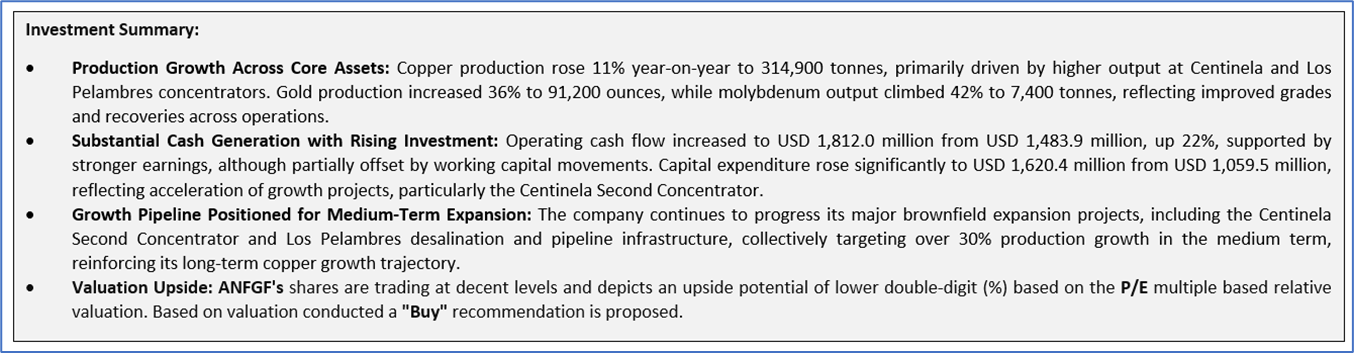
Antofagasta’s transition into a stronger cash-generating phase driven by rising production, higher realised copper prices, and expanding margins, which supported the steady build-up in cash and short-term investments, particularly in H1 FY25. The variability in operating cash flow largely stems from working capital movements linked to provisional pricing, receivables, inventory timing, and the scaling up of operations, rather than any deterioration in underlying profitability. Meanwhile, the earlier softening of the current ratio through FY23–FY24 corresponds with a period of elevated capital expenditure to fund major growth projects, which temporarily absorbed liquidity, while the sharp improvement in H1 FY25 reflects stronger earnings-driven cash inflows restoring balance sheet flexibility and reinforcing the company’s financial resilience.
Section 2: Business Updates and Corporate Business Highlights
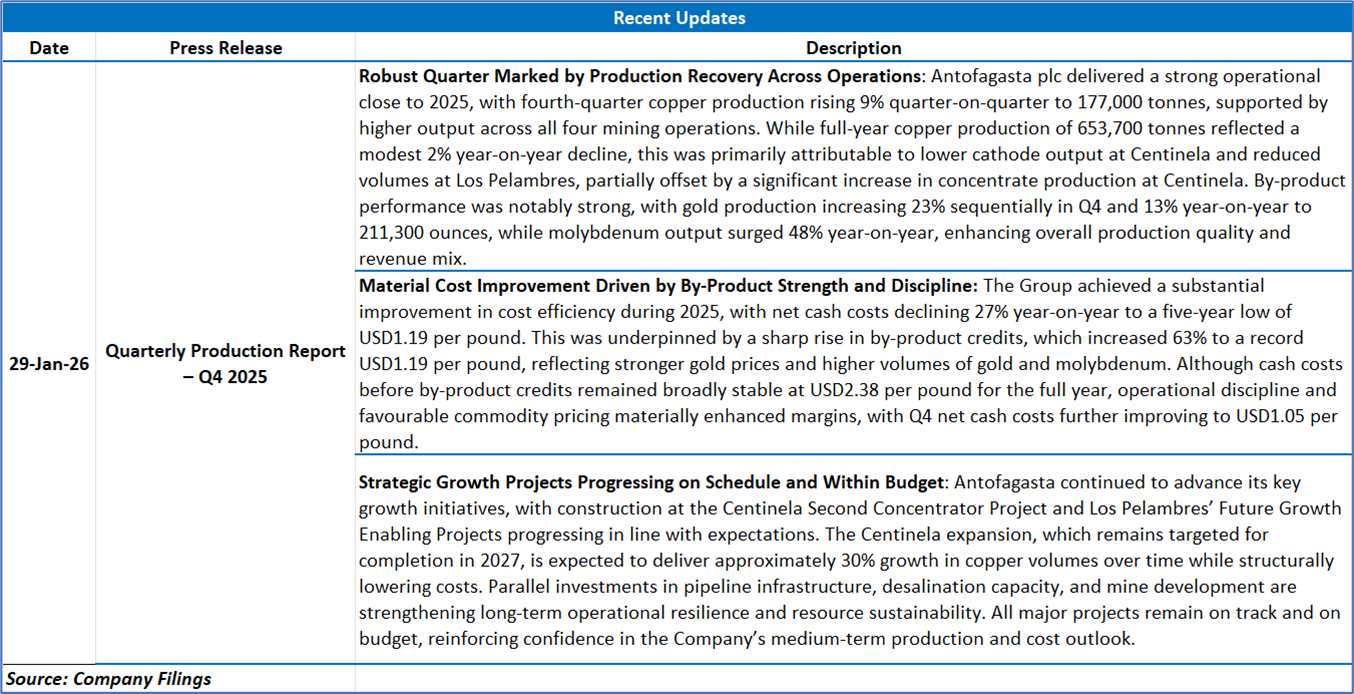
2.1 Recent Business Updates
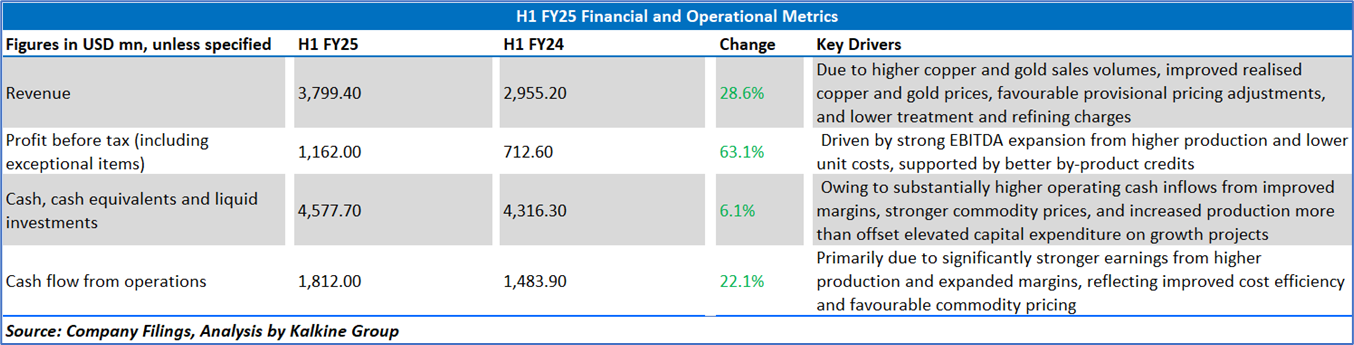
2.2 Insights of H1FY25:
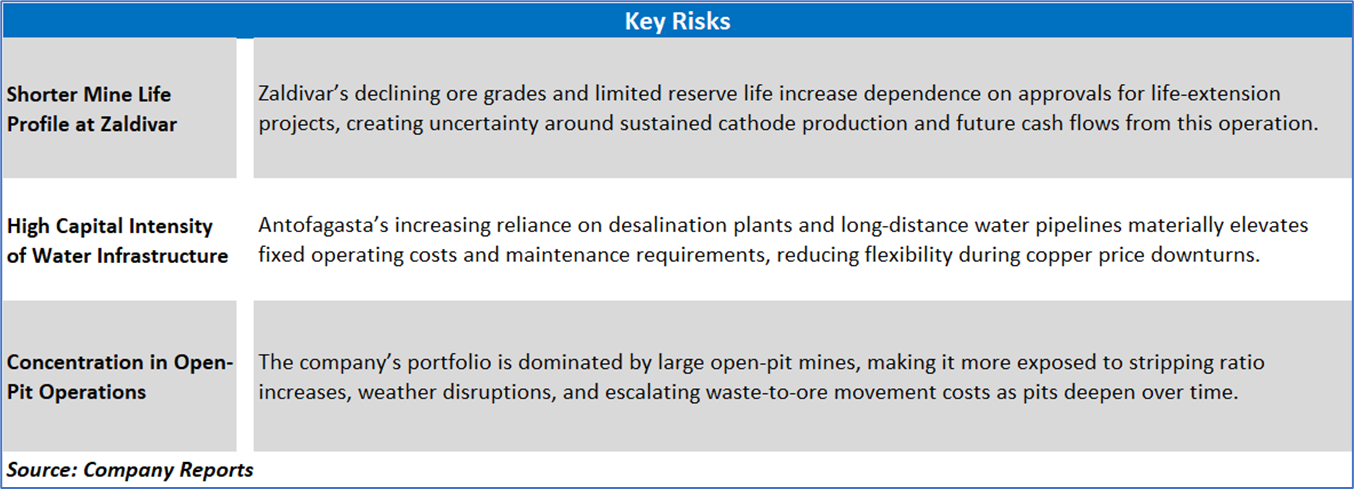
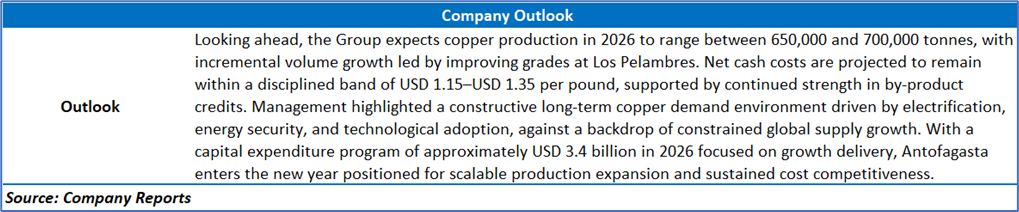
Section 3: Key Risks & Outlook
Section 4: Stock Recommendation Summary:
4.1 Price Performance and Technical Summary:
Stock Performance:
- The stock remains in a strong uptrend, consistently forming higher highs and higher lows over the past year, reflecting sustained bullish price action.
- Prices are firmly above both the 20-day (USD48.3) and 50-day (USD43.0) moving averages, with both averages sloping upward — confirming trend strength and positive momentum. The widening gap between the short- and medium-term moving averages suggests accelerating upside rather than a weakening rally.
- RSI near 65 indicates healthy bullish momentum while still below overbought levels, leaving room for further upside but signaling rising short-term fatigue risk.
4.2 Fundamental Valuation
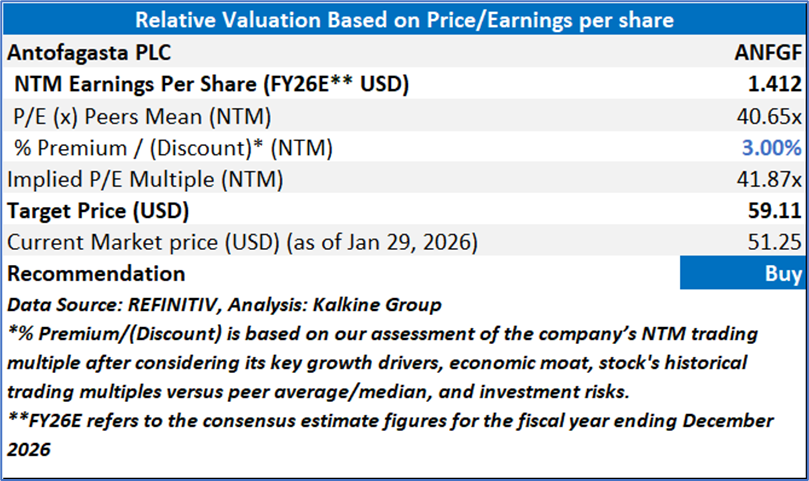
Valuation Methodology: Price/Earnings Multiple Based Relative Valuation
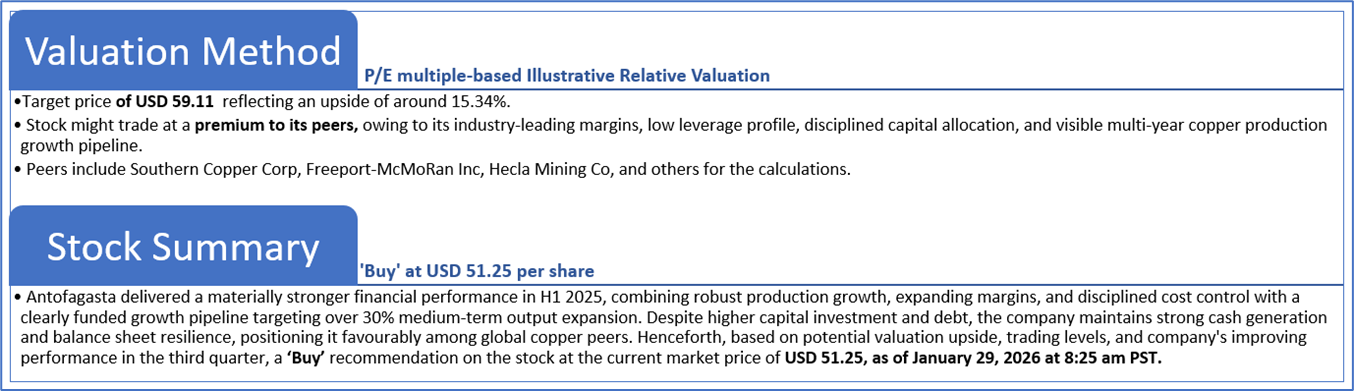
Markets are trading in a highly volatile zone currently due to certain macroeconomic issues and geopolitical tensions prevailing. Therefore, it is prudent to follow a cautious approach while investing.
Note 1: Past performance is not a reliable indicator of future performance.
Note 2: The reference date for all price data, currency, technical indicators, support, and resistance levels is January 29, 2026. The reference data in this report has been partly sourced from REFINITIV.
Note 3: Investment decisions should be made depending on an individual's appetite for upside potential, risks, holding duration, and any previous holdings. An 'Exit' from the stock can be considered if the Target Price mentioned as per the Valuation and or the technical levels provided has been achieved and is subject to the factors discussed above.
Note 4: The report publishing date is as per the Pacific Time Zone.
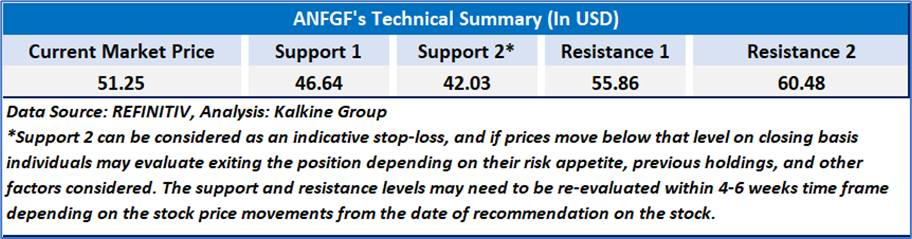
Technical Indicators Defined: -
Support: A level at which the stock prices tend to find support if they are falling, and a downtrend may take a pause backed by demand or buying interest. Support 1 refers to the nearby support level for the stock and if the price breaches the level, then Support 2 may act as the crucial support level for the stock.
Resistance: A level at which the stock prices tend to find resistance when they are rising, and an uptrend may take a pause due to profit booking or selling interest. Resistance 1 refers to the nearby resistance level for the stock and if the price surpasses the level, then Resistance 2 may act as the crucial resistance level for the stock.
Stop-loss: It is a level to protect against further losses in case of unfavorable movement in the stock prices.
Past performance is not a reliable indicator of future performance.

 NZ
 UK
 US
 AU
 IND

 CA

 Please wait processing your request...