Section1: Commodity Update:
Canada has the third-largest proven oil reserve in the world, most of which is in the oil sands. Total Canadian proven oil reserves are estimated at 171.0 billion barrels, of which 166.3 billion barrels are found in Alberta's oil sands and an additional 4.7 billion barrels in conventional, offshore, and tight oil formations. Canada accounts for 10% of the world’s proven oil reserves. Recently, WTI crude oil futures rose to around $77.8 per barrel hovering at the highest level in more than three months, amid concerns over potential supply disruptions stemming from new U.S. sanctions on Russia's oil sector. Crude prices have also been buoyed in recent weeks by winter energy demand, declining US inventories, and speculation regarding the policies under the incoming administration of President-elect Donald Trump.
Data Source: Government of Canada
Section2: Company Overview and Fundamental Insights:
2.1 Company Overview:
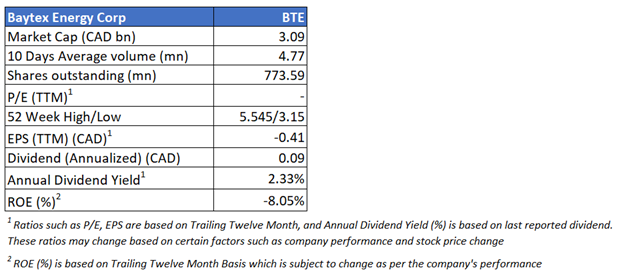
Baytex Energy Corp. (TSX: BTE) is an oil and gas company. Geographically, the group operates in Canada and the United States. The company derives a majority of revenue from Canada. Its Canada segment includes the exploration, development, and production of crude oil and natural gas in Western Canada.
Kalkine’s Growth Report covers the Investment Highlights, Key Financial Metrics, Risks, Technical Analysis along with the Valuation, Target Price, and Recommendation on the stock.
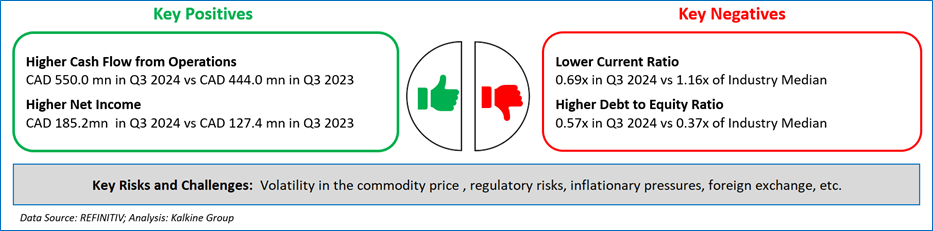
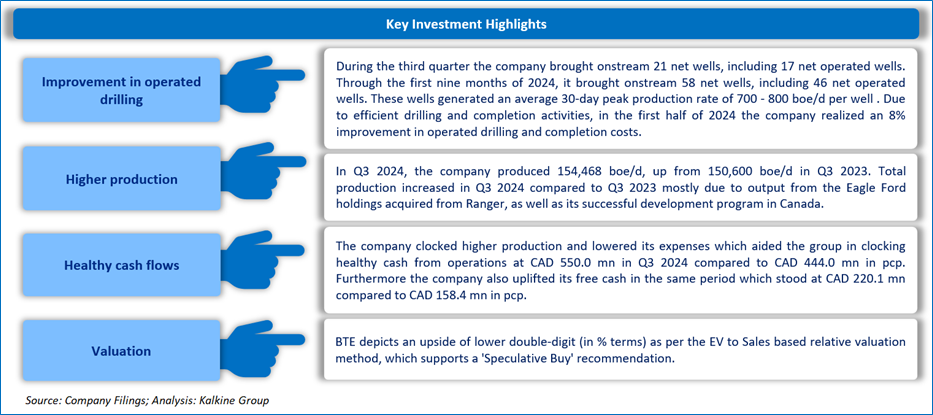
2.2 The Key Positives, Negatives, Investment Highlights and Risks
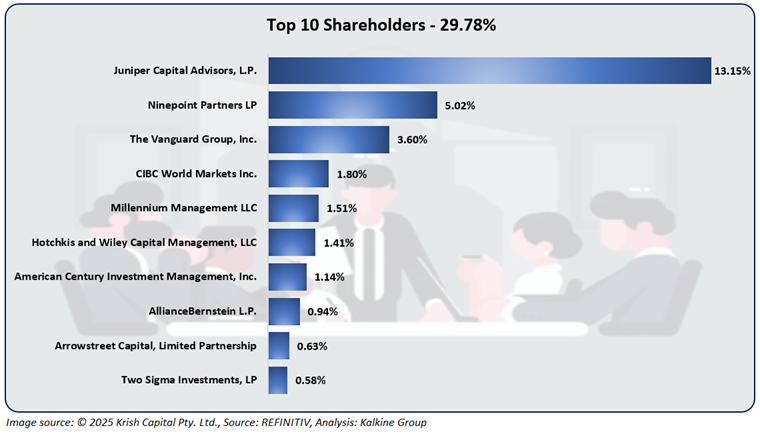
2.3 Top 10 Shareholders:
The top 10 shareholders together form ~29.78% of the total shareholding. Juniper Capital Advisors, L.P. and Ninepoint Partners LP hold a maximum stake in the company at ~13.15% and ~5.02%, respectively.
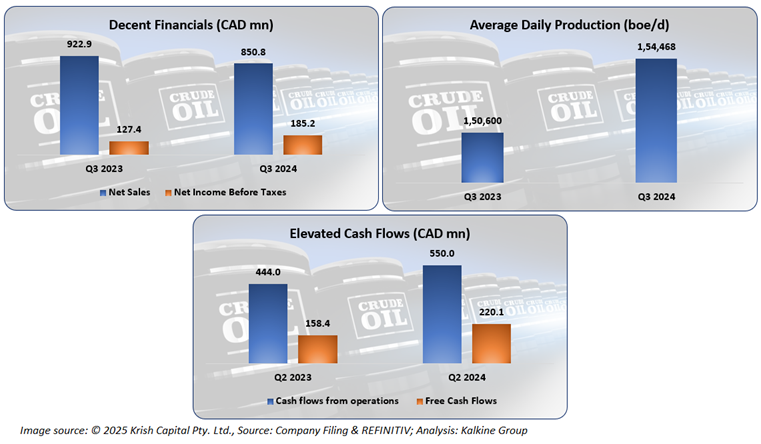
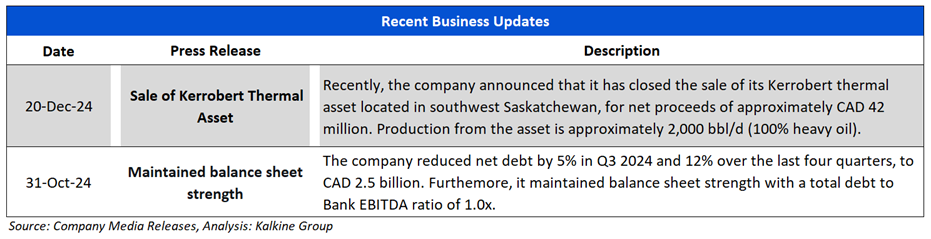
2.4 Key Metrics:
The company reported higher financials in Q3 2024 compared to Q3 2023, owing to increased output and lowered expenditure. Additionally, it recorded a significant increase in cash from operations and free cash flows, demonstrating its strength and adaptability.
Section 3: Business Updates and Financial Highlights
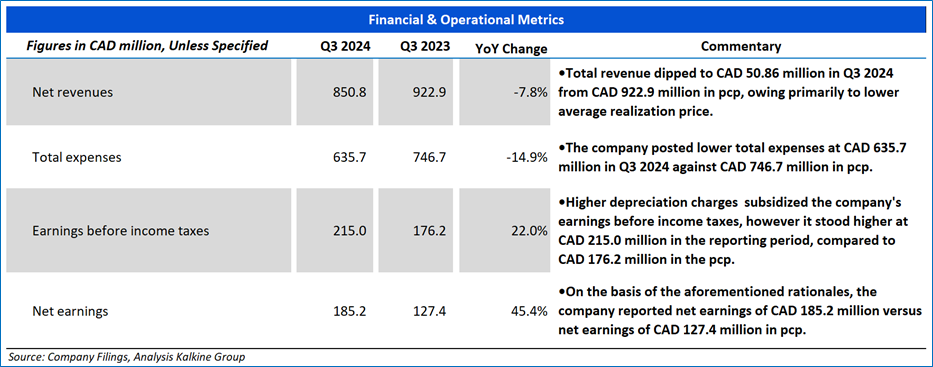
3.1 Recent Updates: The below picture gives an overview of the company’s recent activities, such as an announcement regarding sale of Kerrobert Thermal Asset and maintaining balance sheet strength.
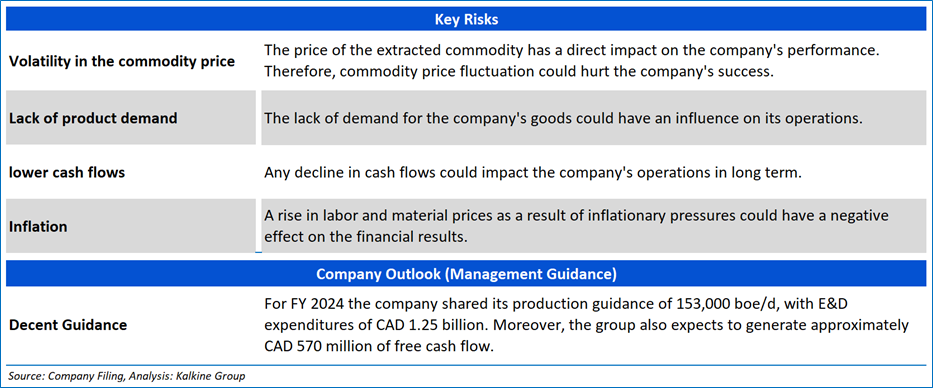
3.2 Insights on Q3 2024 Financial Performance:
Section 4: Key Risks and Company Outlook
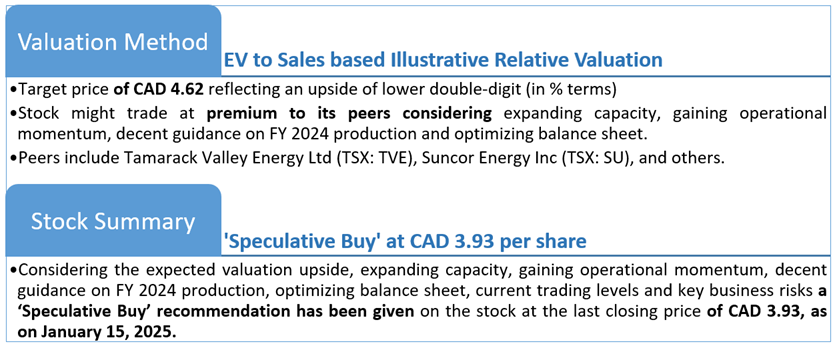
Section 5: Stock Recommendation Summary:
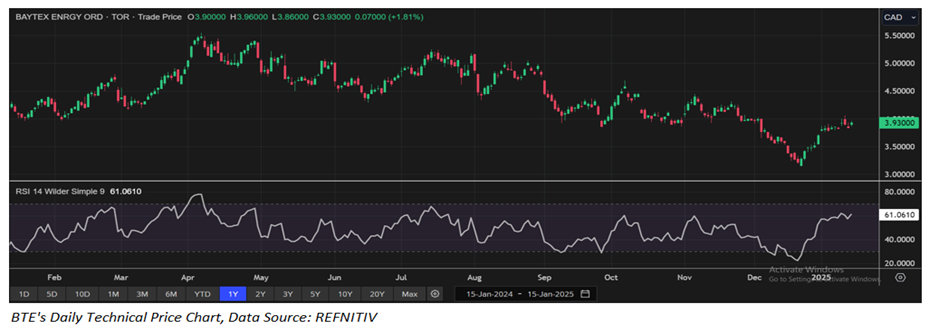
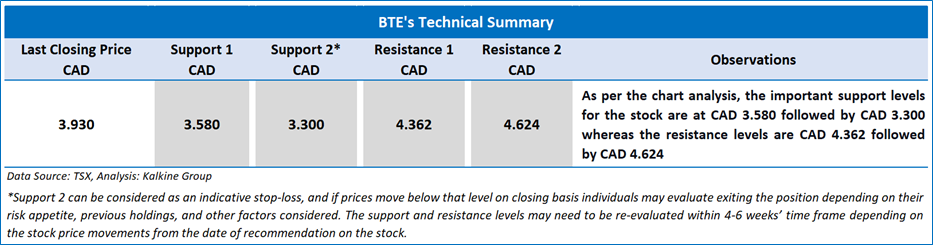
5.1 Price Performance and Technical Summary:

The stock has witnessed an upside of ~2.07% and ~15.92% over the last 1 week and 1 month respectively. Moreover, the stock is trading below the average of 52-week high price of CAD 5.545 and 52-week low price of CAD 3.15 providing an opportunity to accumulate the stock.
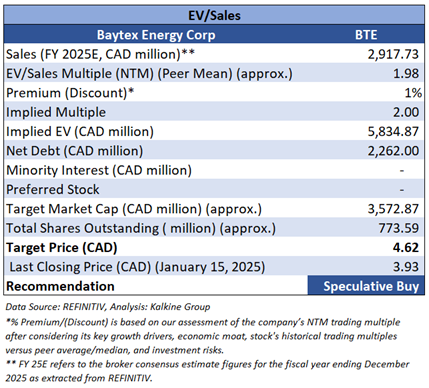
5.2 Fundamental Valuation
Valuation Methodology: EV to Sales Based Relative Valuation (Illustrative)
Markets are trading in a highly volatile zone currently due to certain macroeconomic issues and geopolitical tensions prevailing. Therefore, it is prudent to follow a cautious approach while investing.
Note 1: Past performance is not a reliable indicator of future performance.
Note 2: The reference date for all price data, currency, technical indicators, support, and resistance levels is January 15, 2025. The reference data in this report has been partly sourced from REFINITIV.
Note 3: Investment decisions should be made depending on an individual's appetite for upside potential, risks, holding duration, and any previous holdings. An 'Exit' from the stock can be considered if the Target Price mentioned as per the Valuation and or the technical levels provided has been achieved and is subject to the factors discussed above.
Note 4: Dividend Yield may vary as per the stock price movement.
Note 5: Kalkine reports are prepared based on the stock prices captured either from REFINITIV or Trading View. Typically, REFINITIV or Trading View may reflect stock prices with a delay which could be a lag of 25-30 minutes. There can be no assurance that future results or events will be consistent with the information provided in the report. The information is subject to change without any prior notice.
Technical Indicators Defined: -
Support: A level at which the stock prices tend to find support if they are falling, and a downtrend may take a pause backed by demand or buying interest. Support 1 refers to the nearby support level for the stock and if the price breaches the level, then Support 2 may act as the crucial support level for the stock.
Resistance: A level at which the stock prices tend to find resistance when they are rising, and an uptrend may take a pause due to profit booking or selling interest. Resistance 1 refers to the nearby resistance level for the stock and if the price surpasses the level, then Resistance 2 may act as the crucial resistance level for the stock.
Stop-loss: It is a level to protect further losses in case of unfavourable movement in the stock prices.
Past performance is not a reliable indicator of future performance.

 Please wait processing your request...