Section 1: Company Overview and Fundamentals
1.1 Company Overview:
Blackstone Inc (NYSE: BX) is a leading global alternative asset manager offering investment solutions across real estate, private equity, infrastructure, credit, life sciences, growth equity, secondaries, hedge funds and other real assets. The company operates through four major segments: Real Estate, which includes opportunistic, Core+ and debt strategies; Private Equity, covering corporate, sector-focused and geographically diversified investments; Credit & Insurance, focused on private and liquid corporate credit along with infrastructure and asset-based financing; and Multi-Asset Investing, which manages absolute return, multi-strategy, portfolio management and public real asset platforms.
Kalkine’s Dividend Income Report covers the Company Overview, Key positives & negatives, Investment summary, Key investment metrics, Top 10 shareholding, Business updates and insights into company recent financial results, Key Risks & Outlook, Price performance and technical summary, Target Price, and Recommendation on the stock.
Price Performance:
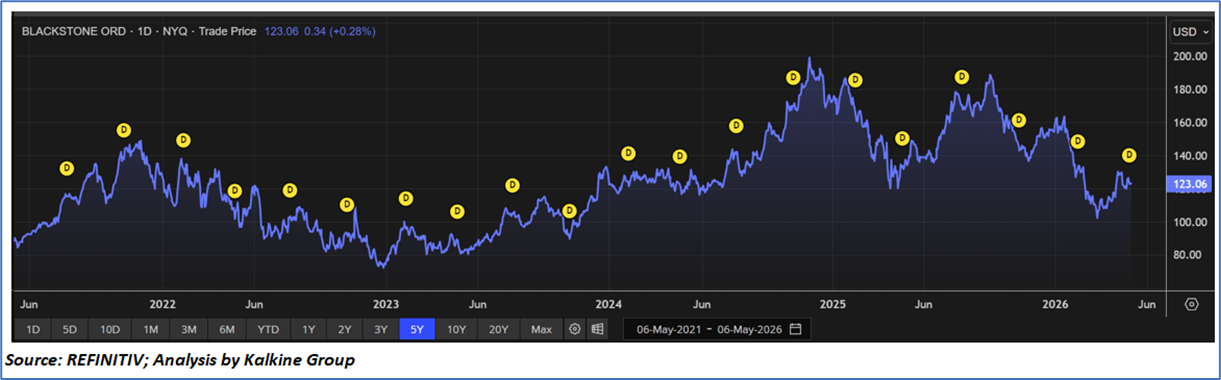
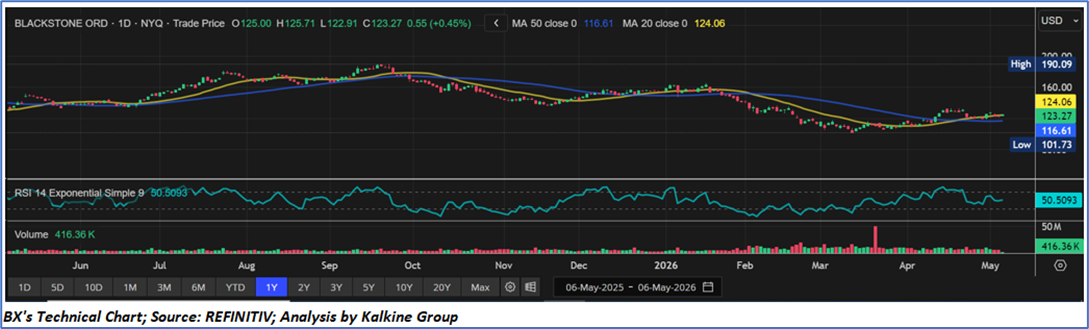
- Blackstone appears to be trading within a broadly range-bound structure following the sharp correction witnessed during February and March 2026.
- The stock has recently rebounded above its 50-day moving average near USD 116.61, indicating improving medium-term sentiment and gradual recovery in buying interest.
- The price is currently trading close to the 20-day moving average near USD 124.06, suggesting neutral near-term momentum and ongoing consolidation.
- The RSI is hovering around the 50 level, reflecting balanced momentum conditions without strong bullish or bearish dominance.
- Volume activity remains relatively moderate, indicating limited aggressive institutional accumulation or distribution at current levels.
- Despite the recent recovery, the stock continues to trade below its previous highs near the USD 190 region, suggesting that the broader long-term trend remains in a consolidation phase.
- A sustained breakout above resistance levels could support additional upside momentum, whereas weakness below the medium-term moving average may result in renewed consolidation pressure.
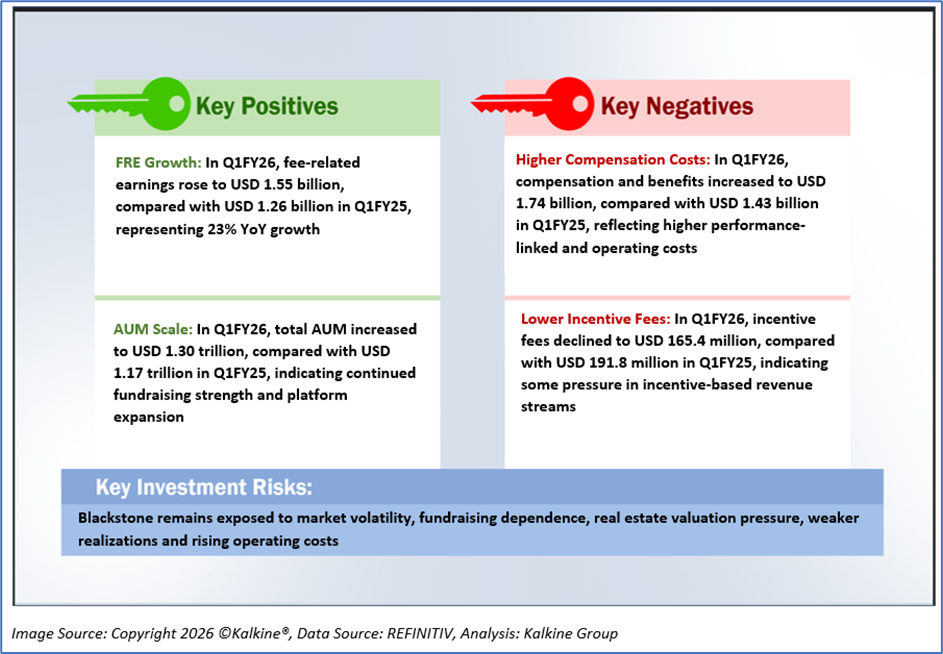
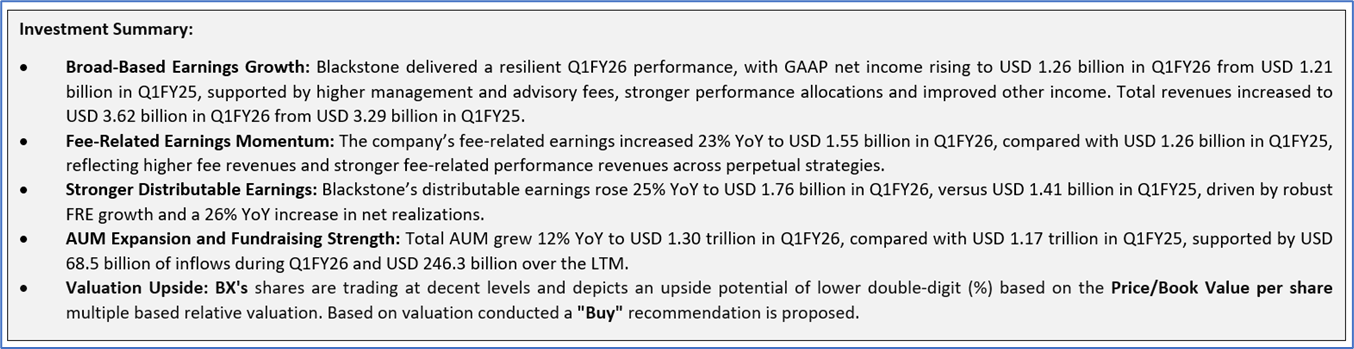
1.2 The Key Positives, Negatives, and Investment summary
1.3 Top 10 shareholders:
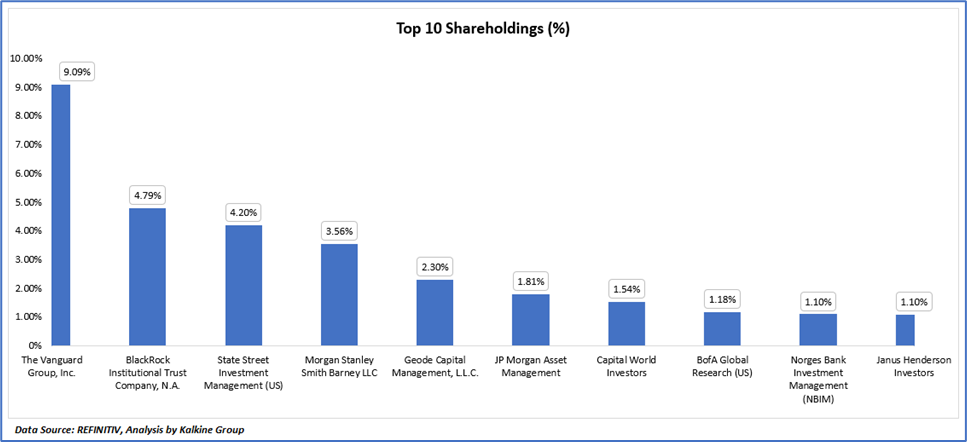
The top 10 shareholders together form ~30.67% of the total shareholding, signifying concentrated shareholding. The Vanguard Group, Inc. and BlackRock Institutional Trust Company, N.A.are the biggest shareholders, holding the maximum stake in the company at ~9.09% and 4.79%, respectively%.
1.4 Blackstone’s Rising Dividend Yield Reflects Earnings Strength and Capital Return Momentum
Blackstone has maintained a strong dividend distribution profile over the years, supported by growth in fee-related earnings, expanding assets under management and solid distributable earnings generation. The company’s dividend pattern reflects its variable payout structure, where distributions generally rise during periods of stronger realization activity, investment monetization and fundraising momentum.
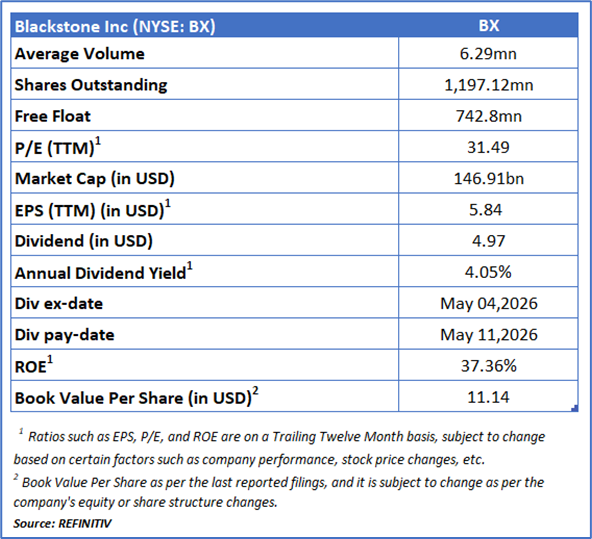
In Q1FY26, Blackstone declared a quarterly dividend of USD 1.16 per share, while total dividends distributed over the last twelve months reached USD 4.97 per share, supported by a 25% YoY increase in distributable earnings to USD 1.76 billion. The company’s current dividend yield stands at 4.05%, compared with a historical dividend yield of 3.08% and a five-year average dividend yield of 3.10%, indicating that the stock continues to offer an attractive income profile relative to its long-term average.
The dividend yield trend displayed in the chart highlights a gradual improvement over recent years. Forecast dividend yield is projected at approximately 4.29%, while forward DPS yield estimates are expected to rise further toward the 5.3%–6.0% range over the medium term, reflecting expectations of continued earnings growth and sustained shareholder distributions. Additionally, the company has delivered a strong five-year DPS growth rate of 15.97%, reinforcing the long-term expansion in dividend payouts.
Historically, Blackstone’s dividend yield has fluctuated alongside movements in the company’s share price and realization cycle. During periods of strong stock price appreciation, the implied dividend yield moderated despite rising dividend payouts, whereas periods of market correction or elevated volatility resulted in comparatively higher yields. The chart indicates that while Blackstone’s share price experienced significant fluctuations over the past several years, dividend yield expectations and DPS yield estimates continued to trend upward, highlighting investor confidence in the company’s long-term cash generation capability.
However, the company’s payout ratio remained elevated at 120.42%, compared with a five-year average payout ratio of 100.97%, while the coverage ratio moderated to 83.04% versus the five-year average of 99.04%. This suggests that future dividend sustainability remains partly dependent on continued earnings growth, realization activity and favorable fundraising conditions. Overall, Blackstone’s growing perpetual capital base, recurring management fee streams and diversified alternative asset platform continue to support a relatively attractive and expanding dividend yield profile over the long term.
1.5 Key Metrics
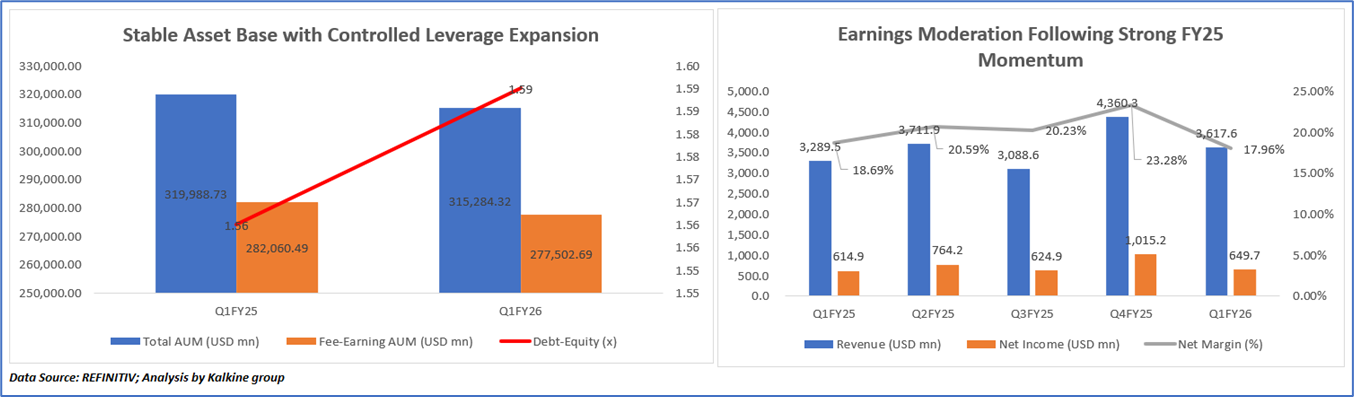
Stable Asset Base with Controlled Leverage Expansion
The chart indicates that Blackstone maintained a relatively stable asset base during Q1FY26 while experiencing a moderate increase in leverage levels. Total AUM stood at approximately USD 315.3 billion in Q1FY26, compared with USD 320.0 billion in Q1FY25, reflecting a marginal decline largely associated with softer real estate valuations and realization activity within certain strategies. Similarly, Fee-Earning AUM declined modestly to nearly USD 277.5 billion in Q1FY26 from USD 282.1 billion in Q1FY25, indicating some pressure on fee-generating assets despite continued fundraising momentum.
Despite the slight moderation in AUM metrics, the company’s Debt-to-Equity ratio increased to 1.59x in Q1FY26 from 1.56x in Q1FY25, suggesting relatively higher leverage utilization during the period. The increase in leverage appears manageable given Blackstone’s strong recurring fee-based earnings profile, substantial liquidity position and diversified alternative asset management platform. Moreover, the company continued to generate strong fee-related earnings and distributable earnings growth, which likely supported balance-sheet flexibility despite the higher leverage ratio.
The trend also suggests that Blackstone continues to prioritize long-term capital deployment, infrastructure expansion and investment platform scaling, particularly across private equity, credit and AI-related infrastructure opportunities. While the modest decline in fee-earning assets could create temporary pressure on management fee growth, the company’s strong fundraising pipeline, expanding perpetual capital base and resilient investment performance may support stabilization in AUM levels over the medium term.
Earnings Moderation Following Strong FY25 Momentum
Blackstone’s revenue and profitability trend reflects resilient earnings generation despite some moderation following a particularly strong Q4FY25 performance. Revenue increased from approximately USD 3.29 billion in Q1FY25 to a peak of nearly USD 4.36 billion in Q4FY25, supported by stronger realization activity, higher fee-related revenues and improved investment performance across private equity, infrastructure and credit strategies. However, revenue moderated to around USD 3.62 billion in Q1FY26, reflecting softer transaction activity and lower realization momentum amid elevated market volatility and macroeconomic uncertainty. Net income followed a similar trend, rising from approximately USD 614.9 million in Q1FY25 to over USD 1.01 billion in Q4FY25, before easing to nearly USD 649.7 million in Q1FY26. Despite the sequential decline, profitability remained relatively healthy, with net margin standing at approximately 17.96% in Q1FY26, compared with the peak margin of 23.28% in Q4FY25 and 18.69% in Q1FY25. The trend suggests that Blackstone’s earnings profile remains closely linked to realization activity, investment monetization cycles and market conditions, although its diversified alternative asset platform and recurring fee-related earnings continue to support overall operational resilience.
Section 2: Business Updates and Financial Highlights
2.1 Recent Updates:
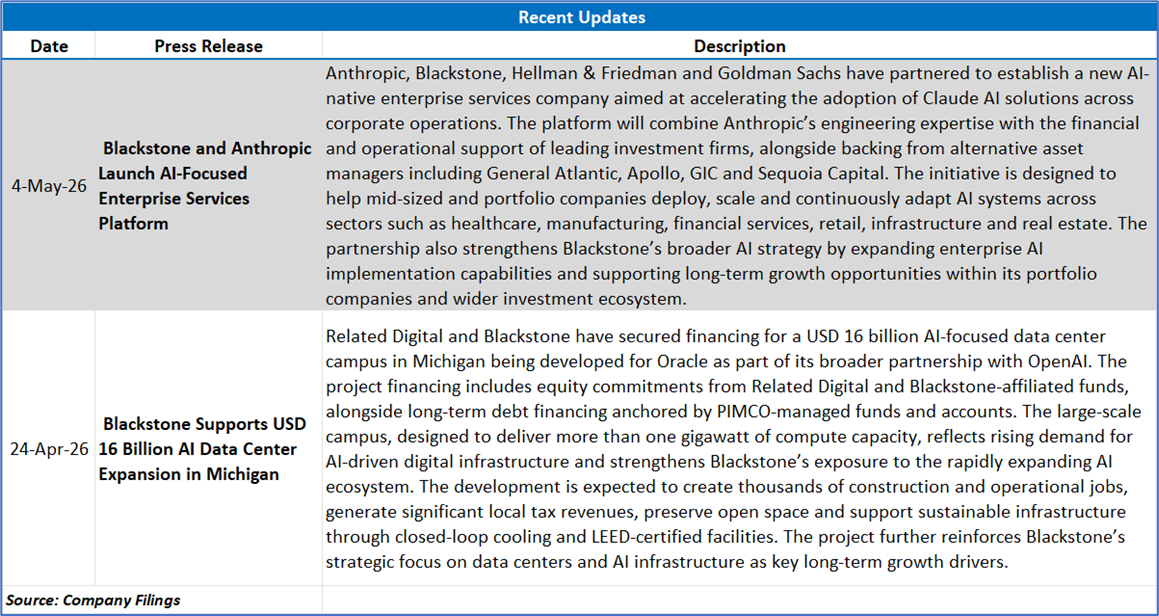
The below picture gives an overview of the recent updates:
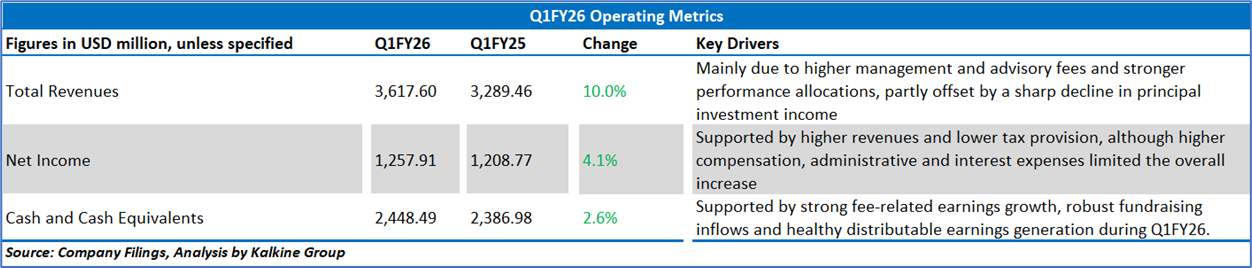
2.2 Insights of Q1FY26:
Section 3: Key Risks and Outlook:
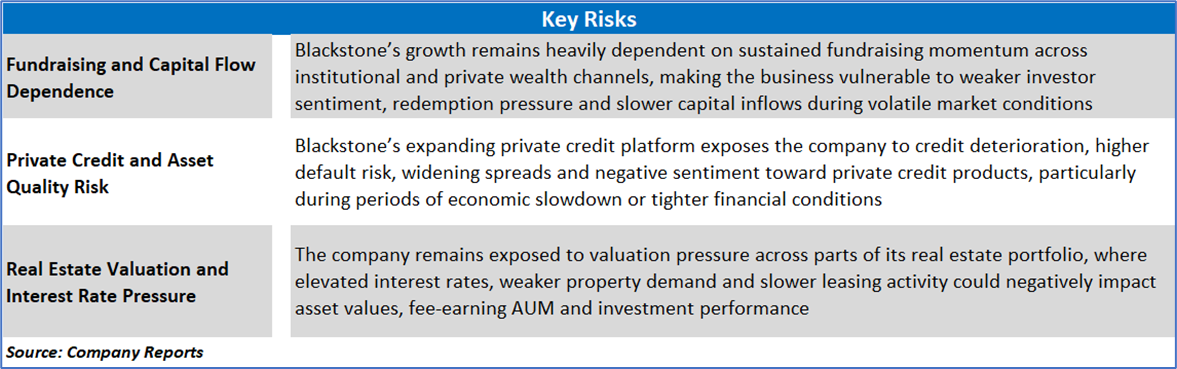
Section 4: Stock Recommendation Summary:
4.1 Technical Summary:
Price Performance:
- Blackstone appears to be trading within a broadly range-bound structure following the sharp correction witnessed during February and March 2026.
- The stock has recently rebounded above its 50-day moving average near USD 116.61, indicating improving medium-term sentiment and gradual recovery in buying interest.
- The price is currently trading close to the 20-day moving average near USD 124.06, suggesting neutral near-term momentum and ongoing consolidation.
- The RSI is hovering around the 50 level, reflecting balanced momentum conditions without strong bullish or bearish dominance.
- Volume activity remains relatively moderate, indicating limited aggressive institutional accumulation or distribution at current levels.
- Despite the recent recovery, the stock continues to trade below its previous highs near the USD 190 region, suggesting that the broader long-term trend remains in a consolidation phase.
- A sustained breakout above resistance levels could support additional upside momentum, whereas weakness below the medium-term moving average may result in renewed consolidation pressure.
4.2 Fundamental Valuation
Valuation Methodology: Price/Book Value Per Share Multiple Based Relative Valuation
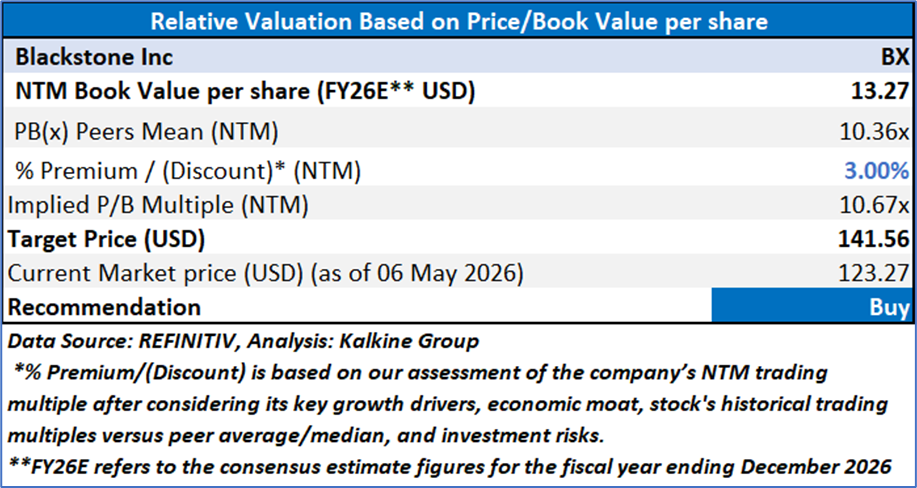
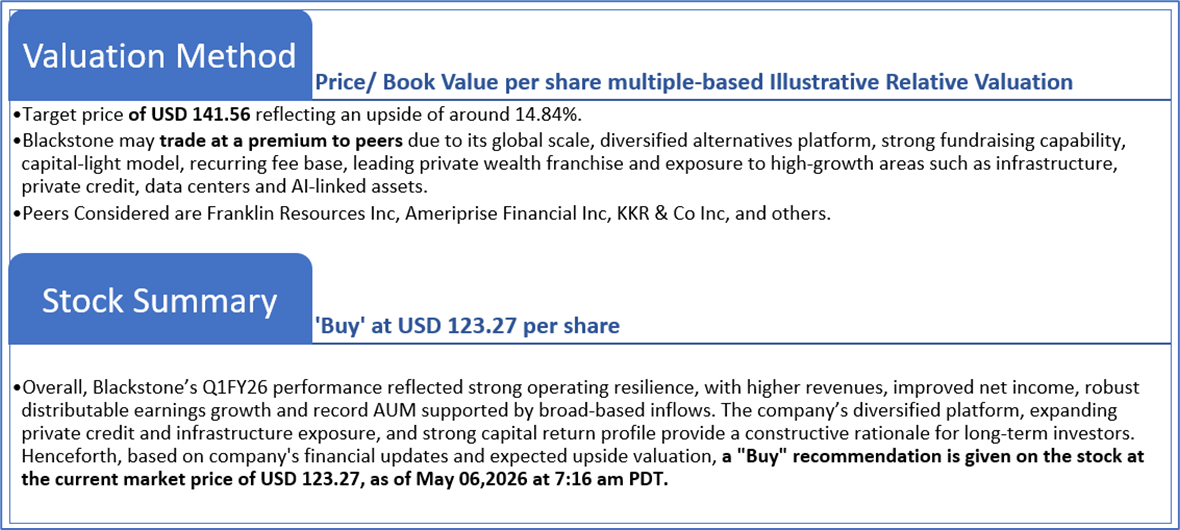
Markets are trading in a highly volatile zone currently due to certain macroeconomic issues and geopolitical tensions prevailing. Therefore, it is prudent to follow a cautious approach while investing.
Note 1: Past performance is not a reliable indicator of future performance.
Note 2: The reference date for all price data, currency, technical indicators, support, and resistance levels is May 06, 2026. The reference data in this report has been partly sourced from REFINITIV.
Note 3: Investment decisions should be made depending on an individual's appetite for upside potential, risks, holding duration, and any previous holdings. An 'Exit' from the stock can be considered if the Target Price mentioned as per the Valuation and or the technical levels provided has been achieved and is subject to the factors discussed above.
Note 4: The report publishing date is as per the Pacific Time Zone.
Technical Indicators Defined: -
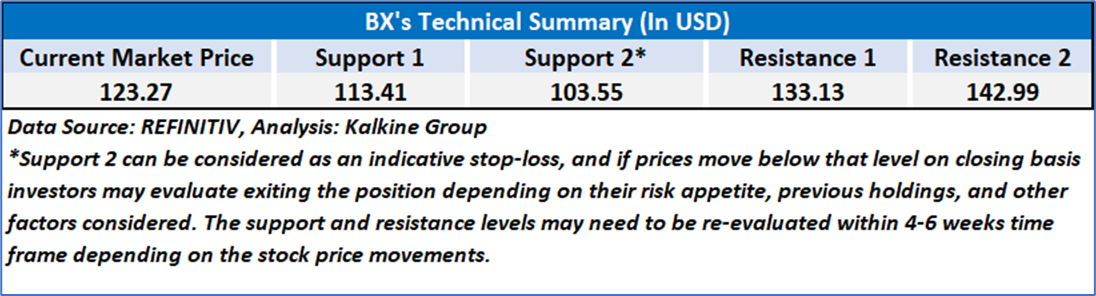
Support: A level at which the stock prices tend to find support if they are falling, and a downtrend may take a pause backed by demand or buying interest. Support 1 refers to the nearby support level for the stock and if the price breaches the level, then Support 2 may act as the crucial support level for the stock.
Resistance: A level at which the stock prices tend to find resistance when they are rising, and an uptrend may take a pause due to profit booking or selling interest. Resistance 1 refers to the nearby resistance level for the stock and if the price surpasses the level, then Resistance 2 may act as the crucial resistance level for the stock.
Stop-loss: It is a level to protect against further losses in case of unfavorable movement in the stock prices.
Past performance is not a reliable indicator of future performance.

 NZ
 UK
 US
 AU
 IND

 CA

 Please wait processing your request...