Section 1: Company Overview and Fundamentals
1.1 Company Overview:
Blue Owl Capital Inc (NYSE: OWL) is an alternative asset manager that deploys private capital across three core platforms—Credit, GP Strategic Capital, and Real Estate—serving both institutional and private wealth clients. The firm provides private financing solutions to upper-middle-market companies, invests in stakes and financing for private capital firms, and focuses on acquiring triple net lease real estate backed by creditworthy tenants. Its products are structured through vehicles such as BDCs, private funds, REITs, CLOs, and managed accounts, with a strong presence in permanent capital strategies and insurance-related asset management services.
Kalkine’s Diversified Opportunities Report covers the Company Overview, Key positives & negatives, Investment summary, Key investment metrics, Top 10 shareholding, Business updates and insights into company recent financial results, Key Risks & Outlook, Price performance and technical summary, Target Price, and Recommendation on the stock.
Stock Performance:
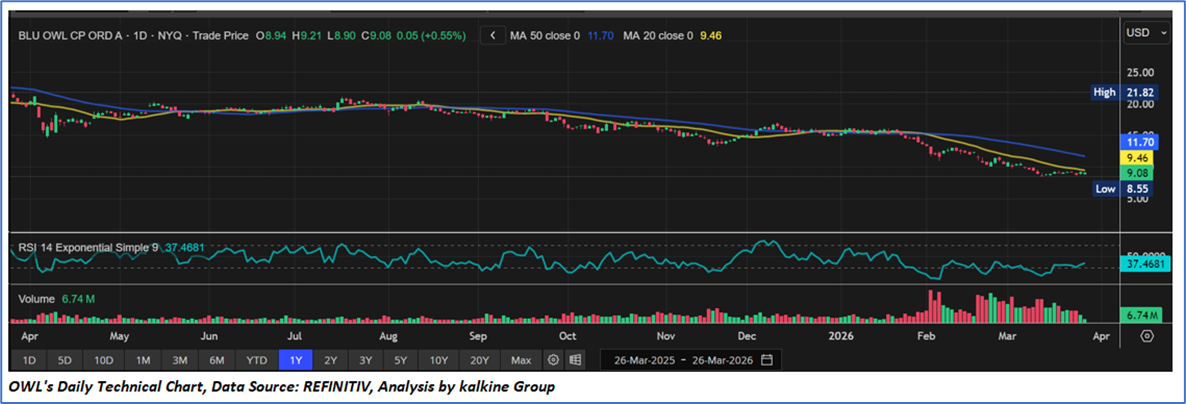
- The stock has been in a clear downtrend over the past year, characterized by consistent lower highs and lower lows, indicating persistent selling pressure.
- The current price (USD 9.08) trades below both the 20-day MA (USD 9.46) and 50-day MA (USD 11.70), reinforcing a bearish trend and lack of near-term strength.
- The 20-day MA is acting as immediate resistance, while the 50-day MA represents a stronger overhead resistance zone, limiting upside attempts.
- RSI is around ~37, remaining below the neutral 50 level, suggesting subdued momentum and no clear signs of bullish reversal yet.
- Periodic spikes in volume during price declines suggest distribution phases, with sellers dominating rallies.
1.2 The Key Positives, Negatives, and Investment summary
1.3 Top 10 shareholders:
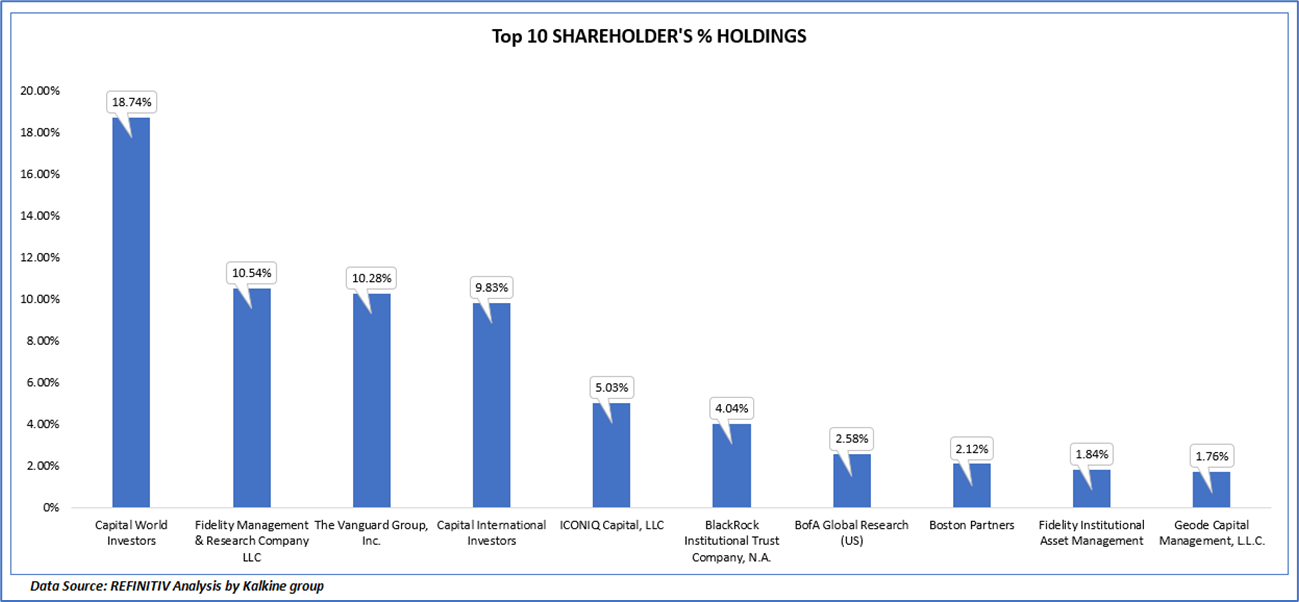
The top 10 shareholders together form ~ 66.76% of the total shareholding, signifying concentrated shareholding. Capital World Investors and Fidelity Management & Research Company LLC are the biggest shareholders, holding the maximum stake in the company at 18.74% and 10.54%, respectively.
1.4 Key Metrics:
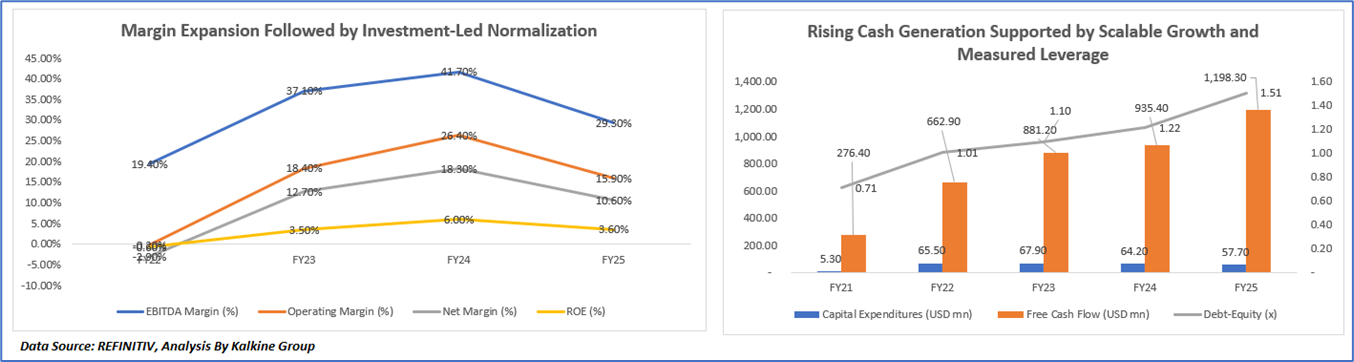
Margin Expansion Followed by Investment-Led Normalization
The margin trajectory reflects a transition from early-stage scaling to peak operating leverage and subsequent normalization. In FY22, profitability remained subdued due to platform build-out, acquisition integration, and macro volatility. Margins expanded sharply through FY23 and peaked in FY24, supported by strong AUM growth, rising fee-paying capital, record fundraising, and operating leverage from a largely fixed-cost model with recurring fee streams. However, in FY25, margins moderated as the company entered an investment phase, with higher compensation, distribution expansion, product innovation, and acquisition-related amortization costs outpacing revenue growth. While EBITDA remained relatively resilient, net margins and ROE declined due to lower earnings conversion, reflecting elevated non-cash and structural expenses. Overall, the trend indicates a structurally strong business model experiencing temporary margin compression as it reinvests for long-term growth.
Rising Cash Generation Supported by Scalable Growth and Measured Leverage
The trend illustrates a consistent expansion in free cash flow alongside a gradual increase in leverage, driven by Blue Owl’s scalable, fee-based business model. Free cash flow grew steadily from FY21 to FY25, supported by strong AUM growth, rising fee-paying capital, and sustained fundraising momentum across institutional and private wealth channels, while the asset-light structure kept capital expenditures relatively low and stable despite ongoing platform and technology investments. At the same time, the increase in the debt-to-equity ratio reflects a calibrated use of leverage to fund acquisitions, expand capabilities, and support long-term growth initiatives, indicating a balance between strong internal cash generation and strategic balance sheet utilization.
Section 2: Business Updates and Corporate Business Highlights
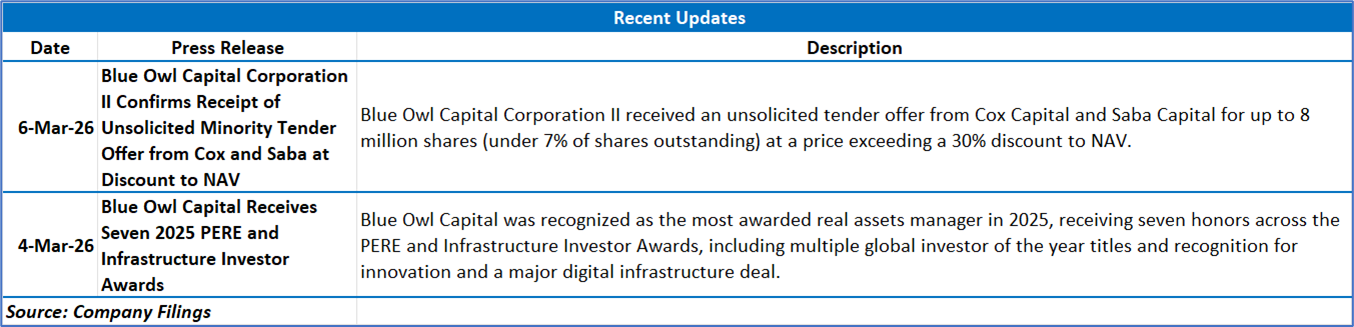
2.1 Recent Business Updates
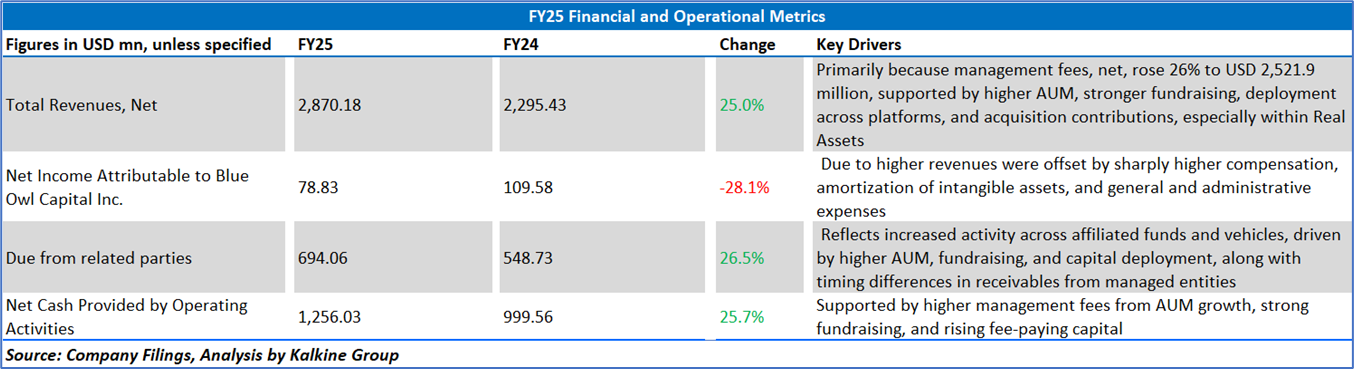
2.2 Insights of FY25:
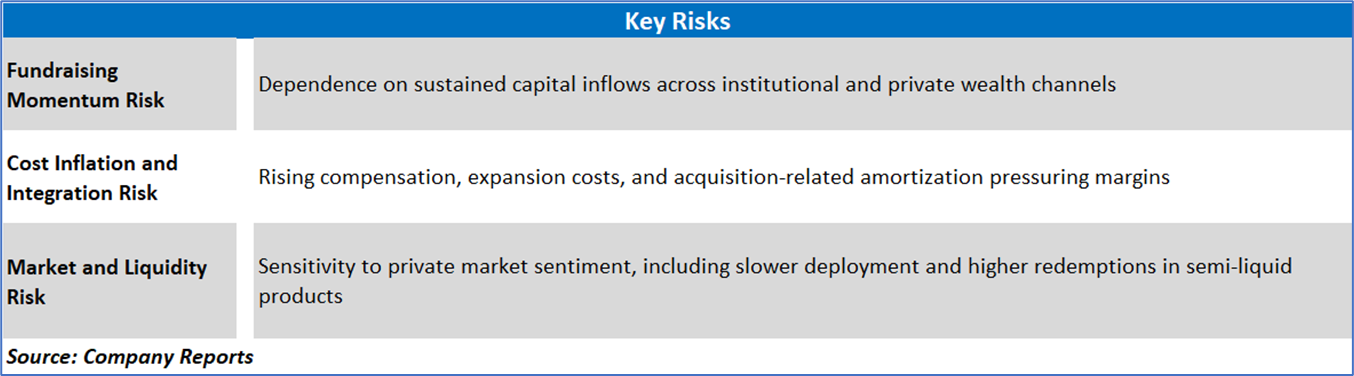
Section 3: Key Risks & Outlook
Section 4: Stock Recommendation Summary:
4.1 Price Performance and Technical Summary:
Stock Performance:
- The stock has been in a clear downtrend over the past year, characterized by consistent lower highs and lower lows, indicating persistent selling pressure.
- The current price (USD 9.08) trades below both the 20-day MA (USD 9.46) and 50-day MA (USD 11.70), reinforcing a bearish trend and lack of near-term strength.
- The 20-day MA is acting as immediate resistance, while the 50-day MA represents a stronger overhead resistance zone, limiting upside attempts.
- RSI is around ~37, remaining below the neutral 50 level, suggesting subdued momentum and no clear signs of bullish reversal yet.
- Periodic spikes in volume during price declines suggest distribution phases, with sellers dominating rallies.
4.2 Fundamental Valuation
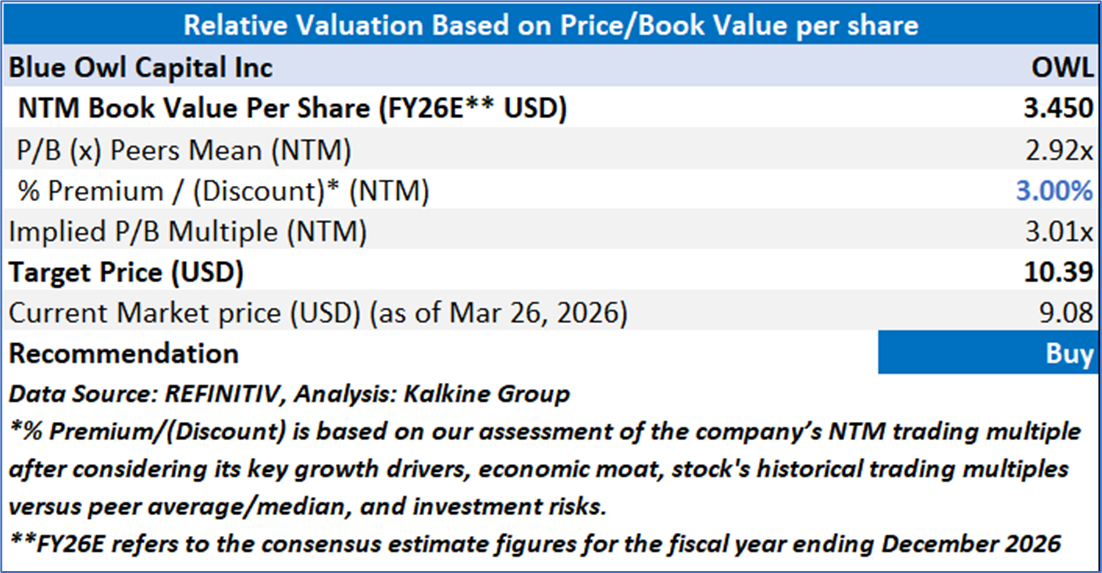
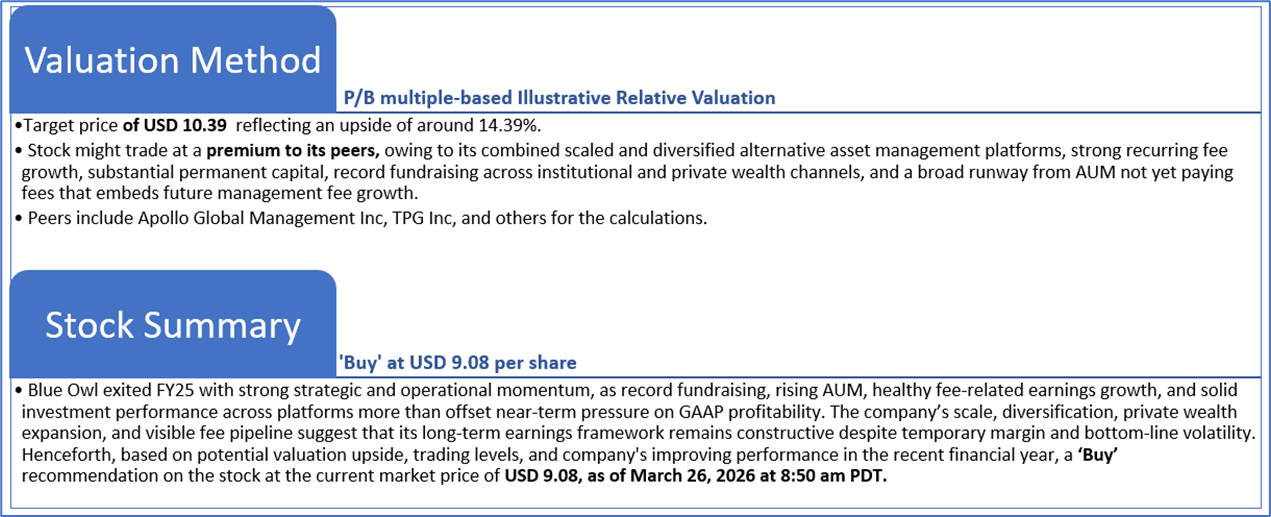
Valuation Methodology: Price/Book Value Per Share Multiple Based Relative Valuation
Markets are trading in a highly volatile zone currently due to certain macroeconomic issues and geopolitical tensions prevailing. Therefore, it is prudent to follow a cautious approach while investing.
Note 1: Past performance is not a reliable indicator of future performance.
Note 2: The reference date for all price data, currency, technical indicators, support, and resistance levels is March 26, 2026. The reference data in this report has been partly sourced from REFINITIV.
Note 3: Investment decisions should be made depending on an individual's appetite for upside potential, risks, holding duration, and any previous holdings. An 'Exit' from the stock can be considered if the Target Price mentioned as per the Valuation and or the technical levels provided has been achieved and is subject to the factors discussed above.
Note 4: The report publishing date is as per the Pacific Time Zone.
Technical Indicators Defined: -
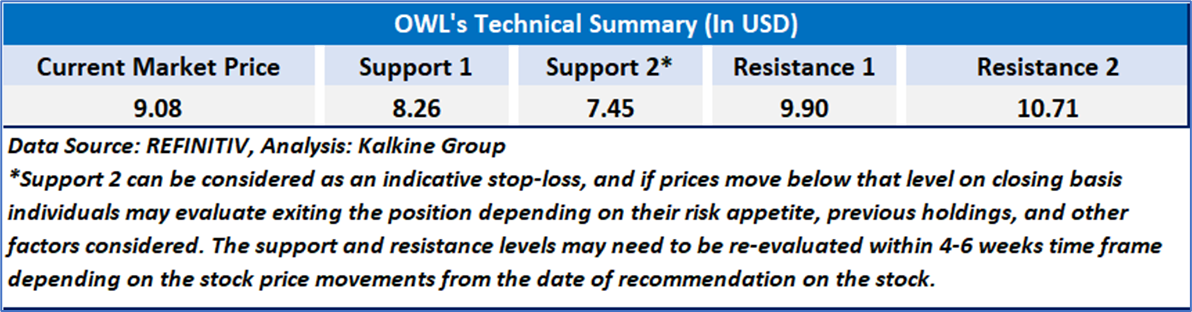
Support: A level at which the stock prices tend to find support if they are falling, and a downtrend may take a pause backed by demand or buying interest. Support 1 refers to the nearby support level for the stock and if the price breaches the level, then Support 2 may act as the crucial support level for the stock.
Resistance: A level at which the stock prices tend to find resistance when they are rising, and an uptrend may take a pause due to profit booking or selling interest. Resistance 1 refers to the nearby resistance level for the stock and if the price surpasses the level, then Resistance 2 may act as the crucial resistance level for the stock.
Stop-loss: It is a level to protect against further losses in case of unfavorable movement in the stock prices.
Past performance is not a reliable indicator of future performance.

 NZ
 UK
 US
 AU
 IND

 CA

 Please wait processing your request...