Section1: Company Overview and Fundamental Insights:

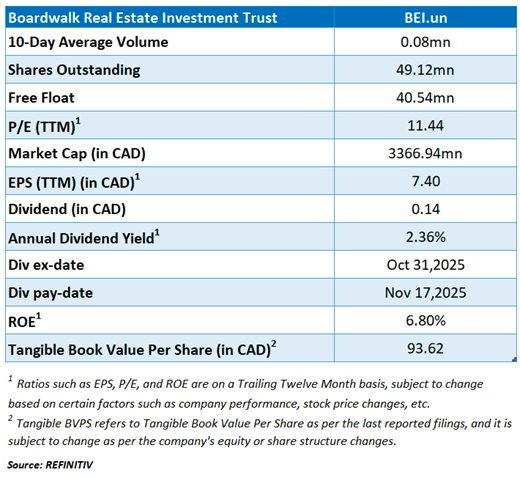
Boardwalk Real Estate Investment Trust (TSX: BEI.UN) is a real estate investment trust engaged in the acquisition, development, and management of residential multifamily communities throughout Canada. Although the company's cumulative residential property portfolio includes holdings in the provinces of Alberta, Saskatchewan, Ontario, and Quebec, the majority of its total units are located in Alberta. The submarkets around the cities of Calgary and Edmonton, specifically, account for the majority of Boardwalk REIT's total residential suites. The company derives substantially all of its income in the form of rental revenue from leasing its properties to tenants under short-term agreements. Boardwalk REIT's assets in Alberta contribute the majority of this revenue
Kalkine’s Real Estate Report covers the Investment Highlights, Key Financial Metrics, Risks, Technical Analysis along with the Valuation, Target Price, and Recommendation on the stock.


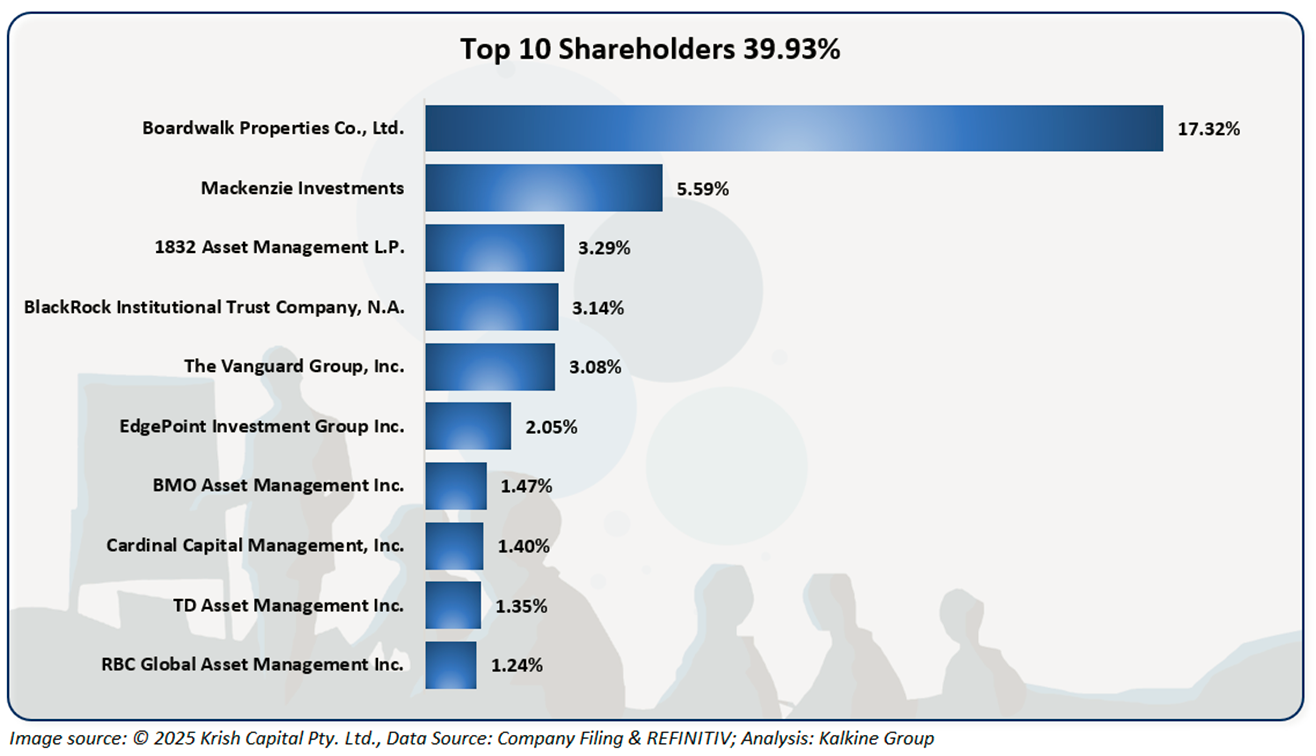
The top 10 shareholders together form ~39.93% of the total shareholding. Boardwalk Properties Co., Ltd. and Mackenzie Investments. hold a maximum stake in the company at ~17.32% and ~5.59%, respectively.

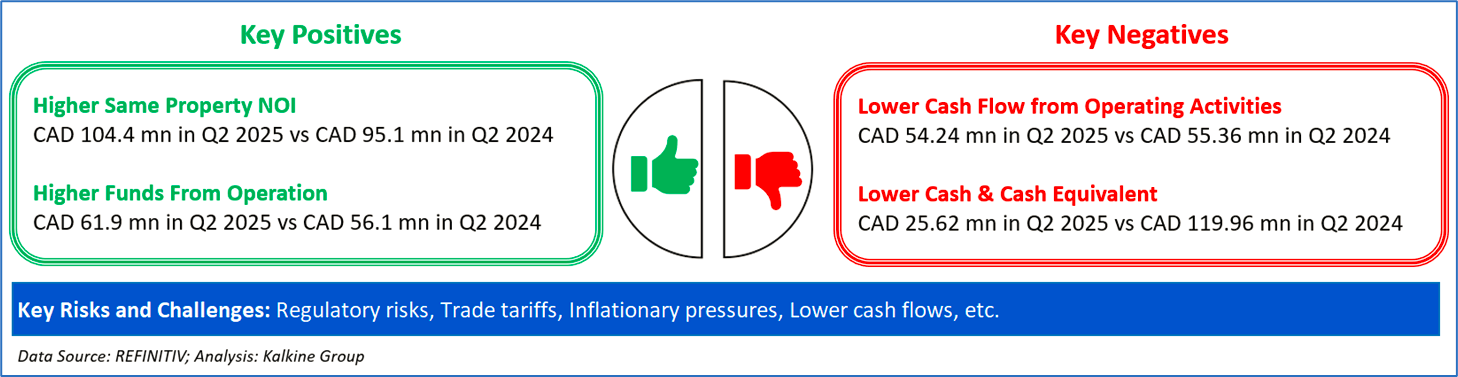
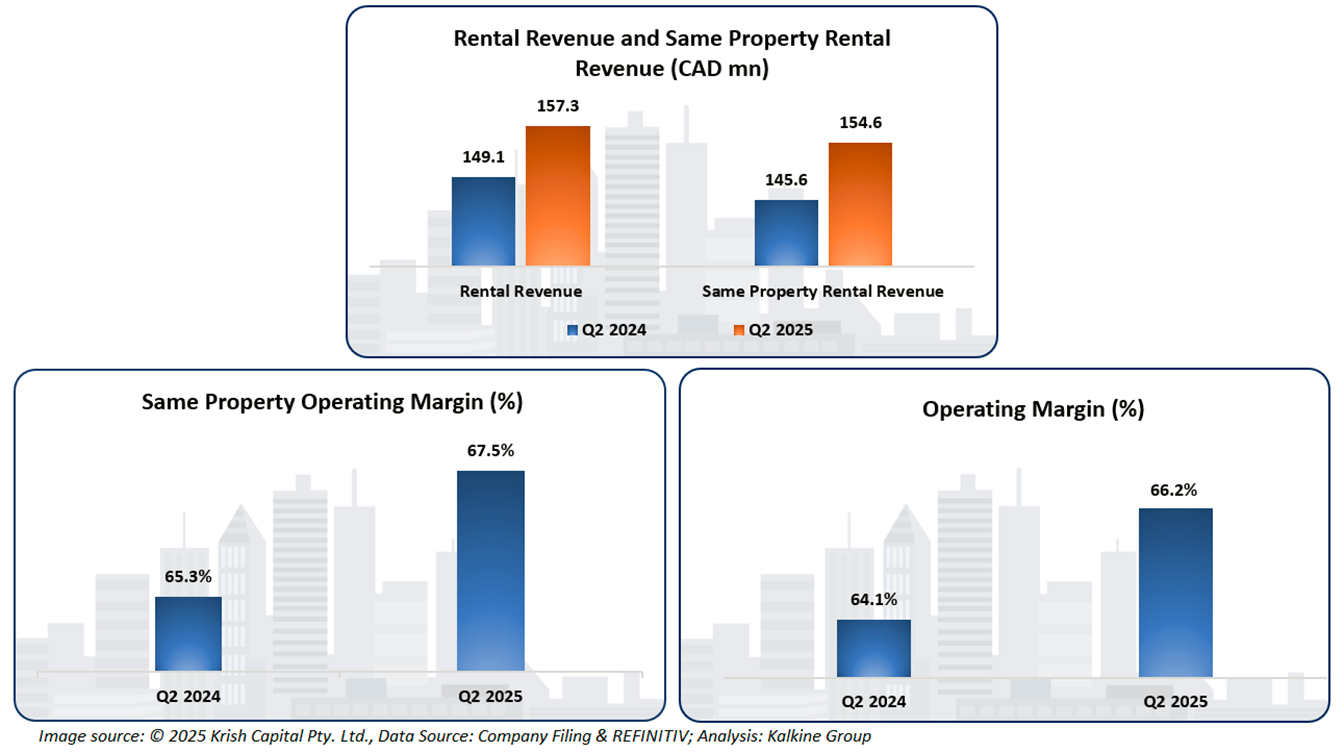
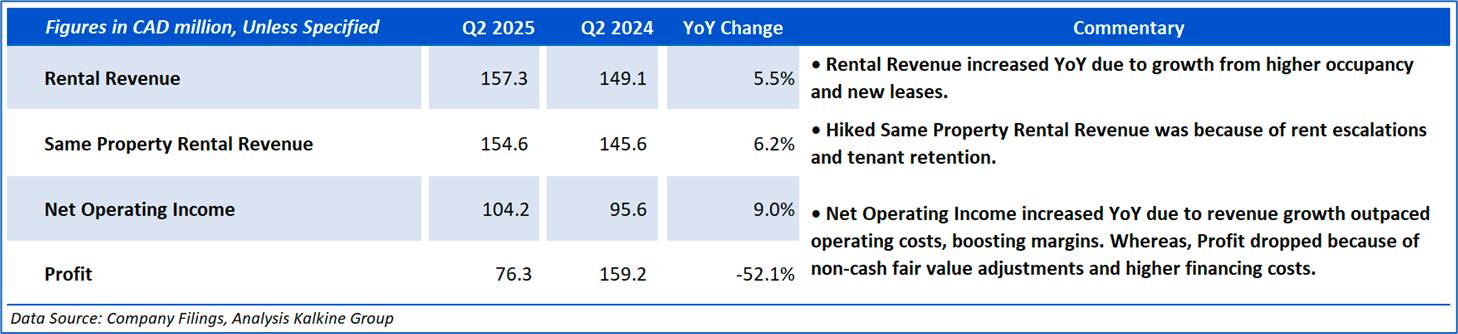
The company reported rising financials in Q2 2025, where it clocked healthy growth under its Rental Revenue and Same Property Rental Revenue, which is a key positive. Furthermore, it witnessed improving Operating Margin and elevated Same Property Operating Margin, highlighting its strengthening profitability and operational momentum.
Section 2: Business Updates and Financial Highlights

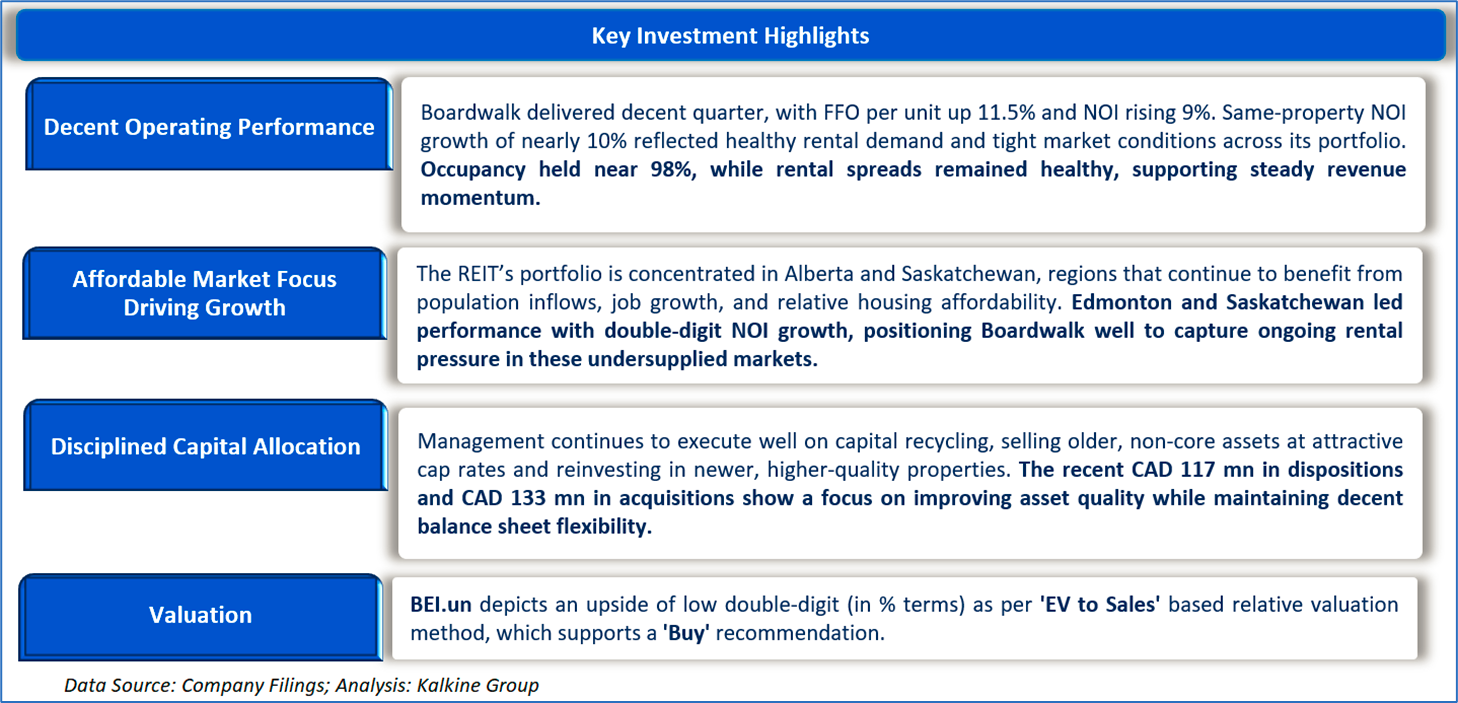
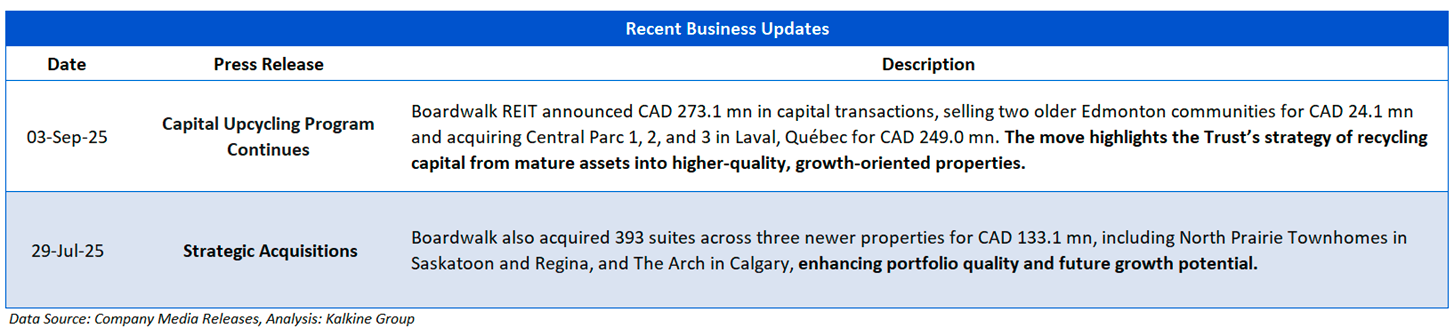
The picture below gives an overview of the company’s recent activities, such as an announcement regarding Capital Upcycling Program Continues and Strategic Acquisitions.

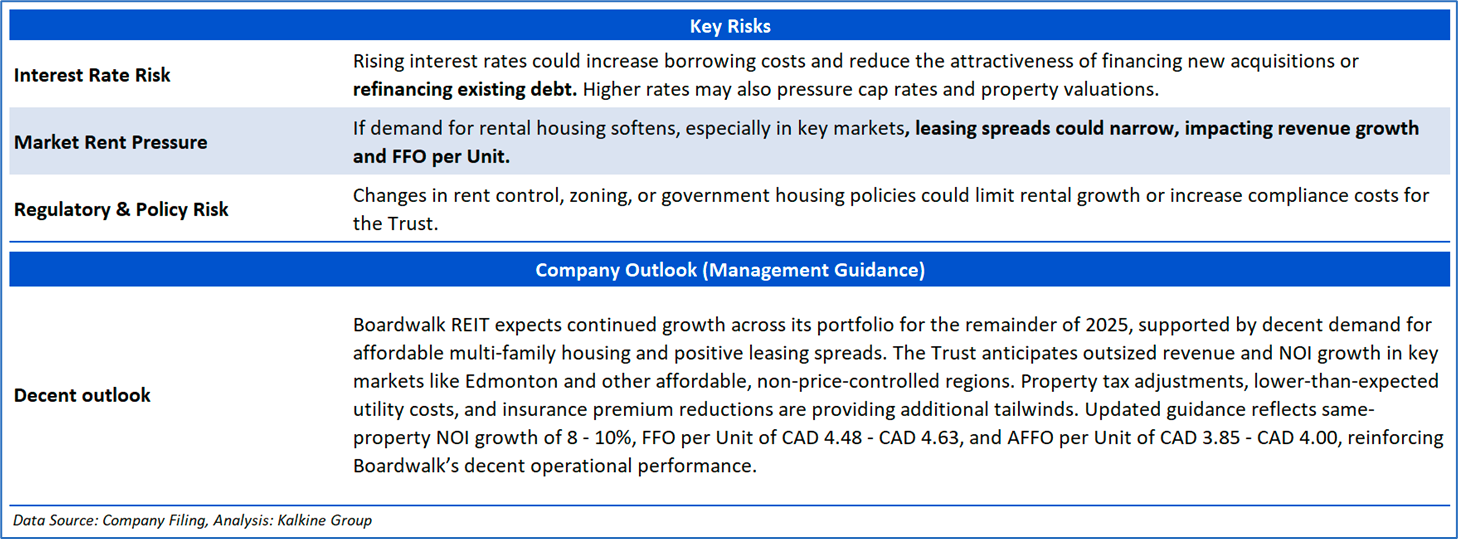
Section 3: Key Risks and Company Outlook
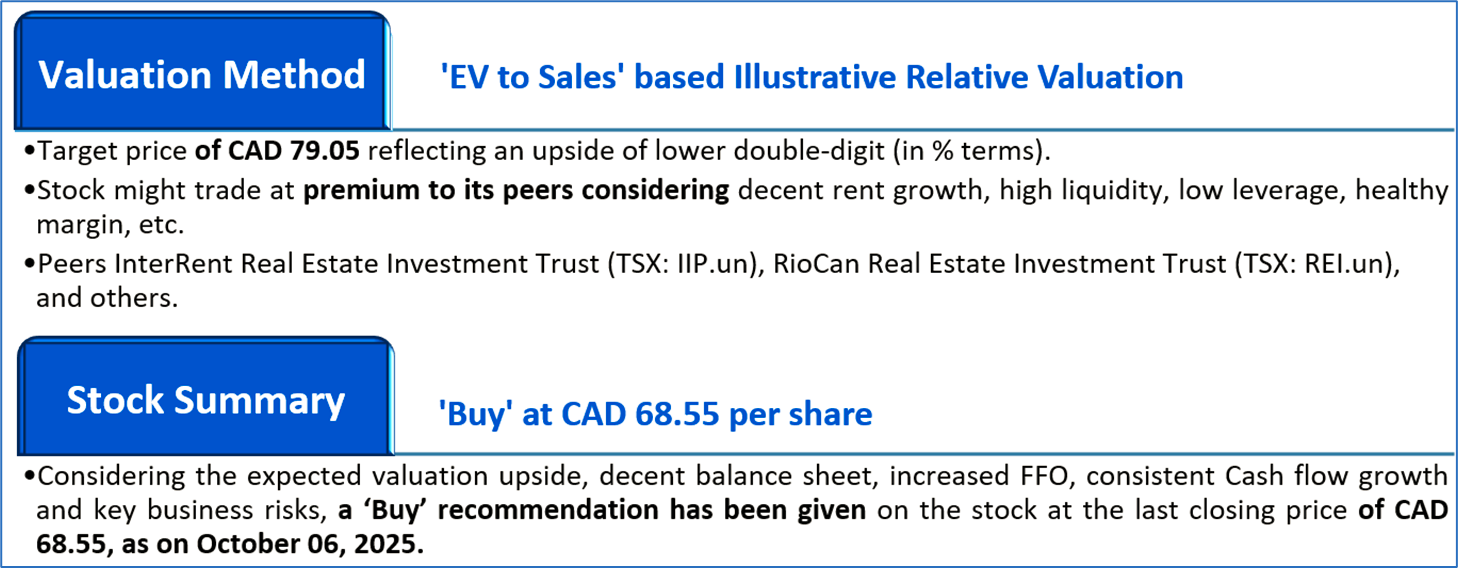
Section 4: Stock Recommendation Summary


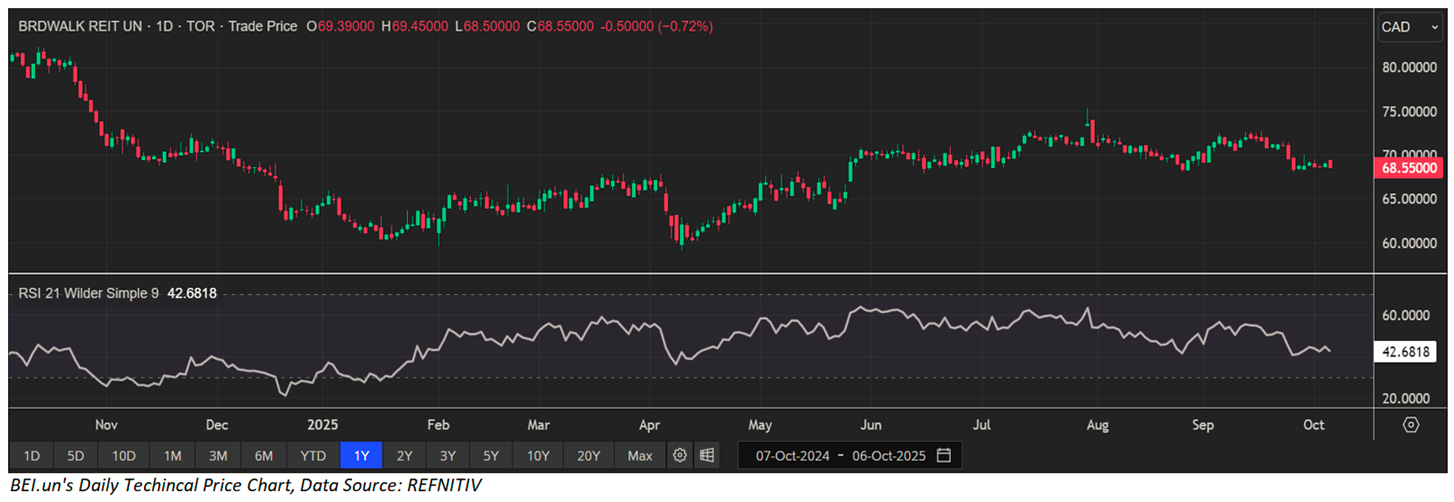
The stock has witnessed a downside of ~0.30% and an upside of ~10.54% over the last 1 week and 6 months respectively. Moreover, it is trading below the average 52-week high price of CAD 82.30 and 52-week low price of CAD 59.10, providing an opportunity to accumulate the stock.

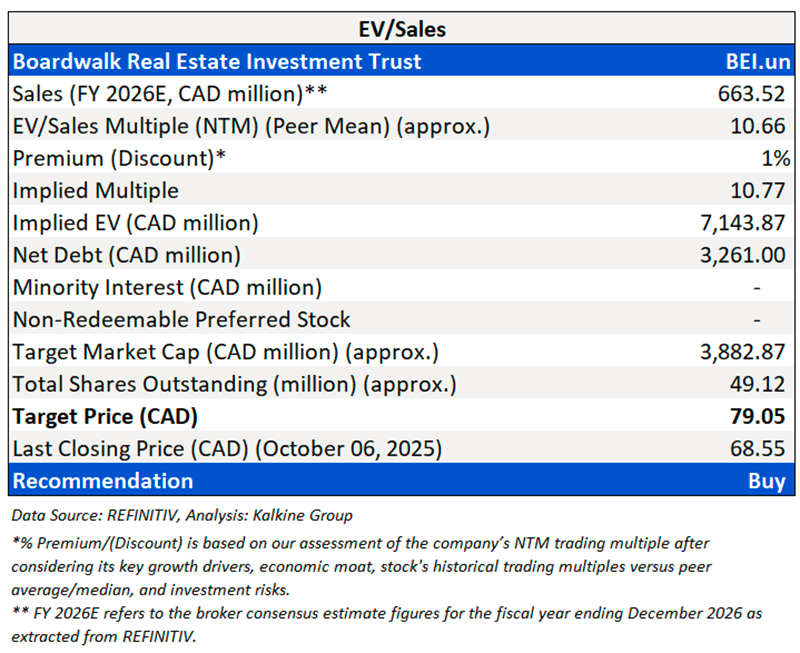
Valuation Methodology: EV to Sales Multiple Based Relative Valuation (Illustrative):
Markets are trading in a highly volatile zone currently due to certain macroeconomic issues and geopolitical tensions prevailing. Therefore, it is prudent to follow a cautious approach while investing.
Note 1: Past performance is not a reliable indicator of future performance.
Note 2: The reference date for all price data, currency, technical indicators, support, and resistance levels is October 06, 2025. The reference data in this report has been partly sourced from REFINITIV.
Note 3: Investment decisions should be made depending on an individual's appetite for upside potential, risks, holding duration, and any previous holdings. An 'Exit' from the stock can be considered if the Target Price mentioned as per the Valuation and or the technical levels provided has been achieved and is subject to the factors discussed above.
Note 4: Dividend Yield may vary as per the stock price movement.
Note 5: Kalkine reports are prepared based on the stock prices captured either from REFINITIV or Trading View. Typically, REFINITIV or Trading View may reflect stock prices with a delay which could be a lag of 25-30 minutes. There can be no assurance that future results or events will be consistent with the information provided in the report. The information is subject to change without any prior notice.
Technical Indicators Defined: -
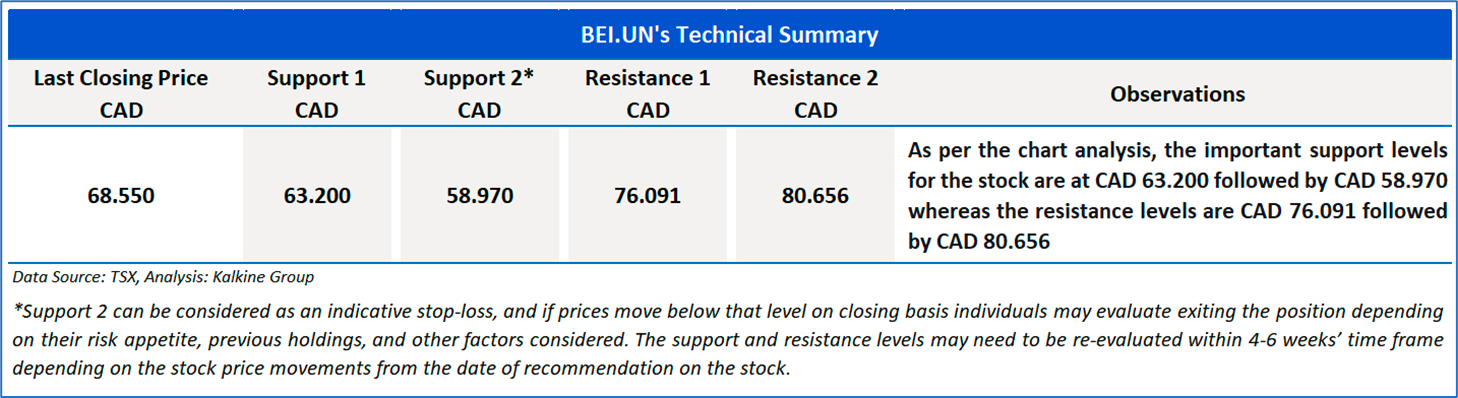
Support: A level at which the stock prices tend to find support if they are falling, and a downtrend may take a pause backed by demand or buying interest. Support 1 refers to the nearby support level for the stock and if the price breaches the level, then Support 2 may act as the crucial support level for the stock.
Resistance: A level at which the stock prices tend to find resistance when they are rising, and an uptrend may take a pause due to profit booking or selling interest. Resistance 1 refers to the nearby resistance level for the stock and if the price surpasses the level, then Resistance 2 may act as the crucial resistance level for the stock.
Stop-loss: It is a level to protect further losses in case of unfavourable movement in the stock prices.
Past performance is not a reliable indicator of future performance.

 Please wait processing your request...