Section 1: Introduction
- Inflation is the gradual loss in purchasing power, primarily due to an increase in the price levels of goods and services over a given period.
- The Consumer Price Index (CPI) increased by 2.6% year-over-year in February, following a 1.9% rise in January. While broad-based price growth was observed, the reinstatement of goods and services tax (GST)/harmonized sales tax (HST) on eligible products mid-month contributed to higher consumer prices, as these taxes are included in the CPI. This led to a slower decline in restaurant food prices in February (-1.4%) compared to January (-5.1%), with restaurant food being the largest driver of the CPI acceleration. Similarly, prices for alcoholic beverages purchased from stores fell by 1.4% in February, after a 3.6% decline in January.
- On a monthly basis, the CPI rose 1.1% in February. On a seasonally adjusted monthly basis, the CPI rose 0.7%.
- There are two types of inflationary trends - high and low inflation. The cycles of high and low inflation mainly depend on policy action by the Government to balance the demand and growth of the country.
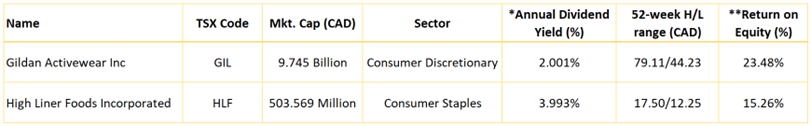
- Gildan Activewear Inc. (TSX: GIL) is a vertically integrated designer and manufacturer of basic apparel, including T-shirts, underwear, socks, and hosiery. Its primary market is the sale of blank T-shirts to wholesalers and printers (printwear). Gildan also sells branded clothing through retail and direct-to-consumer channels. Brands include Gildan, American Apparel, Comfort Colors, and Gold Toe. Gildan produces most of its clothing at factories in Latin America.
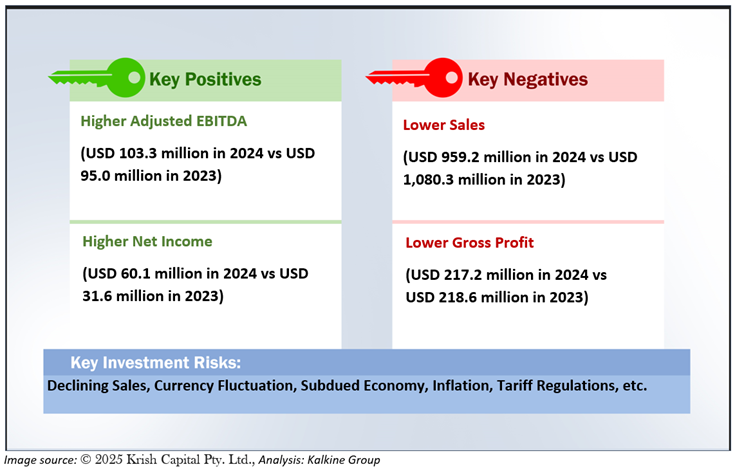
- High Liner Foods Incorporated (TSX: HLF) is a Canadian company which is mainly engaged in the processing and marketing of prepared and packaged frozen seafood products. The company sells its products to institutions, health care facilities, and quick-service family and casual dining establishments. Its foodservice brands, including High Liner Culinary, Mirabel, FPI, Viking, American Pride, High Liner, Fisher Boy, Sea Cuisine, and others, primarily focus on consumer staple products—items that consumers cannot easily defer or avoid purchasing. As these products are considered lower-beta stocks, they tend to be more resilient, with the potential to generate solid returns even in an inflationary environment.
Section 2: Company Overview
Gildan Activewear Inc. (TSX: GIL) is a vertically integrated designer and manufacturer of basic apparel, including T-shirts, underwear, socks, and hosiery. Its primary market is the sale of blank T-shirts to wholesalers and printers (print wear). Gildan also sells branded clothing through retail and direct-to-consumer channels. Brands include Gildan, American Apparel, Comfort Colors, and Gold Toe. Gildan produces most of its clothing at factories in Latin America.
Kalkine’s Inflation Report covers the Investment Highlights, Key Financial Metrics, Risks, Technical Analysis along with the Valuation, Target Price, and Recommendation on the stock.
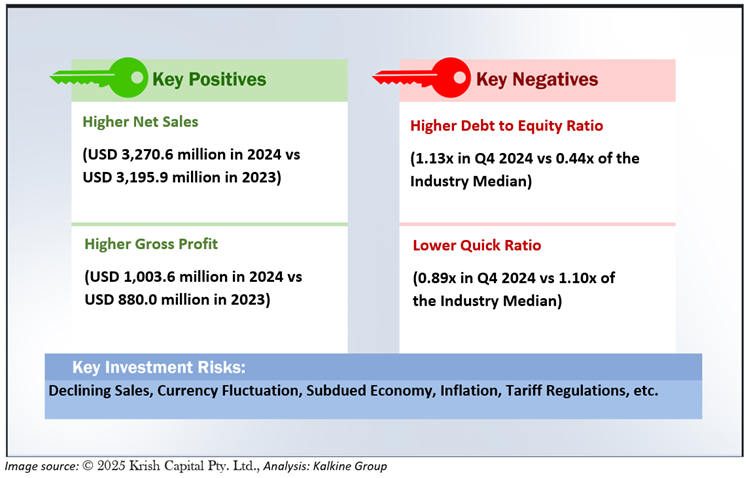
2.1 The Key Positives, Negatives, Investment Highlights, and Risks
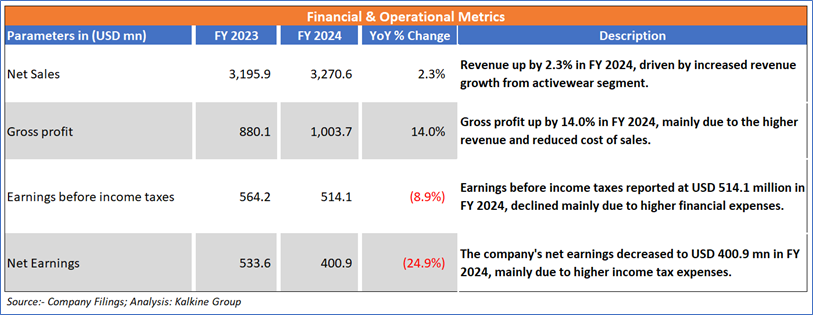
Section 3: Financial Highlights
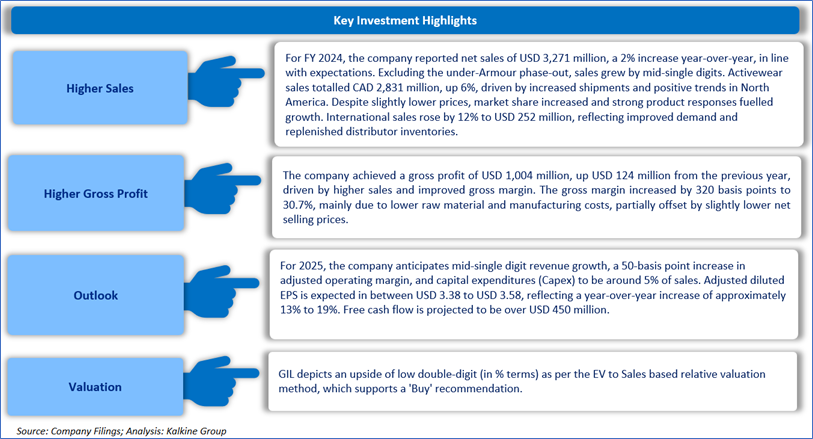
3.1 Key Financial Highlights
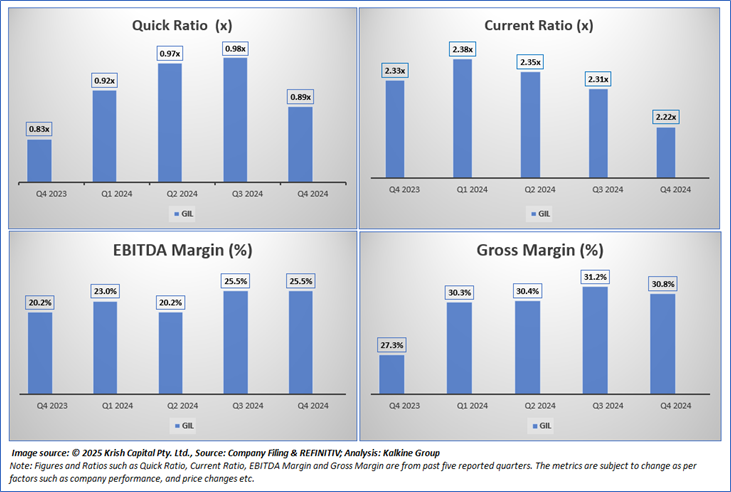
Section 4: Key Metrics
Below chart depicts the change in Quick Ratio, Current Ratio, EBITDA Margin and Gross Margin of the Company for the last five reported quarters.
Section 5: Stock Recommendation Summary
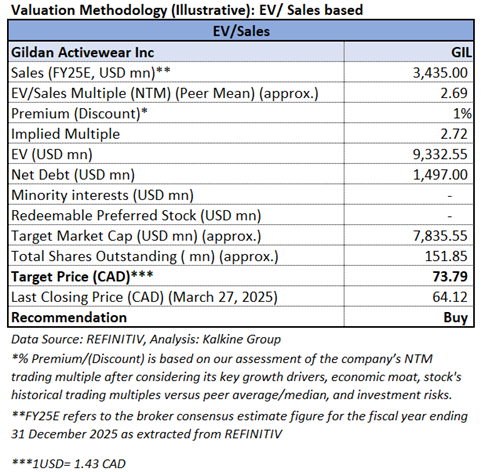
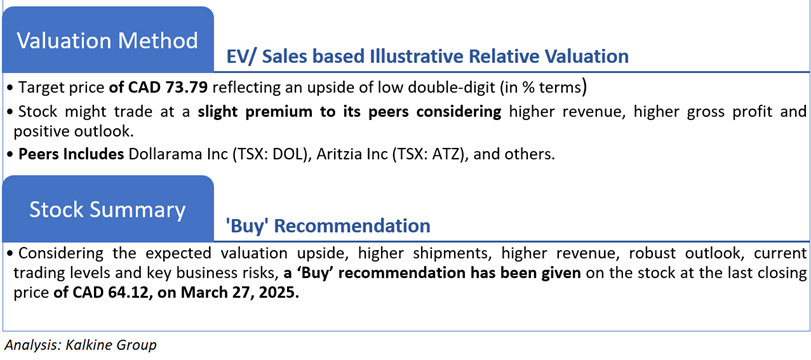
5.1 Valuation Methodology Illustrative EV to Sales Based
5.2 Price Performance and Stock Recommendation

The stock has witnessed a downside of ~17.72% in 1 month and of ~4.69% over the last 3 months. Moreover, the stock is trading above the average of the 52-week high price of CAD 79.11 and the 52-week low price of CAD 44.23, providing an opportunity to ride the trend.
5.3 One-Year Technical Price Chart
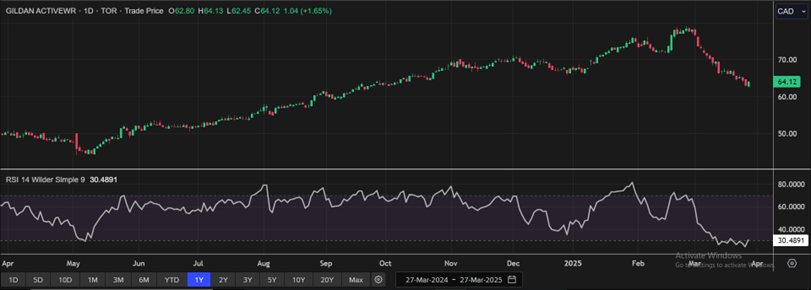
One-Year Technical Price Chart (as of March 27, 2025). Source: REFINITIV, Analysis: Kalkine Group
5.4 Technical Summary
High Liner Foods Incorporated
Section 1: Company Overview
High Liner Foods Incorporated (TSX: HLF) is a Canadian company which is mainly engaged in the processing and marketing of prepared and packaged frozen seafood products. The company sells its products to institutions, health care facilities, and quick-service family and casual dining establishments. Its foodservice brands include High Liner Culinary, Mirabel, FPI, Viking, American Pride, High Liner, Fisher Boy, Sea Cuisine and others. Kalkine’s Inflation Report covers the Investment Highlights, Key Financial Metrics, Risks, Technical Analysis along with the Valuation, Target Price, and Recommendation on the stock.
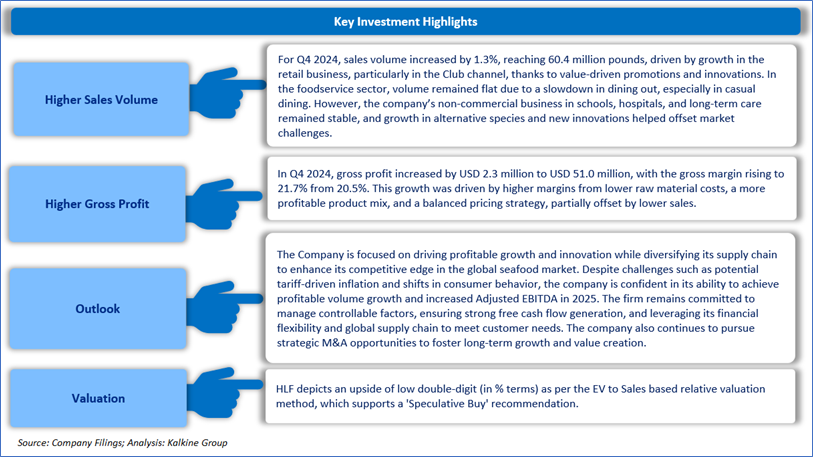
1.1 The Key Positives, Negatives, Investment Highlights, and Risks
Section2: Financial Highlights
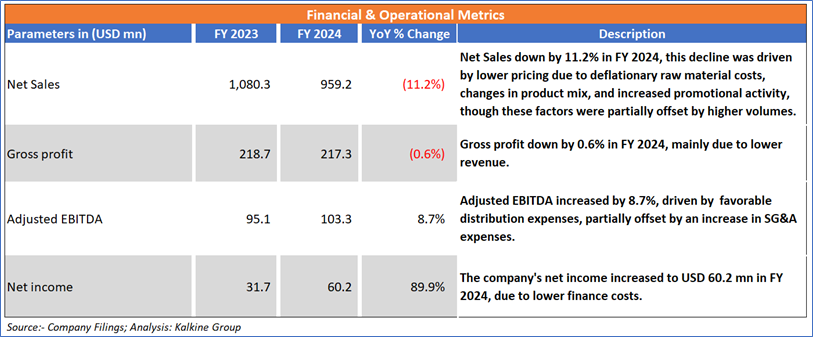
2.1 Key Financial Highlights
Section 3: Key Metrics
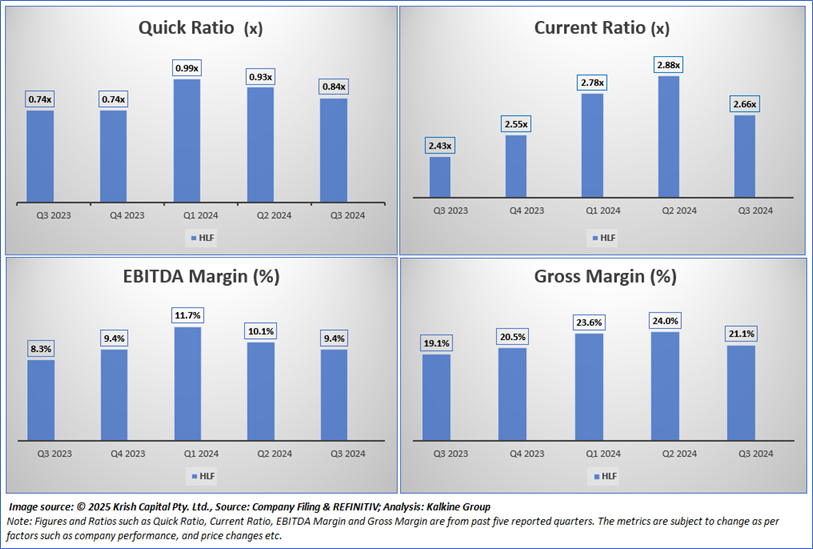
Below chart depicts the change in Quick Ratio, Current Ratio, EBITDA Margin and Gross Margin of the Company for the last five reported quarters.
Section 4: Stock Recommendation Summary
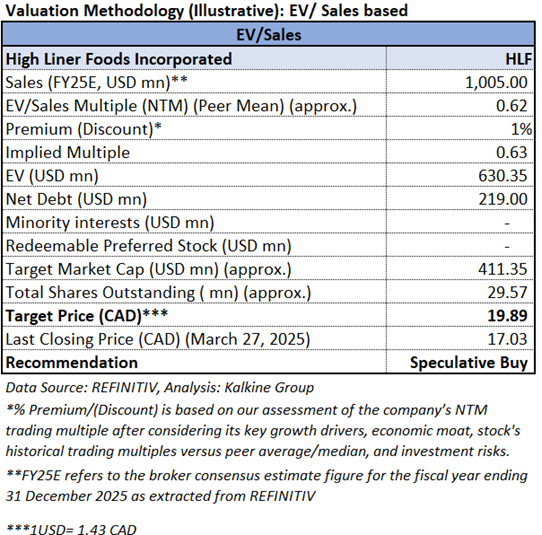
4.1 Valuation Methodology Illustrative EV to Sales Based
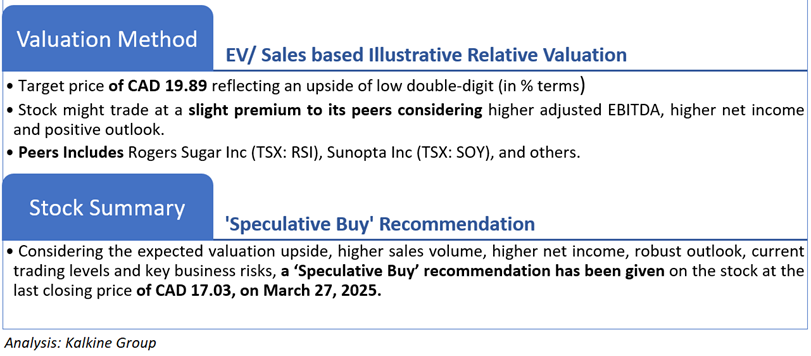
4.2 Price Performance and Stock Recommendation

The stock has witnessed an upside of ~8.12% in 1 month and an upside of ~8.81% over the last 3 months. Moreover, the stock is trading above the average 52-week high price of CAD 17.50 and 52-week low price of CAD 12.25, providing an opportunity to ride the trend.
4.3 One-Year Technical Price Chart
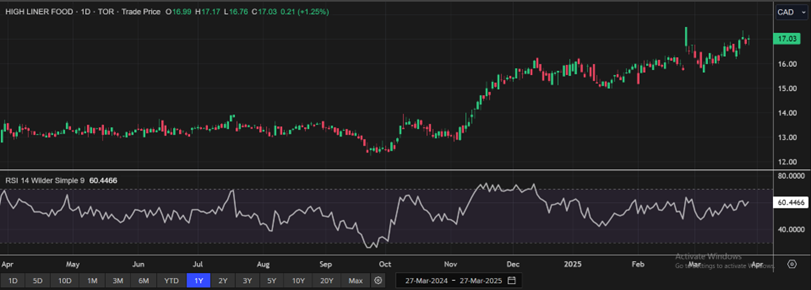
One-Year Technical Price Chart (as of March 27, 2025). Source: REFINITIV, Analysis: Kalkine Group
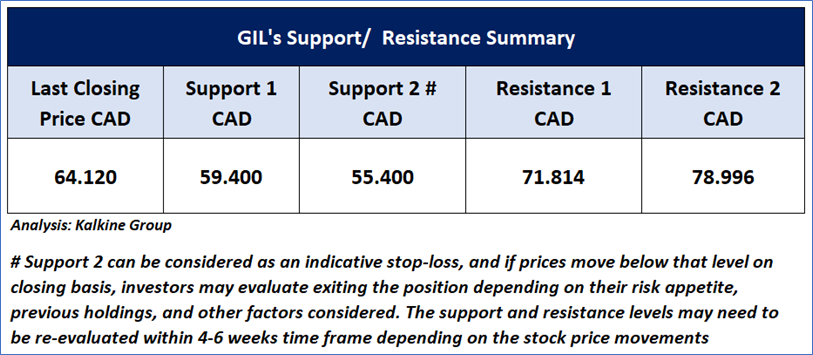
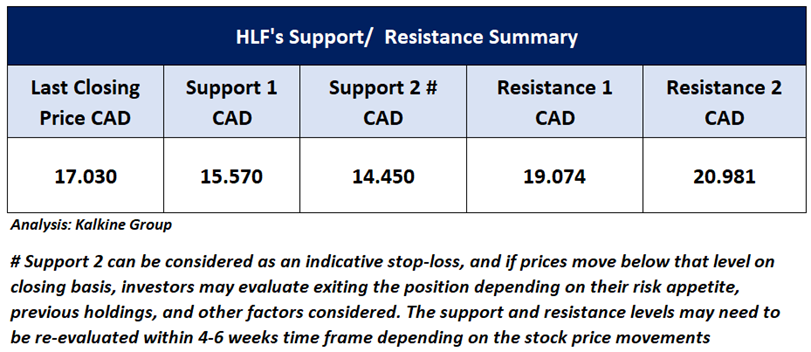
4.4 Technical Summary
Note 1: Past performance is not a reliable indicator of future performance.
Note 2: The reference date for all price data, currency, technical indicators, support, and resistance levels is March 27, 2025. The reference data in this report has been partly sourced from REFINITIV.
Note 3: Investment decisions should be made depending on an individual's appetite for upside potential, risks, holding duration, and any previous holdings. An 'Exit' from the stock can be considered if the Target Price mentioned as per the Valuation and or the technical levels provided has been achieved and is subject to the factors discussed above.
Note 4: Dividend Yield may vary as per the stock price movement.
Note 5: Kalkine reports are prepared based on the stock prices captured either from REFINITIV or Trading View. Typically, REFINITIV or Trading View may reflect stock prices with a delay which could be a lag of 25-30 minutes. There can be no assurance that future results or events will be consistent with the information provided in the report. The information is subject to change without any prior notice.’
Technical Indicators Defined: -
Support: A level at which the stock prices tend to find support if they are falling, and a downtrend may take a pause backed by demand or buying interest.
Resistance: A level at which the stock prices tend to find resistance when they are rising, and the uptrend may take a pause due to profit booking or selling interest.
Stop-loss: In general, it is a level to protect further losses in case of any unfavourable movement in the stock prices.
Past performance is not a reliable indicator of future performance.

 Please wait processing your request...