
Section 1: Company Overview and Fundamentals
1.1 Company Overview:
BW LPG Limited (NYSE: BWLP) is a Singapore-based owner and operator of liquefied petroleum gas (LPG) vessels, owning and operating very large gas carriers (VLGCs) with a total carrying capacity of over three million CBM. The Company's business includes LPG shipping, product services and infrastructure. It owns and operates a fleet of LPG-powered VLGCs. Its VLGCs are retrofitted with LPG dual-fuel propulsion technology. It provides customers with integrated LPG delivery services.
Kalkine’s Dividend Income Report covers the Company Overview, Key positives & negatives, Investment summary, Key investment metrics, Top 10 shareholding, Business updates and insights into company recent financial results, Key Risks & Outlook, Price performance and technical summary, Target Price, and Recommendation on the stock.
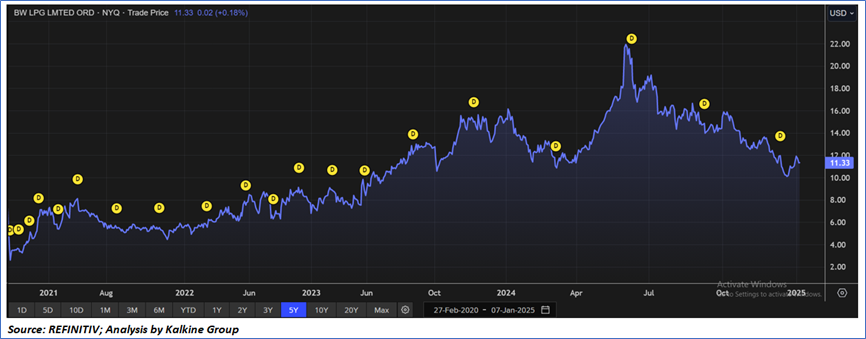
Price Performance:
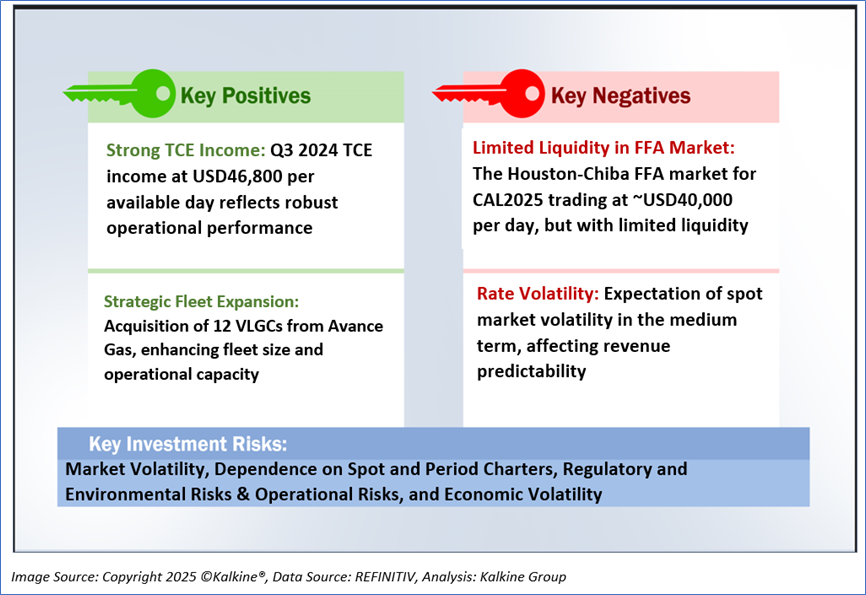
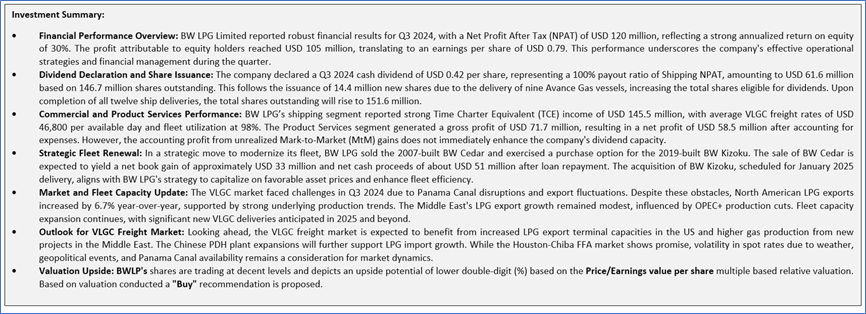
1.2 The Key Positives, Negatives, and Investment summary
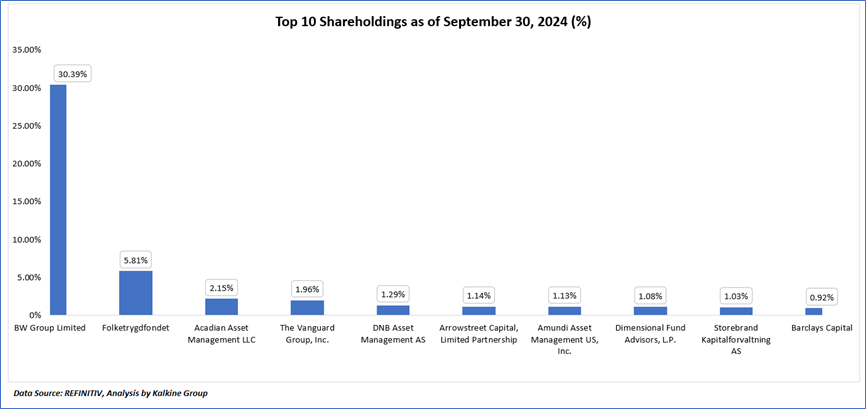
1.3 Top 10 shareholders:
The top 10 shareholders together form ~46.89% of the total shareholding, signifying concentrated shareholding. BW Group Limited and Folketrygdfondet, are the biggest shareholders, holding the maximum stake in the company at ~30.39% and ~5.81%, respectively.
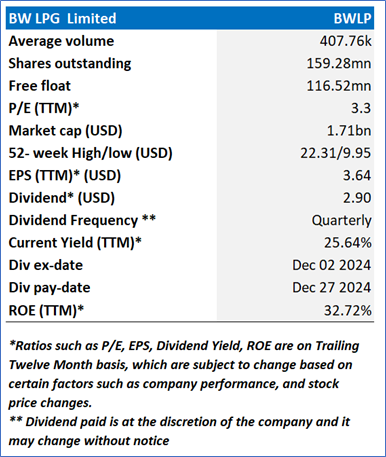
1. 4 Dividend payments with impressive dividend yield:
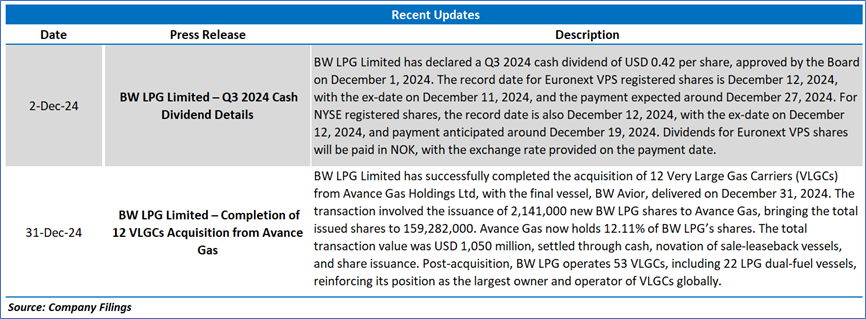
BWLP’s stock is offering a lucrative dividend yield of ~25.64%, compared to US 10-Year Bond Yield of ~4.71%, with track record of consistent dividend payment since the past 5-years. The company announced a cash dividend of USD 0.42 per share for Q3 2024, with a net dividend amount of USD 0.3276 per share after applying a 22% withholding tax. The dividend, fully qualified for QDI at 100%, is classified as an interim, quarterly dividend. The announcement date was December 2, 2024, with an ex-date of December 11, 2024, a record date of December 12, 2024, and a payment date scheduled for December 27, 2024. This consistent dividend payment reflects the company’s commitment to returning value to its shareholders, boasting an impressive dividend yield of 25.64%, while maintaining a strong financial position.
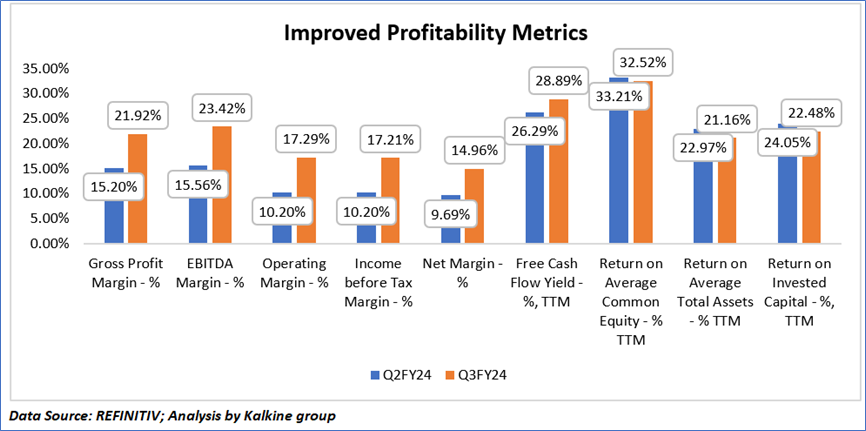
1.5 Key Metrics
In Q3FY24, BWLP exhibited a marked improvement in profitability metrics when compared to Q2FY24. The gross profit margin rose significantly from 15.20% to 21.92%, while EBITDA margin surged from 15.56% to 23.42%. Both operating margin and income before tax margin saw substantial growth, increasing from 10.20% to 17.29% and 10.20% to 17.21%, respectively. Net margin also showed an uptick, moving from 9.69% to 14.96%. The company experienced a positive increase in free cash flow yield, from 26.29% to 28.89%. However, certain return ratios saw slight declines, with return on average common equity decreasing from 33.21% to 32.52%, return on average total assets reducing from 22.97% to 21.16%, and return on invested capital declining from 24.05% to 22.48%.
Section 2: Business Updates and Financial Highlights
2.1 Recent Updates:
The below picture gives an overview of the recent updates:
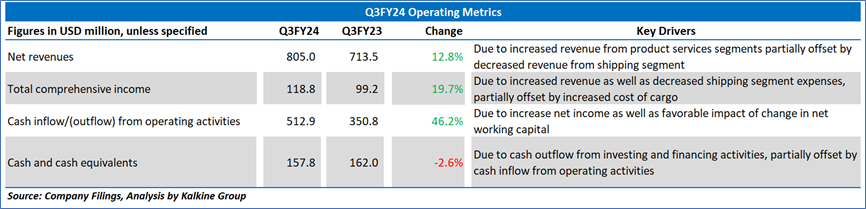
2.2 Insights of Q3FY24:
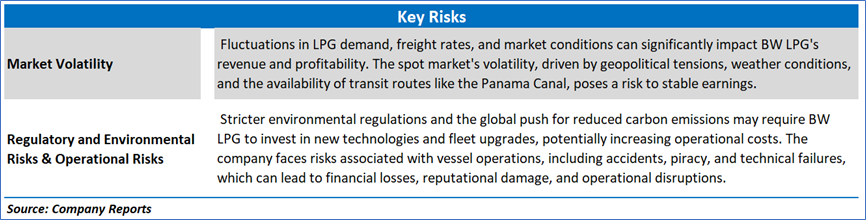
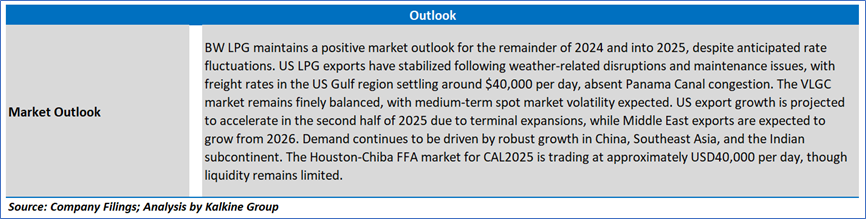
Section 3: Key Risks and Outlook:
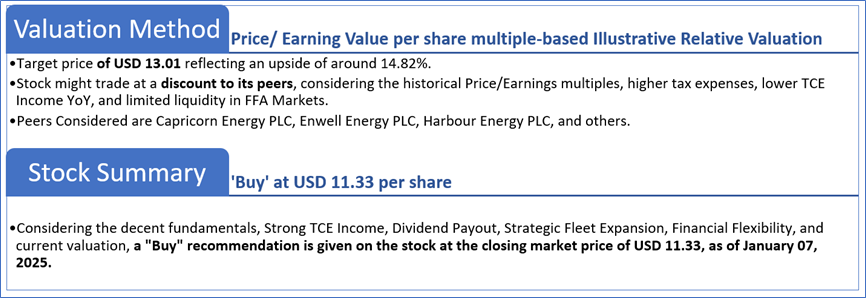
Section 4: Stock Recommendation Summary:
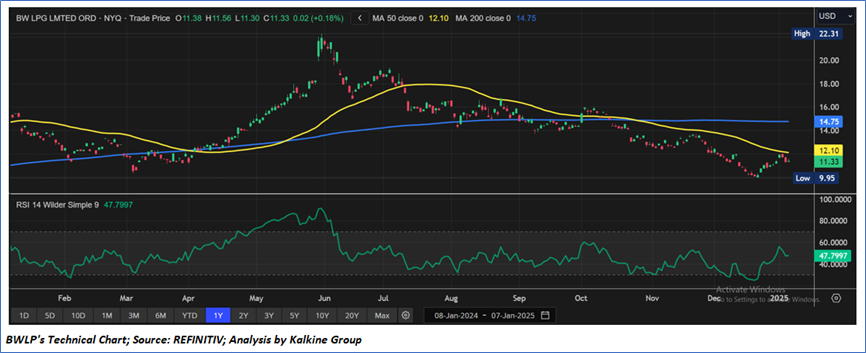
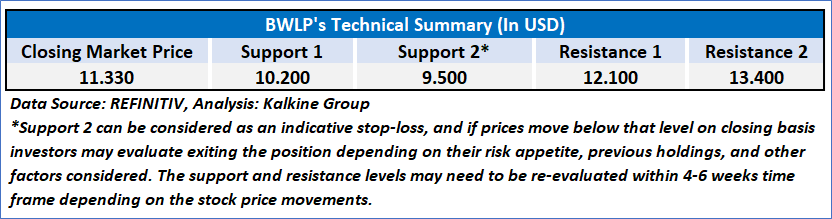
4.1 Technical Summary:
Price Performance:
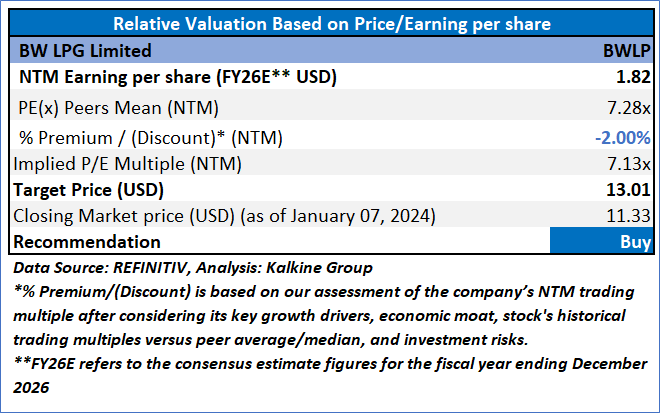
4.2 Fundamental Valuation
Valuation Methodology: Price/Earnings Per Share Multiple Based Relative Valuation
Markets are trading in a highly volatile zone currently due to certain macroeconomic issues and geopolitical tensions prevailing. Therefore, it is prudent to follow a cautious approach while investing.
Note 1: Past performance is not a reliable indicator of future performance.
Note 2: The reference date for all price data, currency, technical indicators, support, and resistance levels is January 07, 2025. The reference data in this report has been partly sourced from REFINITIV.
Note 3: Investment decisions should be made depending on an individual's appetite for upside potential, risks, holding duration, and any previous holdings. An 'Exit' from the stock can be considered if the Target Price mentioned as per the Valuation and or the technical levels provided has been achieved and is subject to the factors discussed above.
Note 4: The report publishing date is as per the Pacific Time Zone.
Technical Indicators Defined: -
Support: A level at which the stock prices tend to find support if they are falling, and a downtrend may take a pause backed by demand or buying interest. Support 1 refers to the nearby support level for the stock and if the price breaches the level, then Support 2 may act as the crucial support level for the stock.
Resistance: A level at which the stock prices tend to find resistance when they are rising, and an uptrend may take a pause due to profit booking or selling interest. Resistance 1 refers to the nearby resistance level for the stock and if the price surpasses the level, then Resistance 2 may act as the crucial resistance level for the stock.
Stop-loss: It is a level to protect against further losses in case of unfavorable movement in the stock prices.
The advice given by Kalkine Canada Advisory Services Inc. and provided on this website is general information only and it does not take into account your investment objectives, financial situation and the particular needs of any particular person. You should therefore consider whether the advice is appropriate to your investment objectives, financial situation and needs before acting upon it. You should seek advice from a financial adviser, stockbroker or other professional (including taxation and legal advice) as necessary before acting on any advice. Not all investments are appropriate for all people. The website www.kalkine.ca is published by Kalkine Canada Advisory Services Inc. The link to our Terms & Conditions has been provided please go through them. On the date of publishing this report (mentioned on the website), employees and/or associates of Kalkine do not hold positions in any of the stocks covered on the website. These stocks can change any time and readers of the reports should not consider these stocks as advice or recommendations later.
 Please wait processing your request...