Section 1: Commodity Update:
On April 4th, 2025, uranium futures fell to ~ $64 per pound, the lowest in 18 months, amid plentiful supply and uncertain demand. Speculation increased that the US may lift sanctions on Russian nuclear fuel imports, as Russia holds nearly half of the global conversion and enrichment capacity. Meanwhile, markets adjusted their projections for nuclear power demand in US data centers, influenced by developments in large language models in Europe and China. Although global uranium demand is set to rise significantly, driven by the growing need for clean energy and the expanding role of nuclear power in meeting energy targets, the resurgence of nuclear energy and the rising demand from AI-powered technologies are further boosting the need for uranium.
Data Source: Government of Canada, Trading Economics
Section 2: Company Overview and Fundamental Insights:
2.1 Company Overview:
Cameco Corporation (TSX: CCO) is one of the world's largest uranium producers. When operating at normal production, the flagship McArthur River mine in Saskatchewan accounts for roughly 50% of output in normal market conditions. Amid years of uranium price weakness, the company has reduced production, instead purchasing from the spot market to meet contracted deliveries. In the long term, Cameco has the ability increase annual uranium production by restarting shut mines and investing in new ones. In addition to its large uranium mining business, Cameco operates uranium conversion and fabrication facilities
Kalkine’s Resource Report covers the Investment Highlights, Key Financial Metrics, Risks, Technical Analysis along with the Valuation, Target Price, and Recommendation on the stock.
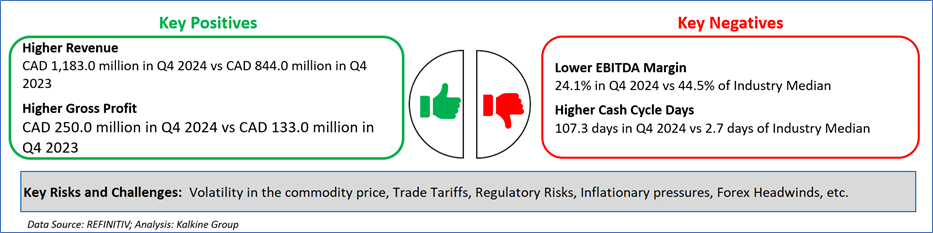
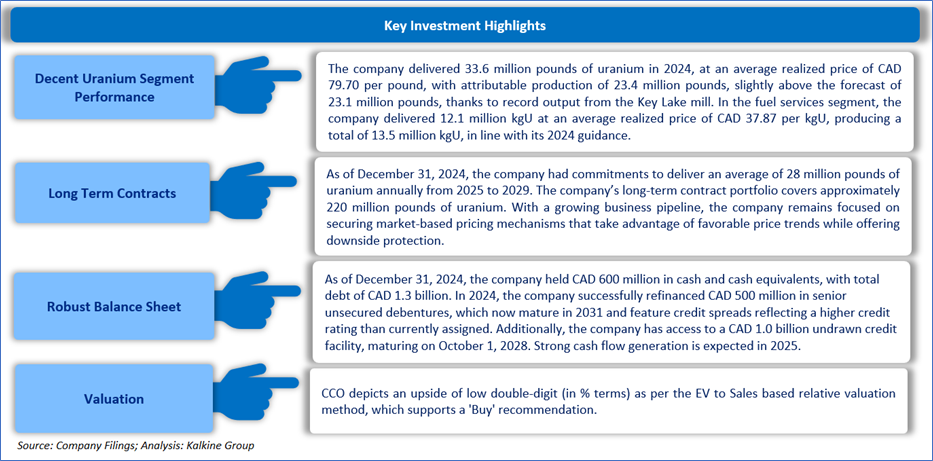
2.2 The Key Positives, Negatives, Investment Highlights and Risks
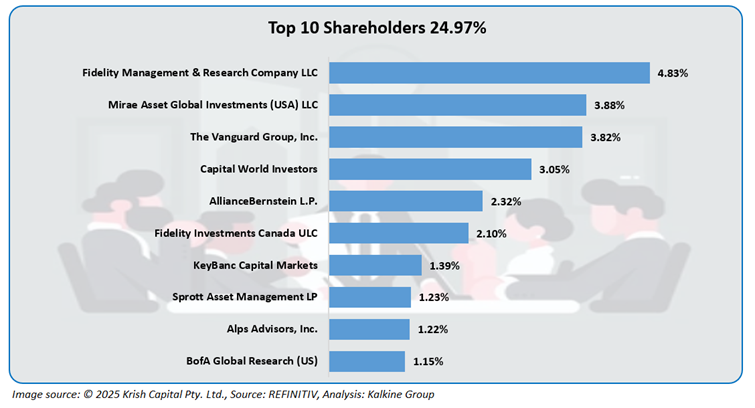
2.3 Top 10 Shareholders:
The top 10 shareholders together form ~24.97% of the total shareholding. Fidelity Management & Research Company LLC. and Mirae Asset Global Investments (USA) LLC hold a maximum stake in the company at ~4.83% and ~3.88%, respectively.
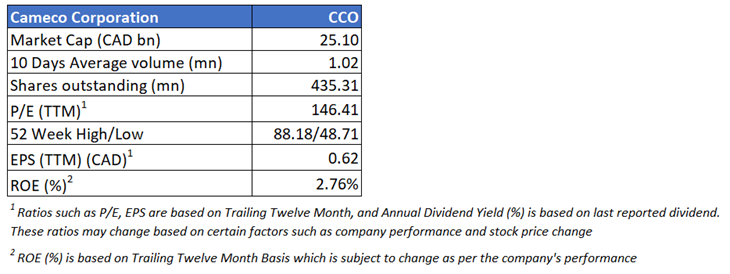
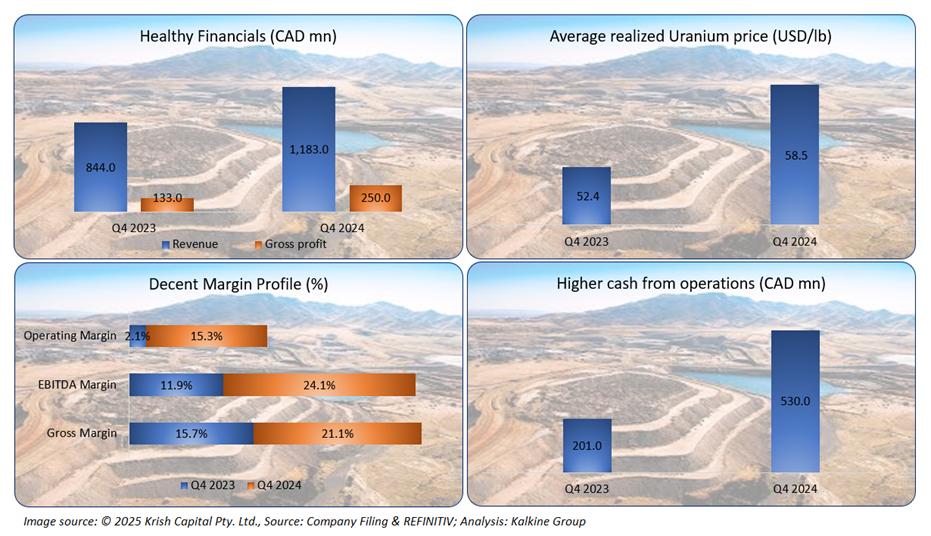
2.4 Key Metrics:
The company has reported an increase in its revenue and gross profit in Q4 2024, which is a key positive. Furthermore, the company has reported higher cash from operations, which is a significant plus.
Section 3: Business Updates and Financial Highlights
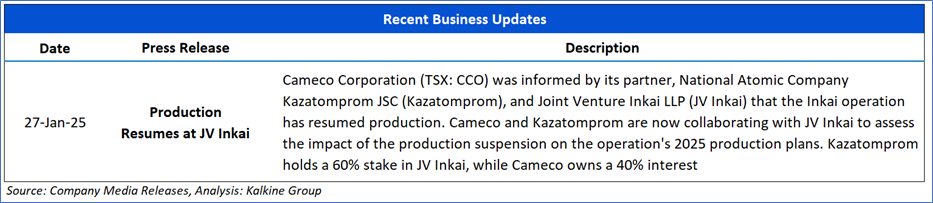
3.1 Recent Updates: The below picture gives an overview of the company's recent activity related to the resumption of its production.
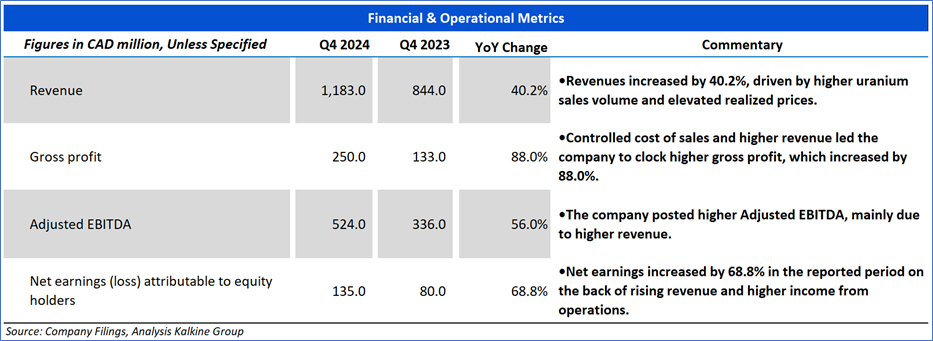
3.2 Insights on Q4 2024 Financial Performance:
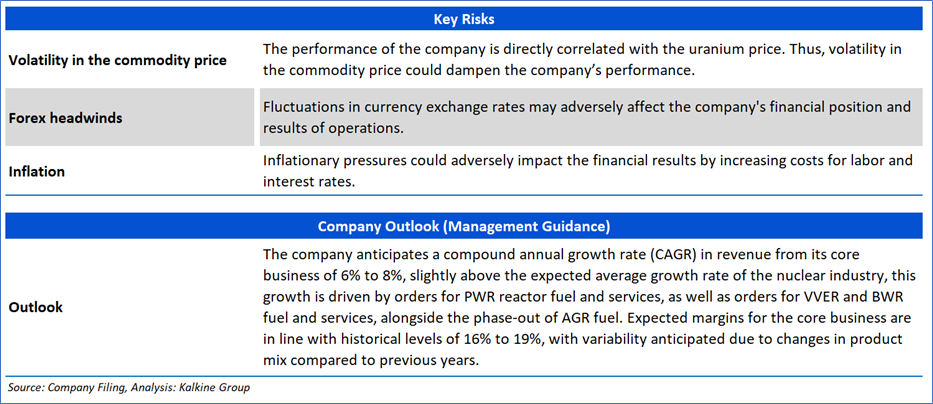
Section 4: Key Risks and Company Outlook
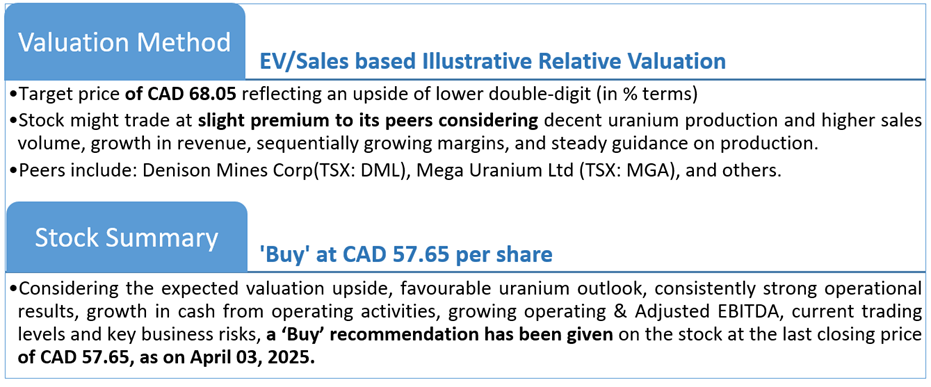
Section 5: Stock Recommendation Summary:
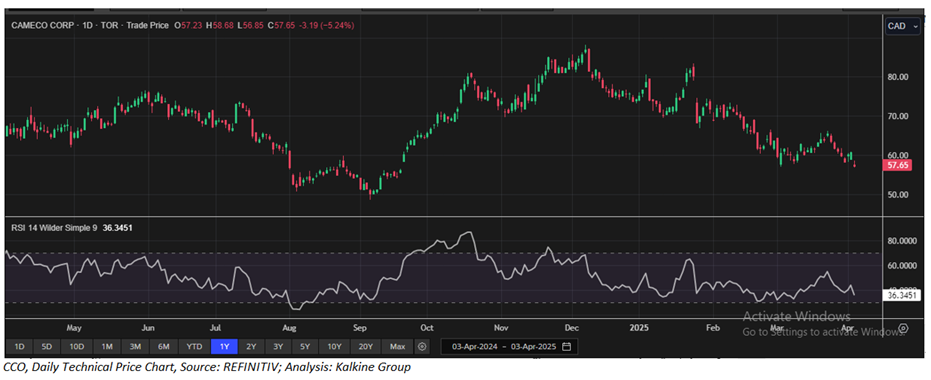
5.1 Price Performance and Technical Summary:

The stock has witnessed a downside of ~5.55 and ~4.86% over the last 1 week and 1 month respectively. Moreover, the stock is trading below the average 52-week high price of CAD 88.18 and 52-week low price of CAD 48.71, providing an opportunity to accumulate the stock.
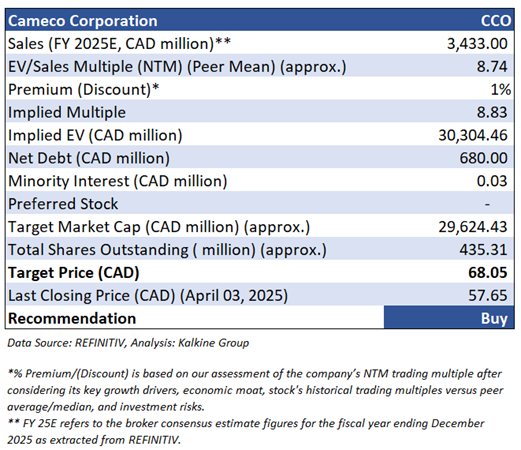
5.2 Fundamental Valuation
Valuation Methodology: EV to Sales Multiple Based Relative Valuation (Illustrative)
Markets are trading in a highly volatile zone currently due to certain macroeconomic issues and geopolitical tensions prevailing. Therefore, it is prudent to follow a cautious approach while investing.
Note 1: Past performance is not a reliable indicator of future performance.
Note 2: The reference date for all price data, currency, technical indicators, support, and resistance levels is April 03, 2025. The reference data in this report has been partly sourced from REFINITIV.
Note 3: Investment decisions should be made depending on an individual's appetite for upside potential, risks, holding duration, and any previous holdings. An 'Exit' from the stock can be considered if the Target Price mentioned as per the Valuation and or the technical levels provided has been achieved and is subject to the factors discussed above.
Note 4: Dividend Yield may vary as per the stock price movement.
Note 5: Kalkine reports are prepared based on the stock prices captured either from REFINITIV or Trading View. Typically, REFINITIV or Trading View may reflect stock prices with a delay which could be a lag of 25-30 minutes. There can be no assurance that future results or events will be consistent with the information provided in the report. The information is subject to change without any prior notice.
Technical Indicators Defined: -
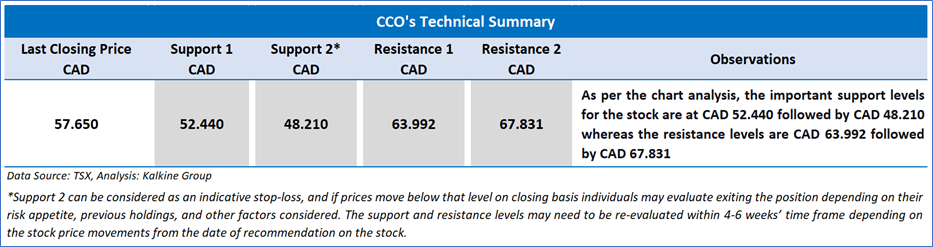
Support: A level at which the stock prices tend to find support if they are falling, and a downtrend may take a pause backed by demand or buying interest. Support 1 refers to the nearby support level for the stock and if the price breaches the level, then Support 2 may act as the crucial support level for the stock.
Resistance: A level at which the stock prices tend to find resistance when they are rising, and an uptrend may take a pause due to profit booking or selling interest. Resistance 1 refers to the nearby resistance level for the stock and if the price surpasses the level, then Resistance 2 may act as the crucial resistance level for the stock.
Stop-loss: It is a level to protect further losses in case of unfavourable movement in the stock prices.
Past performance is not a reliable indicator of future performance.

 Please wait processing your request...