Section 1: Introduction
- Inflation is the gradual loss in purchasing power, primarily due to an increase in the price levels of goods and services over a given period.
- The Consumer Price Index (CPI) increased by 2.6% year-over-year in February, following a 1.9% rise in January. While broad-based price growth was observed, the reinstatement of goods and services tax (GST)/harmonized sales tax (HST) on eligible products mid-month contributed to higher consumer prices, as these taxes are included in the CPI. This led to a slower decline in restaurant food prices in February (-1.4%) compared to January (-5.1%), with restaurant food being the largest driver of the CPI acceleration. Similarly, prices for alcoholic beverages purchased from stores fell by 1.4% in February, after a 3.6% decline in January.
- On a monthly basis, the CPI rose 1.1% in February. On a seasonally adjusted monthly basis, the CPI rose 0.7%.
- There are two types of inflationary trends - high and low inflation. The cycles of high and low inflation mainly depend on policy action by the Government to balance the demand and growth of the country.
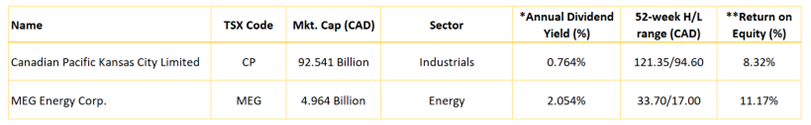
- Canadian Pacific Kansas City Limited (TSX: CP) is a Class-1 railroads operating on more than 12,500 miles of track across most of Canada and into parts of the Midwestern and Northeastern United States. It is the second-smallest Class I railroad by revenue and route miles
- MEG Energy Corp. (TSX: MEG) is engaged in in situ oil sands development and production in Alberta, Canada.
- Companies in the Industrials and Energy sectors can often reduce the impact of inflation by increasing product prices or improving operational efficiency. Industrial companies like CP, may also have long-term contracts, which shield them from short-term inflation. Energy companies like MEG, particularly in oil and gas, tend to benefit from rising prices since they can pass higher costs on to consumers. Both sectors can also employ strategies like cost management or hedging to mitigate the inflationary impact on their profits.

Section 2: Company Overview
Canadian Pacific Kansas City Limited (TSX: CP) is a Class-1 railroads operating on more than 12,500 miles of track across most of Canada and into parts of the Midwestern and Northeastern United States. It is the second smallest Class I railroad by revenue and route miles. The Company hauled shipments of grain (22% of freight revenue), intermodal containers (22%), energy products (like crude and frac sand), chemicals, and plastics (20%) coal (8%), fertilizer and potash (10%), automotive products (5%), and a diverse mix of other merchandise.
Kalkine’s Inflation Report covers the Investment Highlights, Key Financial Metrics, Risks, Technical Analysis along with the Valuation, Target Price, and Recommendation on the stock.
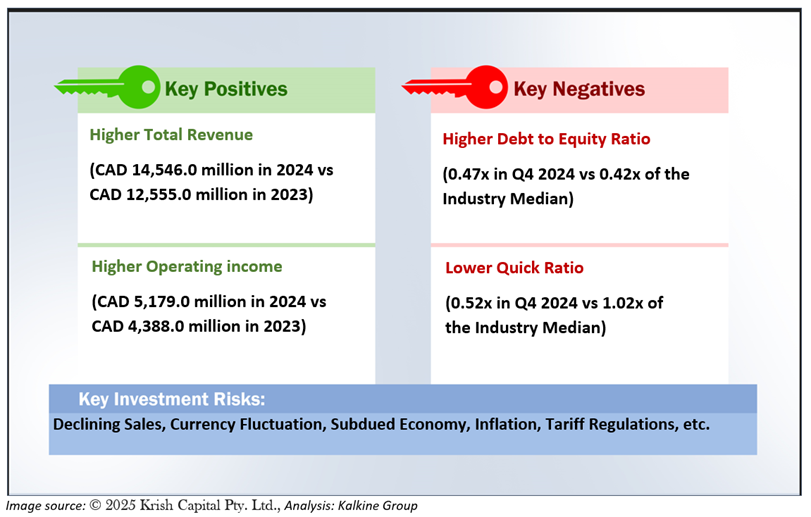
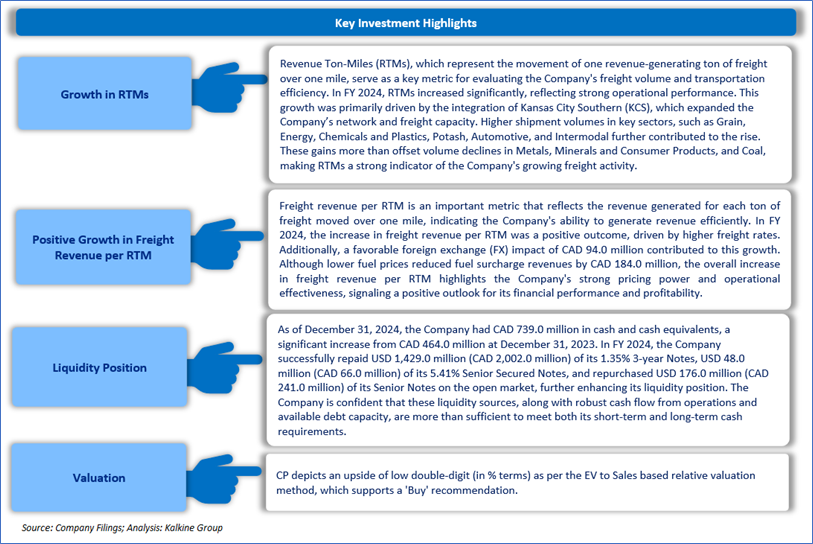
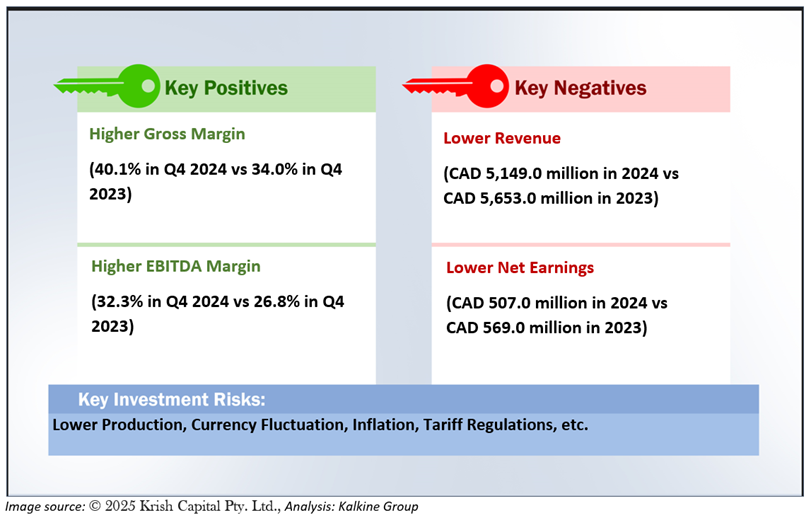
2.1 The Key Positives, Negatives, Investment Highlights, and Risks
Section 3: Financial Highlights
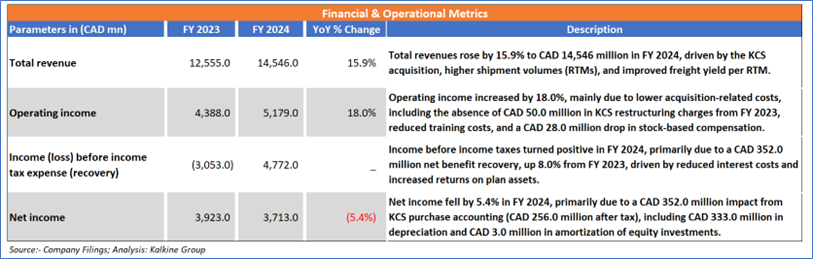
3.1 Key Financial Highlights
Section 4: Key Metrics
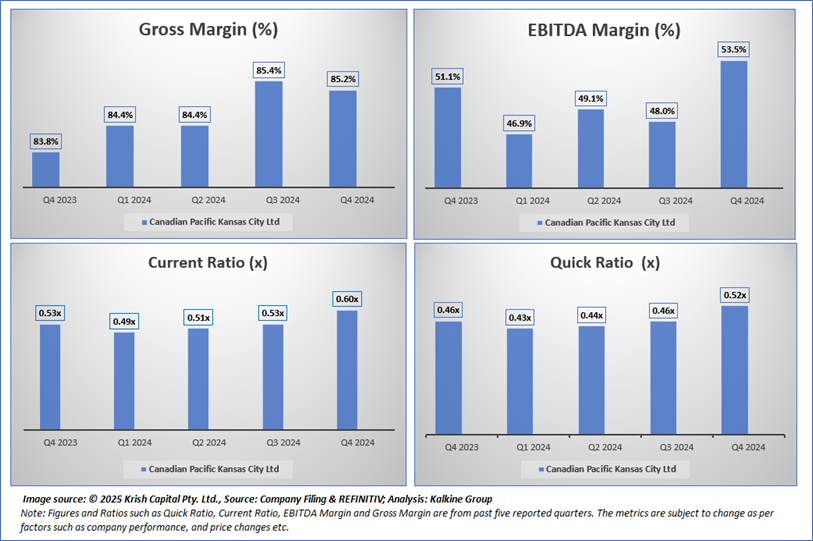
Below chart depicts the change in Gross Margin, EBITDA Margin, Current Ratio and Quick Ratio of the Company for the last five reported quarters.
Section 5: Stock Recommendation Summary
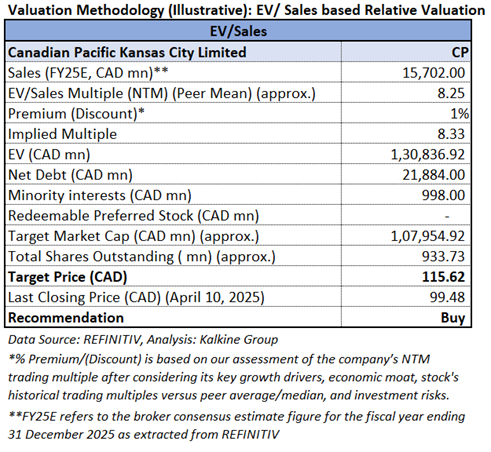
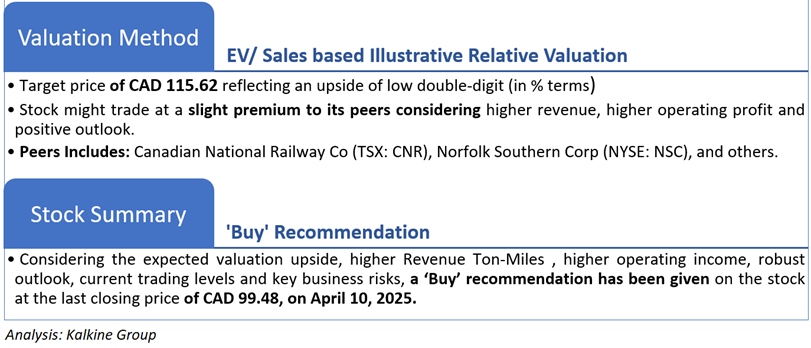
5.1 Valuation Methodology:
5.2 Price Performance and Stock Recommendation

The stock has witnessed a downside of ~5.58% in 1 month and a downside of ~8.30% over the last 3 months. Moreover, the stock is trading below the average of the 52-week high price of CAD 121.35 and the 52-week low price of CAD 94.60, providing an opportunity to accumulate the stock.
5.3 One-Year Technical Price Chart
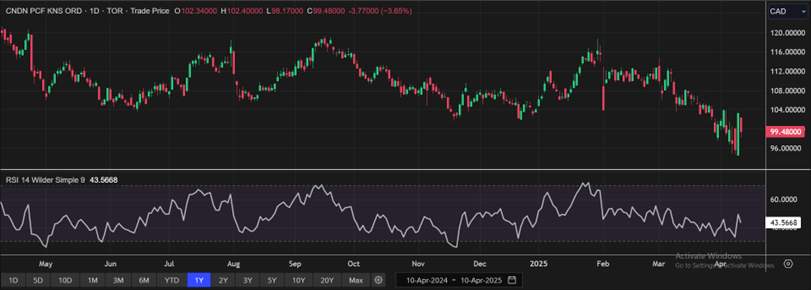
One-Year Technical Price Chart (as of April 10, 2025). Source: REFINITIV, Analysis: Kalkine Group
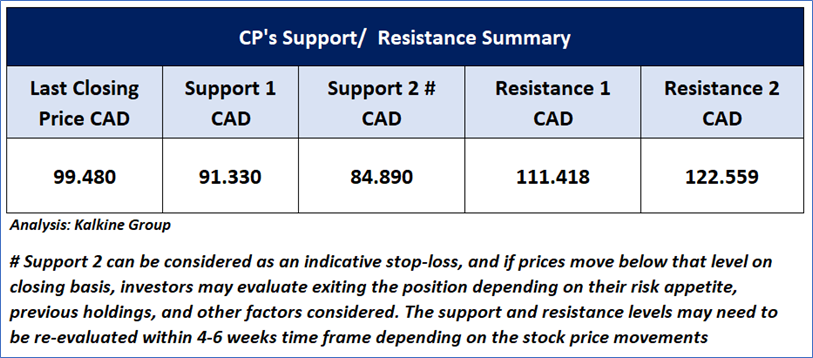
5.4 Technical Summary
MEG Energy Corp.
Section 1: Company Overview
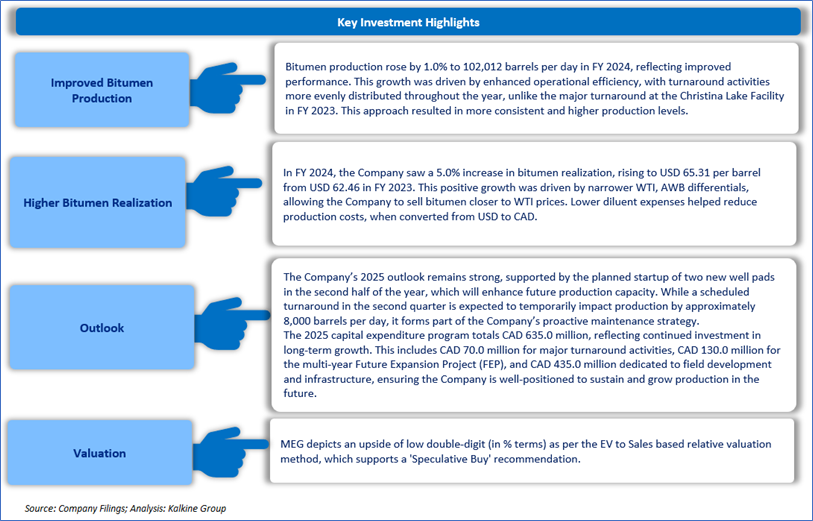
MEG Energy Corp. (TSX: MEG) is engaged in in situ oil sands development and production in Alberta, Canada. The Corporation owns a 100% interest in over 410 square miles of mineral leases in the southern Athabasca oil region of Alberta, Canada and is primarily engaged in in situ thermal oil production at its Christina Lake Project.
Kalkine’s Inflation Report covers the Investment Highlights, Key Financial Metrics, Risks, Technical Analysis along with the Valuation, Target Price, and Recommendation on the stock.
1.1 The Key Positives, Negatives, Investment Highlights, and Risks
Section2: Financial Highlights
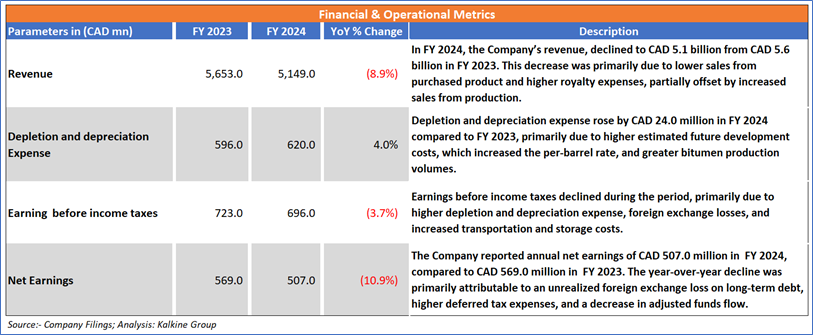
2.1 Key Financial Highlights
Section 3: Key Metrics
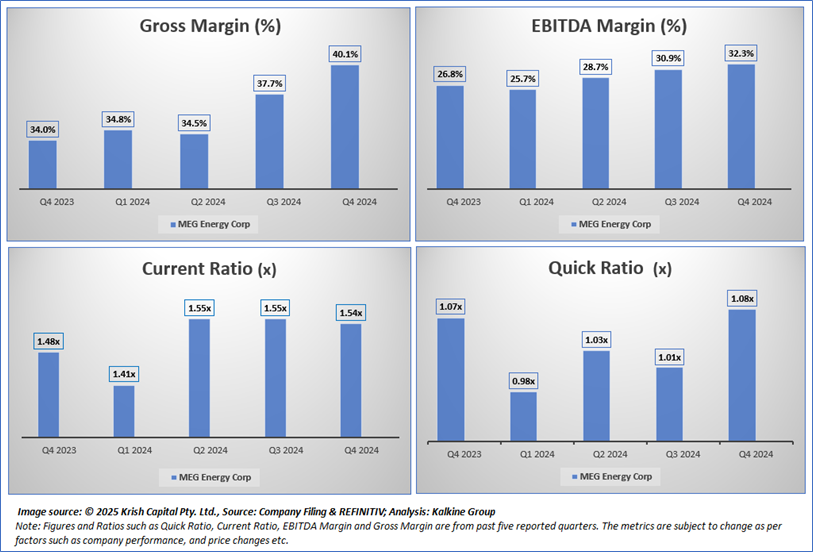
Below chart depicts the change in Gross Margin, EBITDA Margin, Current Ratio and Quick Ratio of the Company for the last five reported quarters.
Section 4: Stock Recommendation Summary
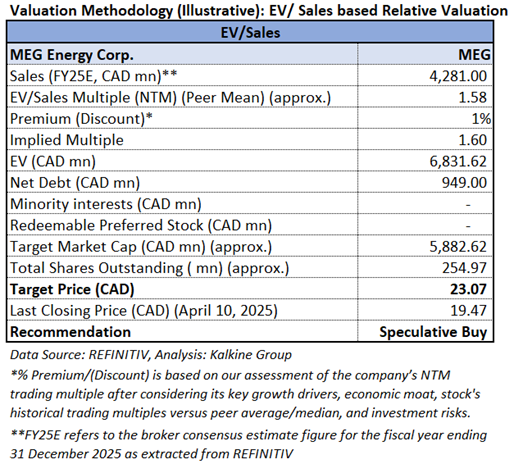
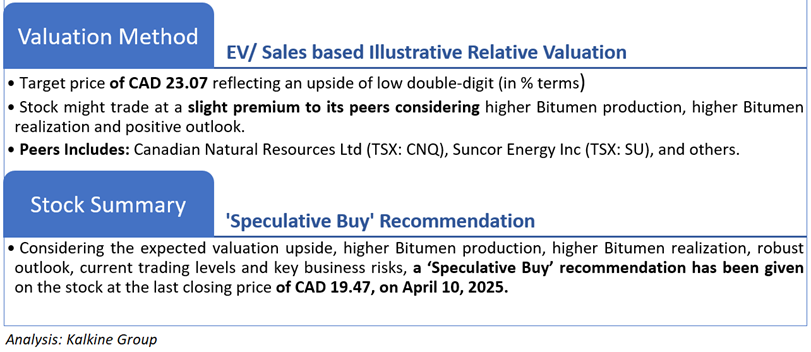
4.1 Valuation Methodology
4.2 Price Performance and Stock Recommendation

The stock has witnessed a downside of ~14.86% in 1 month and of ~20.98% over the last 3 months. Moreover, the stock is trading above the average 52-week high price of CAD 33.70 and 52-week low price of CAD 17.00, providing an opportunity to ride the trend.
4.3 One-Year Technical Price Chart
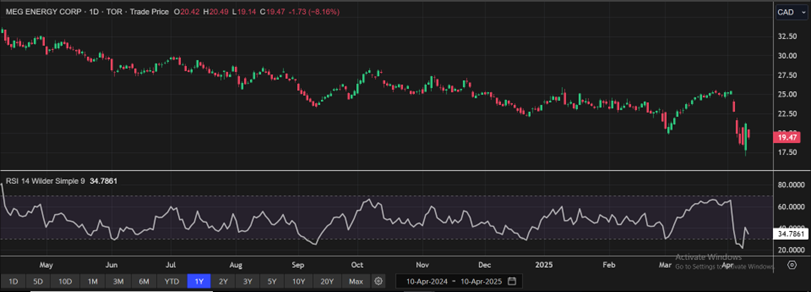
One-Year Technical Price Chart (as of April 10, 2025). Source: REFINITIV, Analysis: Kalkine Group
4.4 Technical Summary
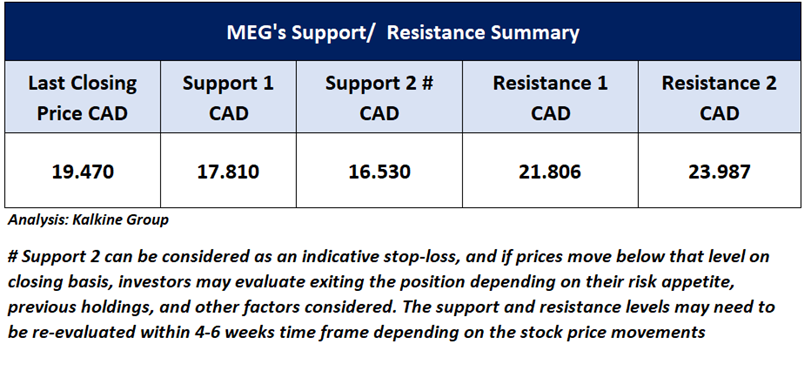
Note 1: Past performance is not a reliable indicator of future performance.
Note 2: The reference date for all price data, currency, technical indicators, support, and resistance levels is April 10, 2025. The reference data in this report has been partly sourced from REFINITIV.
Note 3: Investment decisions should be made depending on an individual's appetite for upside potential, risks, holding duration, and any previous holdings. An 'Exit' from the stock can be considered if the Target Price mentioned as per the Valuation and or the technical levels provided has been achieved and is subject to the factors discussed above.
Note 4: Dividend Yield may vary as per the stock price movement.
Note 5: Kalkine reports are prepared based on the stock prices captured either from REFINITIV or Trading View. Typically, REFINITIV or Trading View may reflect stock prices with a delay which could be a lag of 25-30 minutes. There can be no assurance that future results or events will be consistent with the information provided in the report. The information is subject to change without any prior notice.’
Technical Indicators Defined: -
Support: A level at which the stock prices tend to find support if they are falling, and a downtrend may take a pause backed by demand or buying interest.
Resistance: A level at which the stock prices tend to find resistance when they are rising, and the uptrend may take a pause due to profit booking or selling interest.
Stop-loss: In general, it is a level to protect further losses in case of any unfavourable movement in the stock prices.
Past performance is not a reliable indicator of future performance.

 Please wait processing your request...