Section1: Commodity Update:
Commodity Outlook: Gold, commonly used for investments and jewellery purposes, as a precious metal. Gold is among Canada's most valuable mined commodities. Production of Gold in Canadian mines has been increasing steadily over the last decade. Investors purchase gold in the form of wafers, bars and coins, also as a means of protection from the risks of inflation and market volatility. Gold-backed exchange-traded funds (ETF) are another source of investment demand for gold. Approximately 7% of the demand for gold is for use in technology applications, mostly as a component of micro-circuitry in a range of electronic products. In Canada, majorly Gold mining coming from Ontario and Quebec that together accounted for around 72% of gold production. The key drivers behind gold prices in 2025 are global economic uncertainties, inflation, outlook for Fed interest rate cuts and U.S. real yields. The structural bull case for gold remains intact, even as prices have risen sharply. Traditionally, a weaker U.S. dollar and lower U.S. interest rates increase the appeal of yellow metal. Gold spiked at 264.16 USD/t oz. or 10.07% since the beginning of 2025. Historically, Gold reached an all time high of USD 2,956.22 in February of 2025.
Data Source: Government of Canada
Section 2: Company Overview and Fundamental Insights:
2.1 Company Overview:
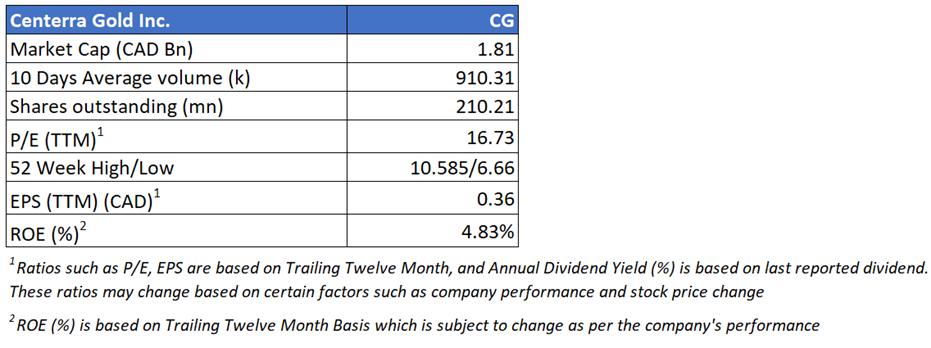
Centerra Gold Inc.(TSX: CG) is a Canadian-based gold mining company focused on operating, developing, exploring and acquiring gold and copper properties in North America, Türkiye, and other markets worldwide. Centerra operates two mines: the Mount Milligan Mine in British Columbia, Canada, and the Öksüt Mine in Türkiye. The Company also owns the Goldfield District Project in Nevada, United States, the Kemess Project in British Columbia, Canada, and owns and operates the Molybdenum Business Unit in the United States and Canada. Kalkine’s Gold Report covers the Investment Highlights, Key Financial Metrics, Risks, Technical Analysis along with the Valuation, Target Price, and Recommendation on the stock.
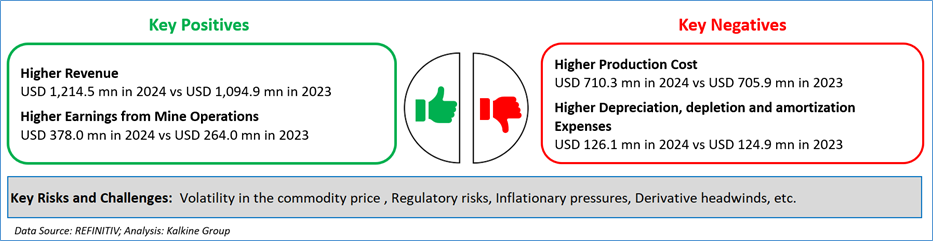
2.2 The Key Positives, Negatives, Investment Highlights and Risks
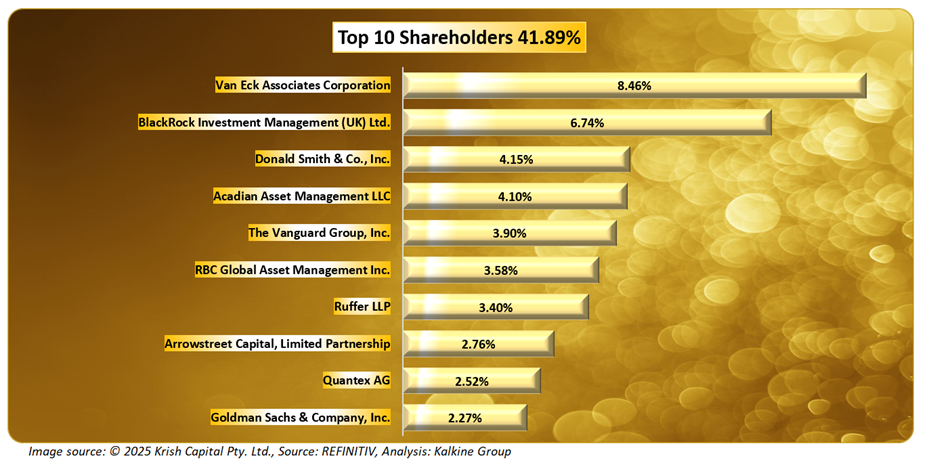
2.3 Top 10 Shareholders:
The top 10 shareholders together form ~41.89% of the total shareholding. Van Eck Associates Corporation and BlackRock Investment Management (UK) Ltd. hold a maximum stake in the company at ~8.46% and ~6.74%, respectively.
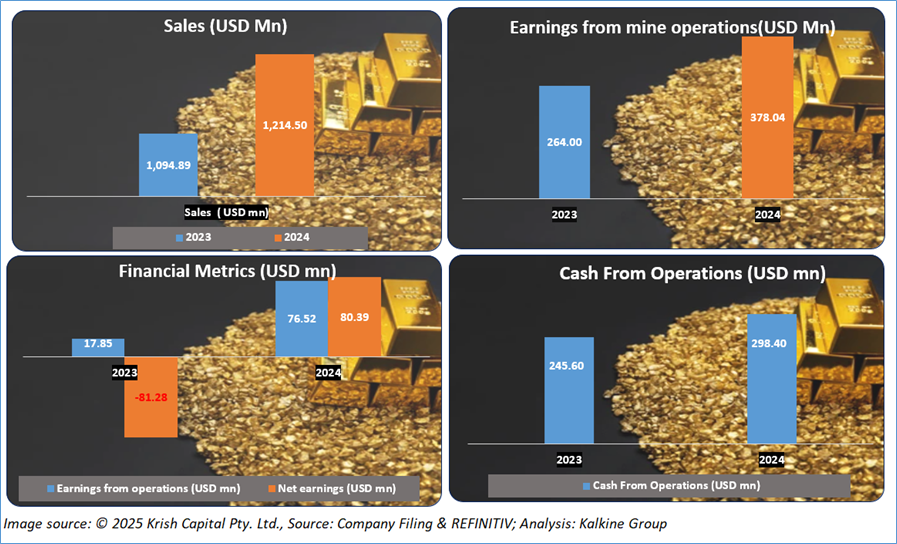
2.4 Key Metrics:
The firm has witnessed an improvement in its Sales and Earnings from Mine Operations during the year (2024). Also, the Company’s Cash from Operations has improved from the last year, which is a significant positive that displays the company’s strength and adaptability.
Section 3: Business Updates and Financial Highlights
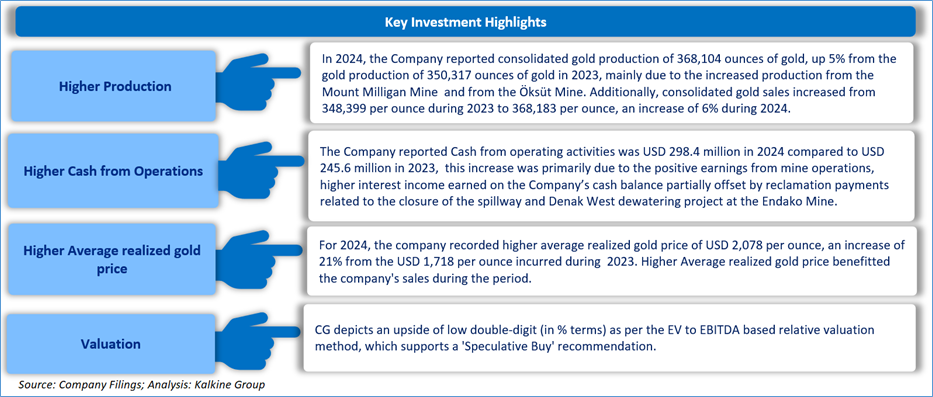
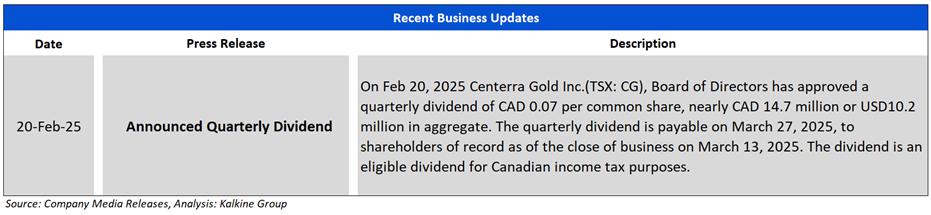
3.1 Recent Updates: The below picture gives an overview of its recent activities.
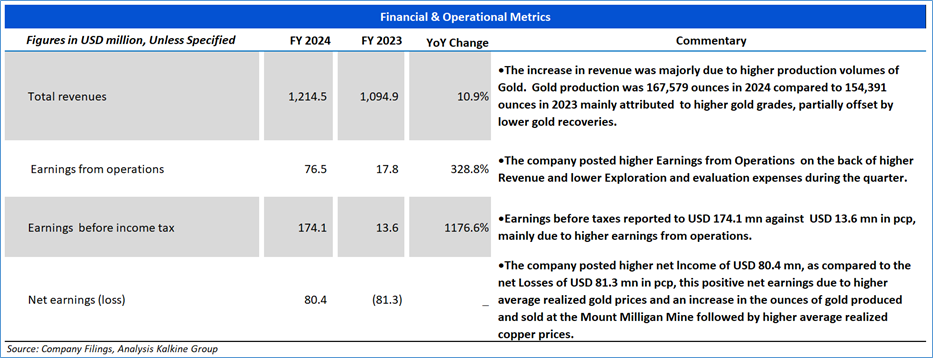
3.2 Insights on 2024 Financial Performance:
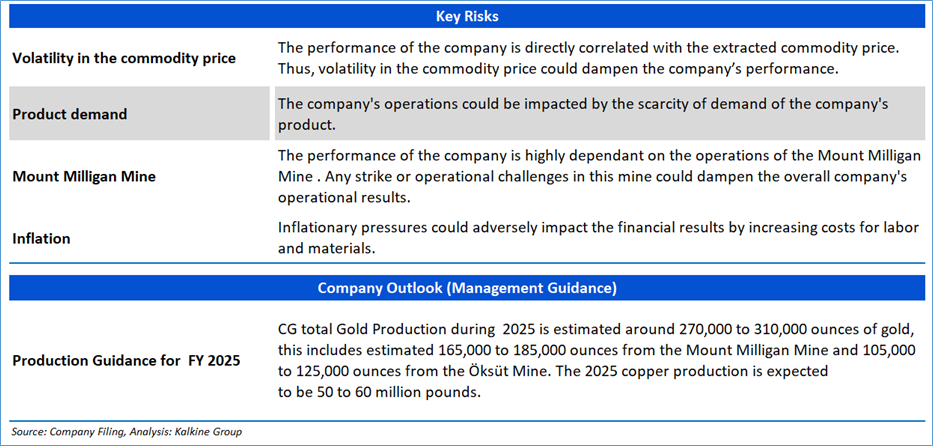
Section 4: Key Risks and Company Outlook
Section 5: Stock Recommendation Summary:
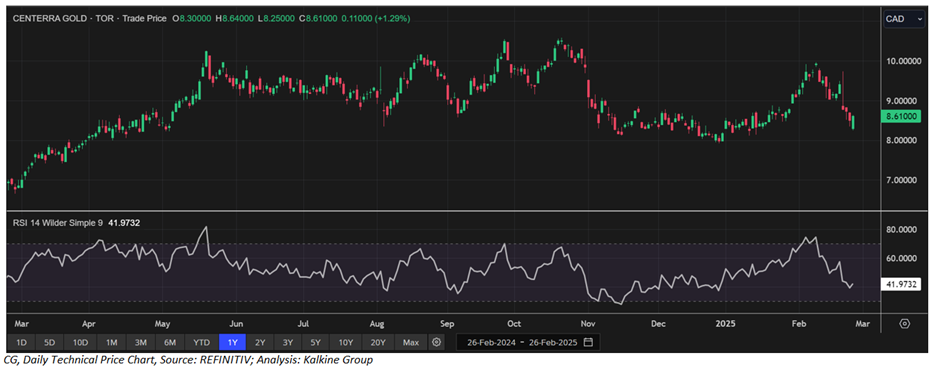
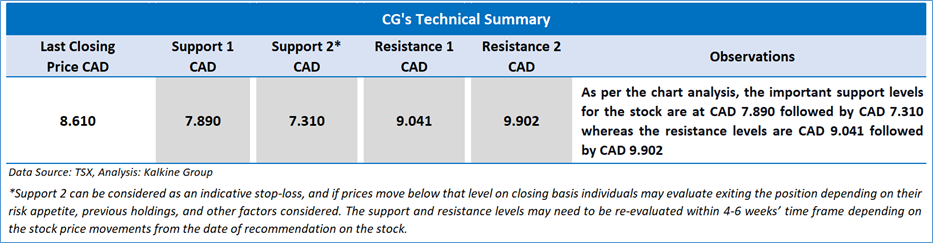
5.1 Price Performance and Technical Summary:

The stock has witnessed a downside of ~0.11% in 1 month and an upside of ~2.50% over the last 3 months. Moreover, the stock is trading slightly below the average 52-week high price of CAD 10.585 and a 52-week low price of CAD 6.66, providing an opportunity to accumulate the stock.
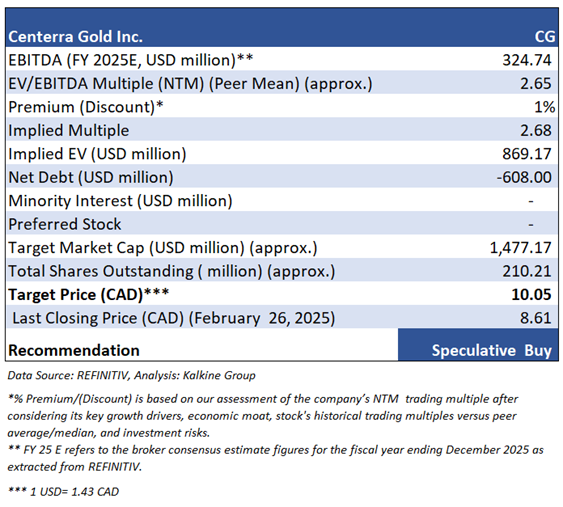
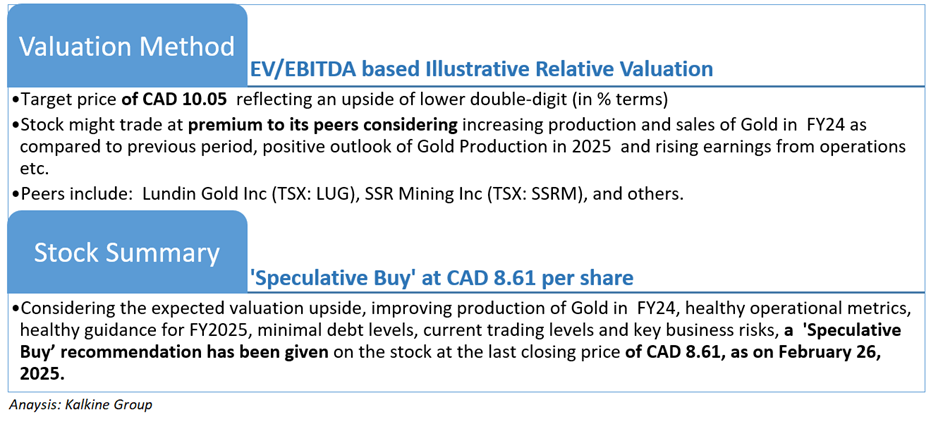
5.2 Fundamental Valuation
Valuation Methodology: EV to EBITDA Multiple Based Relative Valuation (Illustrative)
Markets are trading in a highly volatile zone currently due to certain macroeconomic issues and geopolitical tensions prevailing. Therefore, it is prudent to follow a cautious approach while investing.
Note 1: Past performance is not a reliable indicator of future performance.
Note 2: The reference date for all price data, currency, technical indicators, support, and resistance levels is February 26, 2025. The reference data in this report has been partly sourced from REFINITIV.
Note 3: Investment decisions should be made depending on an individual's appetite for upside potential, risks, holding duration, and any previous holdings. An 'Exit' from the stock can be considered if the Target Price mentioned as per the Valuation and or the technical levels provided has been achieved and is subject to the factors discussed above.
Note 4: Dividend Yield may vary as per the stock price movement.
Note 5: Kalkine reports are prepared based on the stock prices captured either from REFINITIV or Trading View. Typically, REFINITIV or Trading View may reflect stock prices with a delay which could be a lag of 25-30 minutes. There can be no assurance that future results or events will be consistent with the information provided in the report. The information is subject to change without any prior notice.’
Technical Indicators Defined: -
Support: A level at which the stock prices tend to find support if they are falling, and a downtrend may take a pause backed by demand or buying interest. Support 1 refers to the nearby support level for the stock and if the price breaches the level, then Support 2 may act as the crucial support level for the stock.
Resistance: A level at which the stock prices tend to find resistance when they are rising, and an uptrend may take a pause due to profit booking or selling interest. Resistance 1 refers to the nearby resistance level for the stock and if the price surpasses the level, then Resistance 2 may act as the crucial resistance level for the stock.
Stop-loss: It is a level to protect further losses in case of unfavourable movement in the stock prices.
Past performance is not a reliable indicator of future performance.
 Please wait processing your request...