Section 1: Company Overview and Fundamental Insights
Company Overview:
Computer Modelling Group Ltd (TSX: CMG) is a Canada-based provider of reservoir simulation software for the oil and gas industry. Its capabilities include integrated analysis and optimization, black oil and unconventional simulation, reservoir and production system modelling, post-processor visualization, compositional simulation, thermal processes simulation, and fluid property characterization. The firm has operations in over 60 countries in the Americas, Europe, Middle East, Africa, and Asia-Pacific regions.
Kalkine’s Growth Report covers the Investment Highlights, Key Financial Metrics, Risks, Technical Analysis along with the Valuation, Target Price, and Recommendation on the stock.
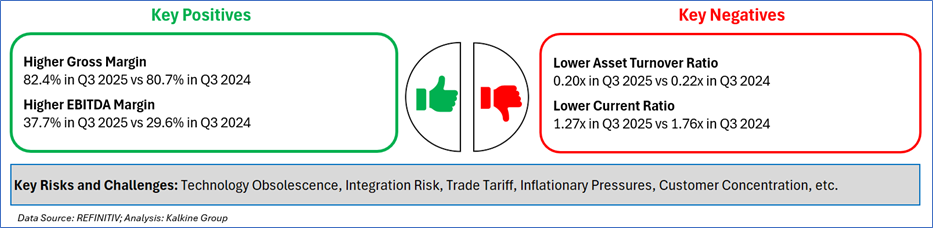
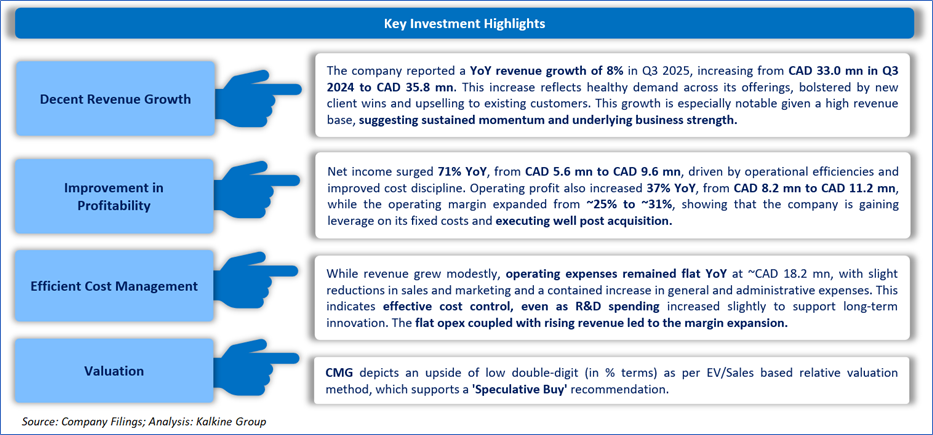
1.2 The Key Positives, Negatives, Investment Highlights and Risks
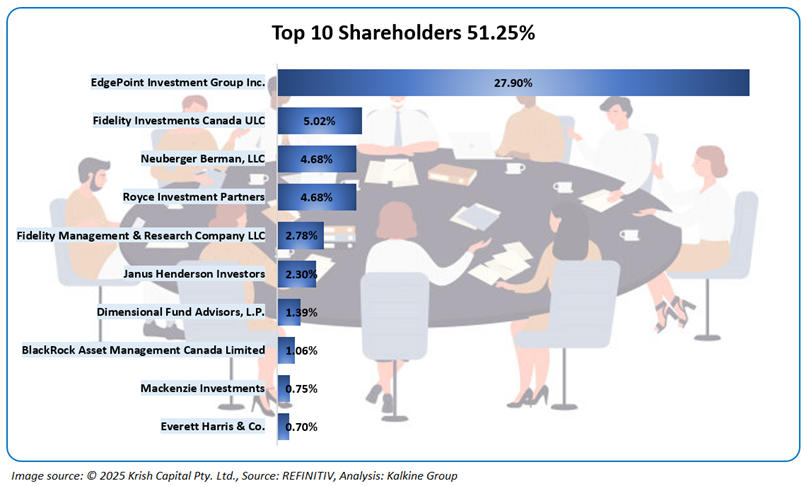
1.3 Top 10 Shareholders
The top 10 shareholders together form ~51.25% of the total shareholding. EdgePoint Investment Group Inc. and Fidelity Investments Canada ULC hold a maximum stake in the company at ~27.90% and ~5.02%, respectively.
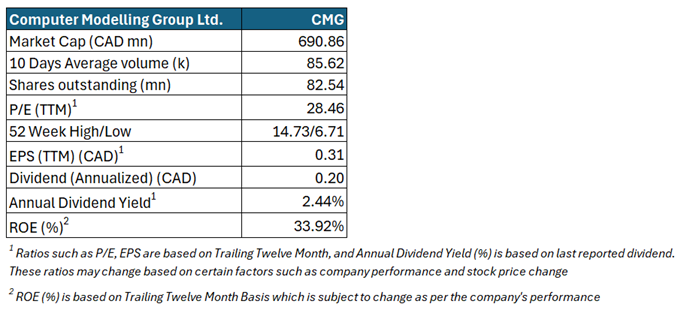
1.4 Key Metrics:
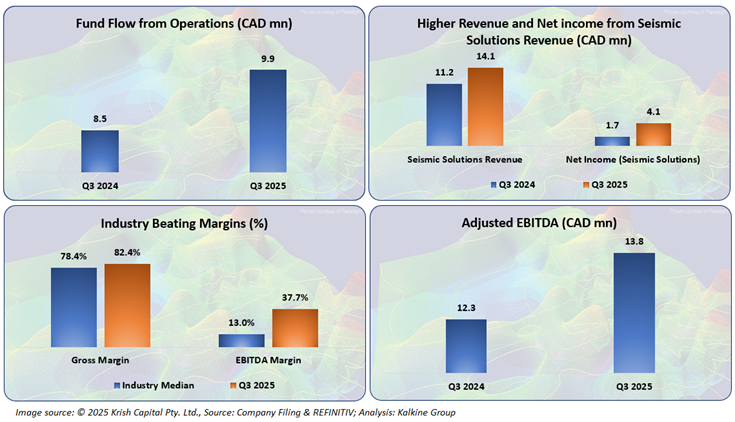
The company reported decent Fund Flow from Operations, as well as an increase in overall Revenue and Net Income, which is a significant positive. Furthermore, the company reported industry-leading margins in Q3 2025 and a decent increase in Adjusted EBITDA, indicating its strength and positive outlook.
Section 2: Business Updates and Financial Highlights
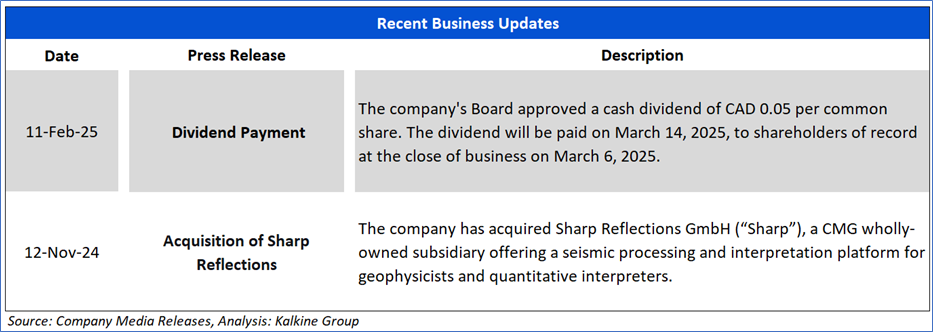
2.1 Recent Updates: The picture below gives an overview of the company’s recent activities, such as the announcement regarding dividend payment and acquisition of Sharp Reflections.
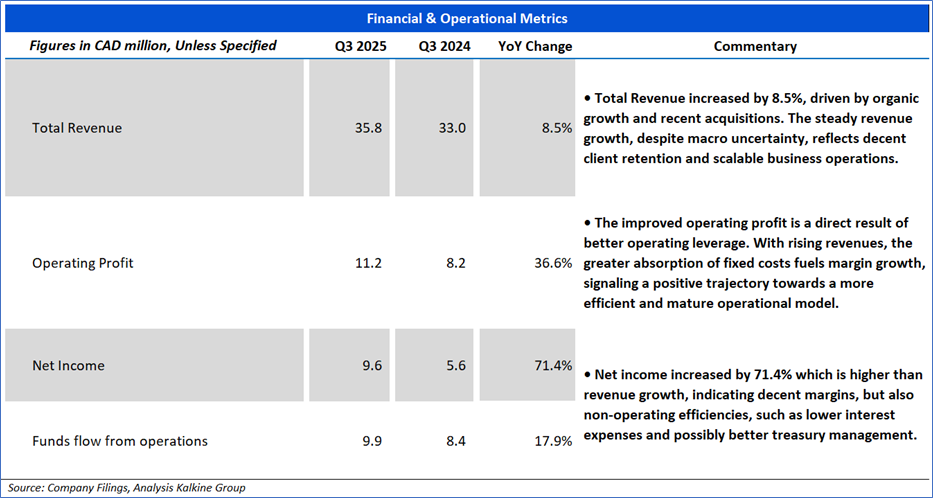
2.2 Insights into Q3 2025 Financial Performance:
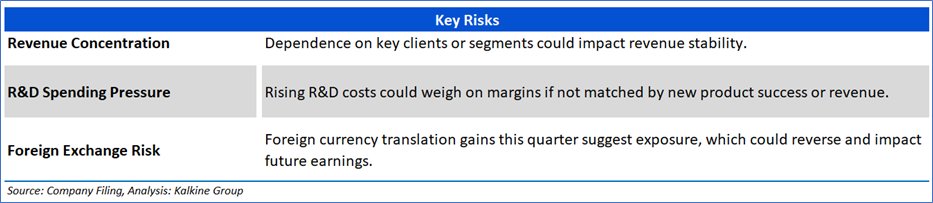
Section 3: Key Risks
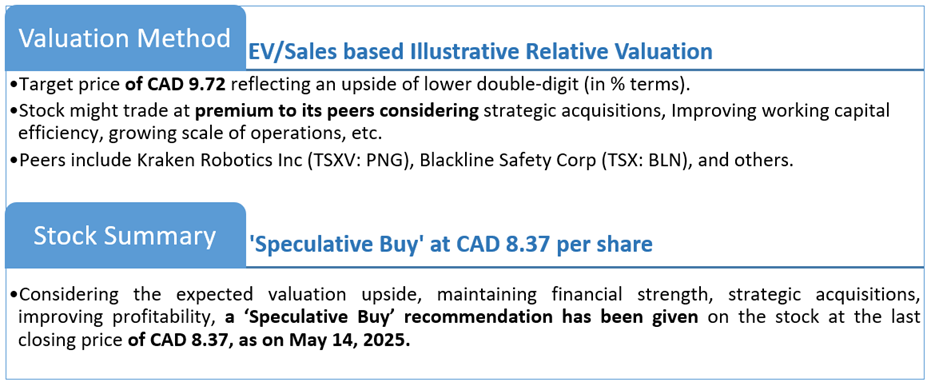
Section 4: Stock Recommendation Summary:
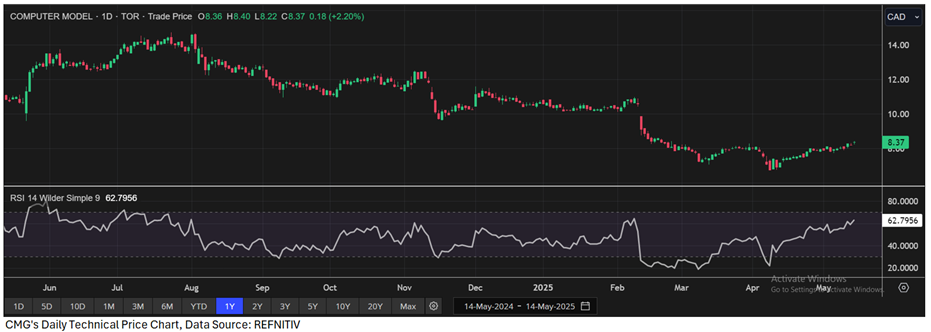
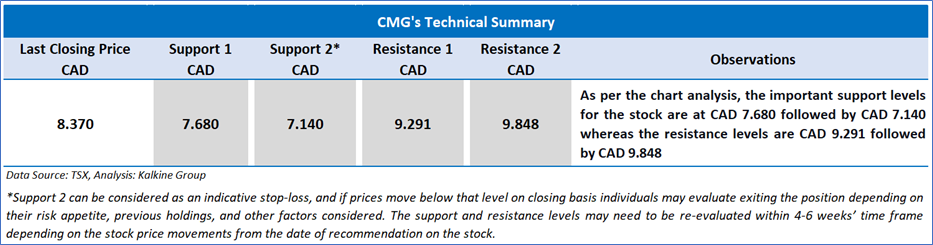
4.1 Price Performance and Technical Summary:

The stock has witnessed an upside of ~5.15% and a downside of ~8.22% over the last 1 week and 3 months respectively. Moreover, the stock is trading below the average 52-week high price of CAD 14.73 and the 52-week low price of CAD 6.71, providing an opportunity to accumulate the stock.
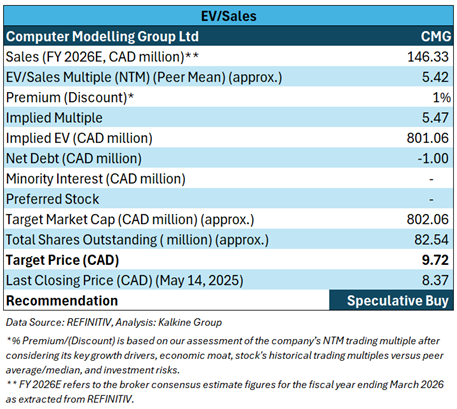
4.2 Fundamental Valuation
Valuation Methodology: EV to Sales Multiple Based Relative Valuation (Illustrative):
Markets are trading in a highly volatile zone currently due to certain macroeconomic issues and geopolitical tensions prevailing. Therefore, it is prudent to follow a cautious approach while investing.
Note 1: Past performance is not a reliable indicator of future performance.
Note 2: The reference date for all price data, currency, technical indicators, support, and resistance levels is May 14, 2025. The reference data in this report has been partly sourced from REFINITIV.
Note 3: Investment decisions should be made depending on an individual's appetite for upside potential, risks, holding duration, and any previous holdings. An 'Exit' from the stock can be considered if the Target Price mentioned as per the Valuation and or the technical levels provided have been achieved and is subject to the factors discussed above.
Note 4: Dividend Yield may vary as per the stock price movement.
Note 5: Kalkine reports are prepared based on the stock prices captured either from REFINITIV or Trading View. Typically, REFINITIV or Trading View may reflect stock prices with a delay which could be a lag of 25-30 minutes. There can be no assurance that future results or events will be consistent with the information provided in the report. The information is subject to change without any prior notice.
Technical Indicators Defined: -
Support: A level at which the stock prices tend to find support if they are falling, and a downtrend may take a pause backed by demand or buying interest. Support 1 refers to the nearby support level for the stock and if the price breaches the level, then Support 2 may act as the crucial support level for the stock.
Resistance: A level at which the stock prices tend to find resistance when they are rising, and an uptrend may take a pause due to profit booking or selling interest. Resistance 1 refers to the nearby resistance level for the stock and if the price surpasses the level, then Resistance 2 may act as the crucial resistance level for the stock.
Stop-loss: It is a level to protect further losses in case of unfavourable movement in the stock prices.
Past performance is not a reliable indicator of future performance.
 Please wait processing your request...