Section 1: Company Overview and Fundamentals
1.1 Company Overview:
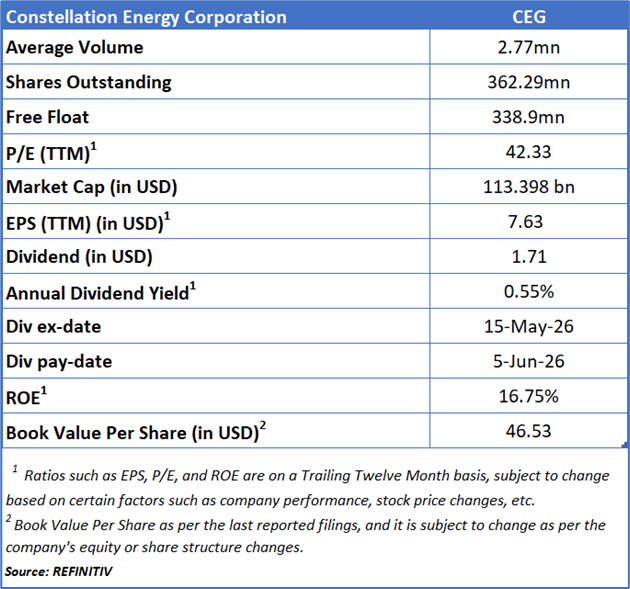
Constellation Energy Corporation (NASDAQ: CEG) is a leading U.S.-based clean energy producer and supplier, operating a diversified portfolio of nuclear, natural gas, geothermal, hydro, wind, and solar assets with ~55 GW capacity. The company delivers electricity and energy solutions to a broad customer base across multiple regions, with its emissions-free generation capable of powering ~27 million homes and contributing ~10% of the nation’s clean energy supply.
Kalkine’s Low Carbon Research Report covers the Investment Highlights, Low Carbon Emission Initiatives, Key Financial Metrics, Risks, and Technical Analysis along with the Valuation, Target Price, and Recommendation on the stock.
Stock Performance:
- The stock is currently in a broad consolidation phase after a prior uptrend, stabilizing around the USD 310–315 range.
- The 21-day moving average (USD 293.03) is converging with the 50-day moving average (USD 301.50), suggesting a transition from a bearish to a neutral-to-bullish trend.
- The stock is trading slightly above both moving averages, reflecting improving short-term momentum, although the longer-term trend remains relatively flat.
- The RSI (~58) is in the upper neutral zone, indicating moderate buying interest without overbought conditions, leaving room for further upside.
- Volume trends are stable with occasional spikes, particularly during rebounds, suggesting selective accumulation at lower levels.
1.2 Why do Low Carbon Emissions matter?
The shift toward a low-carbon economy is one of the most significant challenges of current time, spurred by the urgent need to combat climate change and reduce the environmental impact of corporate activities. This report covers the US-listed low-carbon emission company; Constellation Energy Corporation (NASDAQ: CEG), that is committed to sustainability and responsible environmental practices.
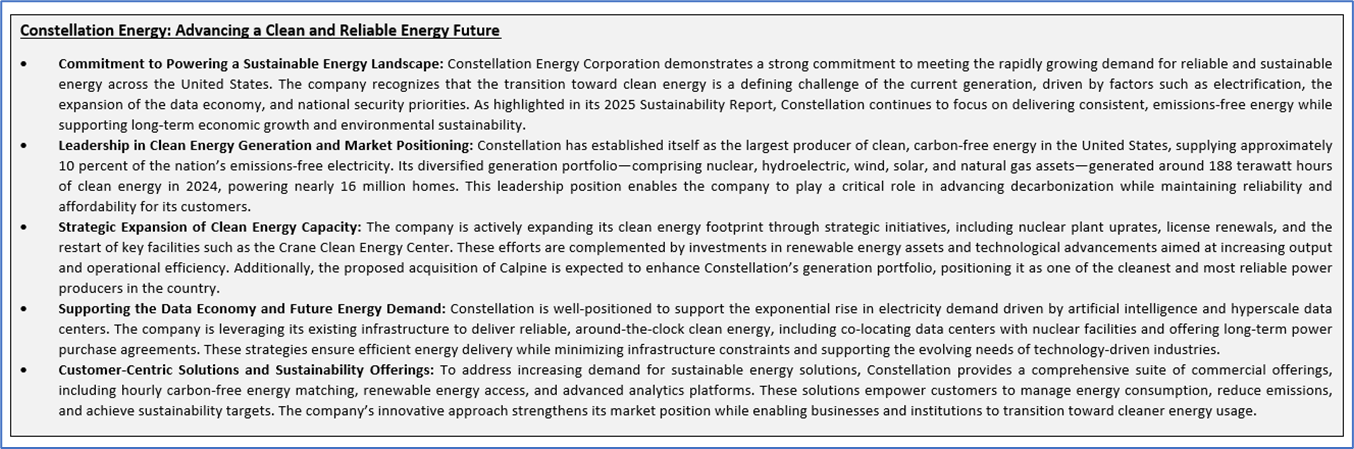
Diverging Sustainability Trends: Renewable Uptake Gains Momentum Amid Volatile Water Efficiency
A comparative analysis of the two charts indicates a divergence in sustainability performance, with renewable energy adoption showing strong structural improvement while water efficiency remains inconsistent. Renewable energy supply declined from 0.37% in 2021 to 0.02% in 2022, followed by a sharp recovery to 1.72% in 2023 and 2.45% in 2024, reflecting an inflection point and accelerated integration of cleaner energy sources. In contrast, water use intensity improved significantly from ~2.72 million in 2021 to ~1.91 million in 2022, but this efficiency was not sustained, as usage increased to ~1.95 million in 2023 and ~2.08 million in 2024, indicating rising operational pressures. Overall, the trend suggests that while the company is progressing in its renewable transition, scaling activities may be impacting resource efficiency, highlighting the need for a more integrated approach to balance clean energy growth with water management.
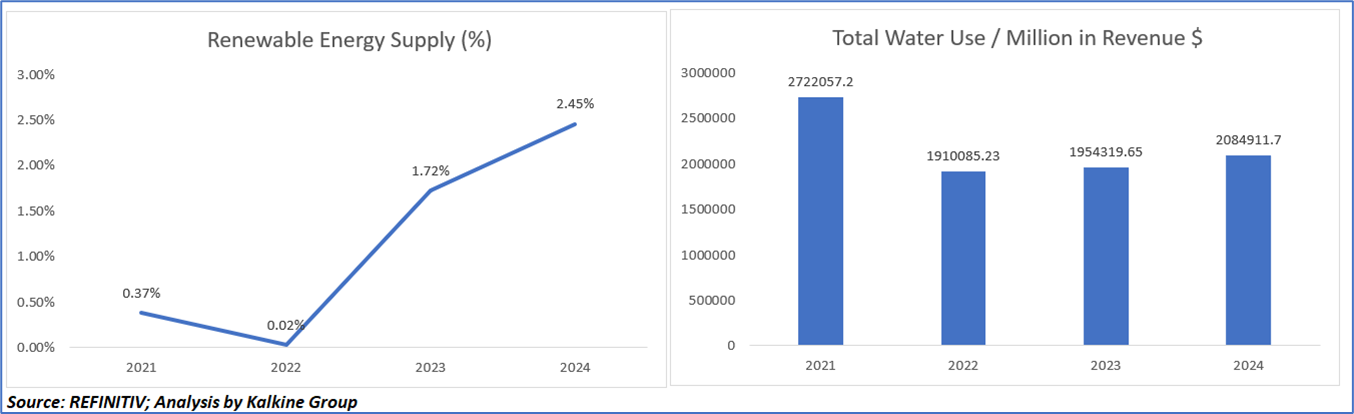
Peer Comparison:
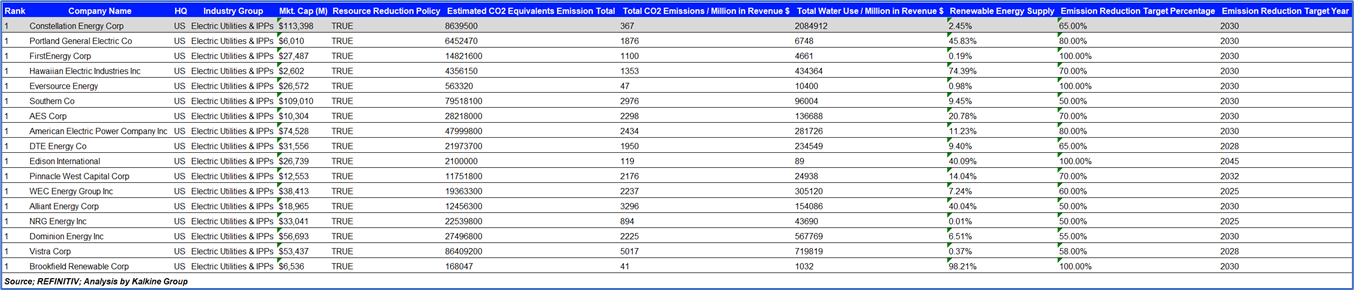
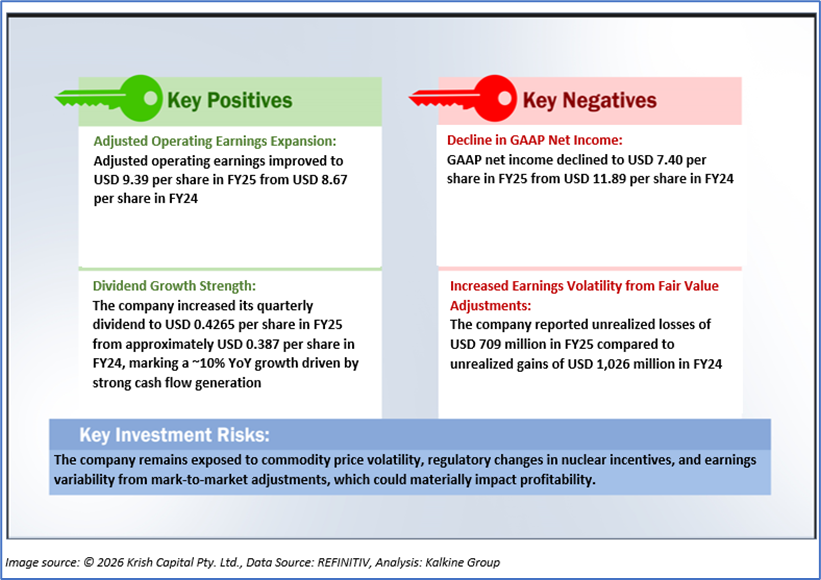
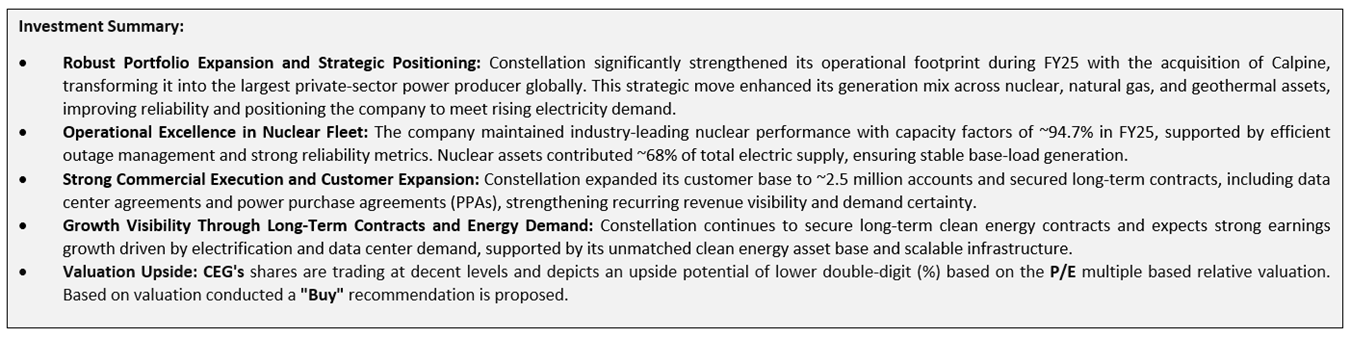
1.2 The Key Positives, Negatives, and Investment summary
1.3 Top 10 shareholders:
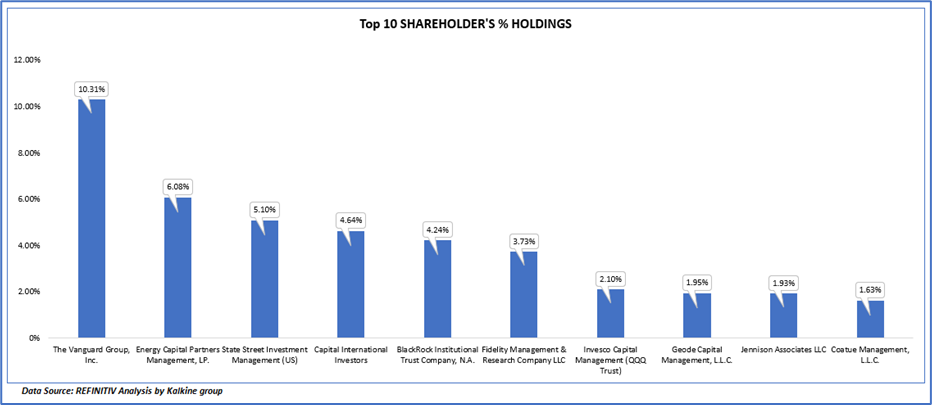
The top 10 shareholders together form ~41.72% of the total shareholding, signifying concentrated shareholding. The Vanguard Group, Inc. and Energy Capital Partners Management, LP. are the biggest shareholders, holding the maximum stake in the company at 10.31% and 6.08%, respectively.
1.4 Key Metrics
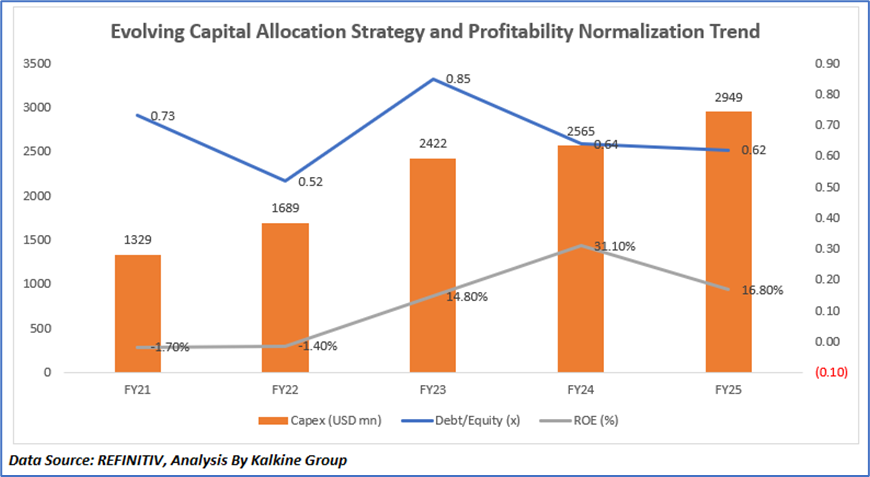
Capital Investment, Leverage Dynamics, and Return Efficiency Trend Analysis
The chart reflects a strategic progression in Constellation Energy’s financial profile, where Capex increased steadily from ~USD 1.3 billion in FY21 to ~USD 2.9 billion in FY25, driven by sustained investments in generation assets, nuclear fleet upgrades, and long-term clean energy initiatives. This expansion phase initially led to a rise in the Debt/Equity ratio from 0.52 in FY22 to 0.85 in FY23, indicating higher reliance on leverage to fund growth; however, the ratio subsequently declined to 0.62 by FY25, supported by stronger retained earnings and a more balanced capital structure. Meanwhile, ROE improved sharply from low single-digit levels in FY21–FY22 to 31.1% in FY24, reflecting favorable market conditions, strong operational performance, and improved earnings quality, before moderating to 16.8% in FY25 due to a decline in GAAP net income impacted by unrealized losses and nuclear PTC-related headwinds. Overall, the trend highlights a transition from a leverage-driven expansion phase to a more stable, cash-supported growth model, with profitability remaining sensitive to market and accounting-driven earnings volatility.
Section 2: Business Updates and Corporate Business Highlights
2.1 Key Business Updates:

2.2 Insights of FY25:

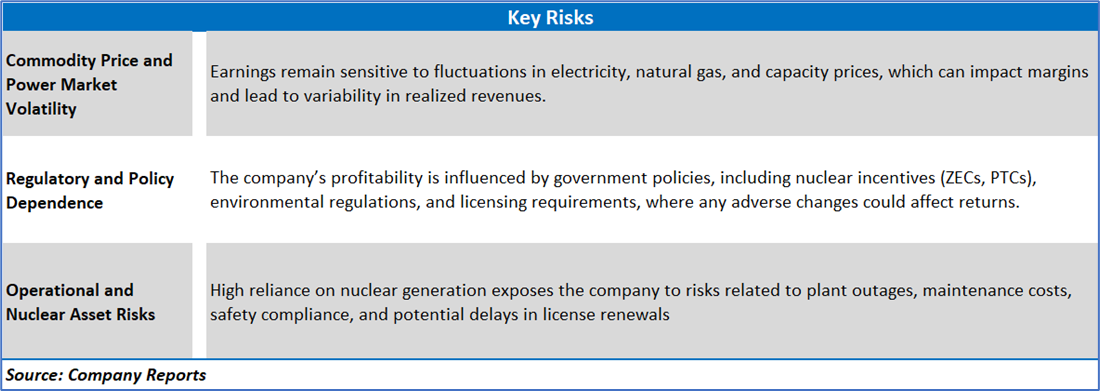
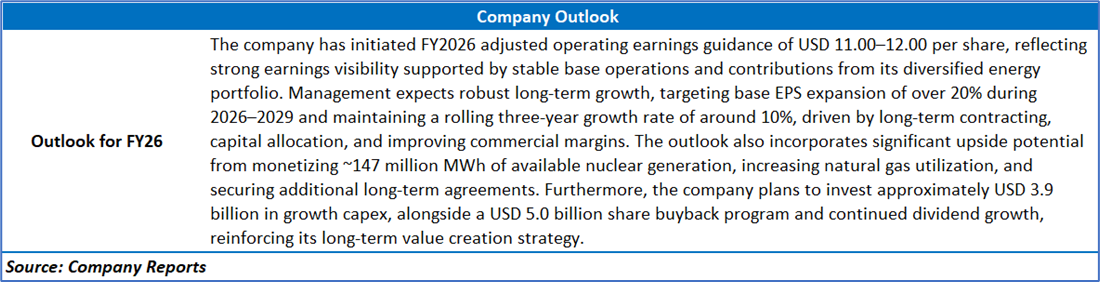
Section 3: Key Risks & Outlook
Section 4: Stock Recommendation Summary:
4.1 Price Performance and Technical Summary:
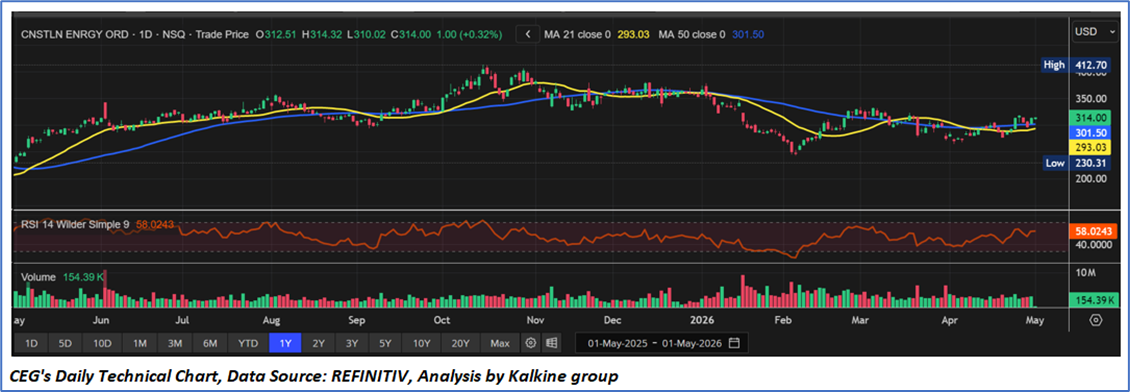
Stock Performance:
- The stock is currently in a broad consolidation phase after a prior uptrend, stabilizing around the USD 310–315 range.
- The 21-day moving average (USD 293.03) is converging with the 50-day moving average (USD 301.50), suggesting a transition from a bearish to a neutral-to-bullish trend.
- The stock is trading slightly above both moving averages, reflecting improving short-term momentum, although the longer-term trend remains relatively flat.
- The RSI (~58) is in the upper neutral zone, indicating moderate buying interest without overbought conditions, leaving room for further upside.
- Volume trends are stable with occasional spikes, particularly during rebounds, suggesting selective accumulation at lower levels.
4.2 Fundamental Valuation
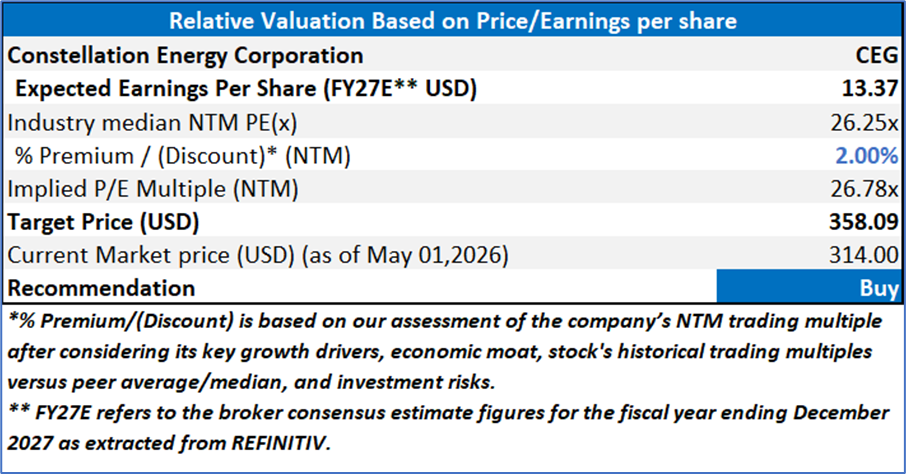
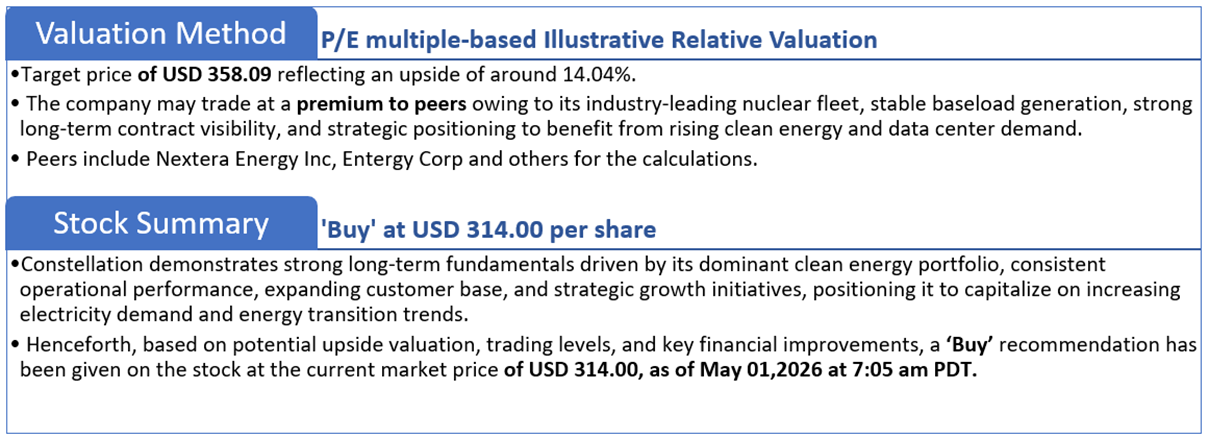
Valuation Methodology: Price/Earnings Per Share (P/E) Multiple Based Relative Valuation
Markets are trading in a highly volatile zone currently due to certain macroeconomic issues and geopolitical tensions prevailing. Therefore, it is prudent to follow a cautious approach while investing.
Note 1: Past performance is not a reliable indicator of future performance.
Note 2: The reference date for all price data, currency, technical indicators, support, and resistance levels is May 01,2026. The reference data in this report has been partly sourced from REFINITIV.
Note 3: Investment decisions should be made depending on an individual's appetite for upside potential, risks, holding duration, and any previous holdings. An 'Exit' from the stock can be considered if the Target Price mentioned as per the Valuation and or the technical levels provided has been achieved and is subject to the factors discussed above.
Note 4: The report publishing date is as per the Pacific Time Zone.
Technical Indicators Defined: -
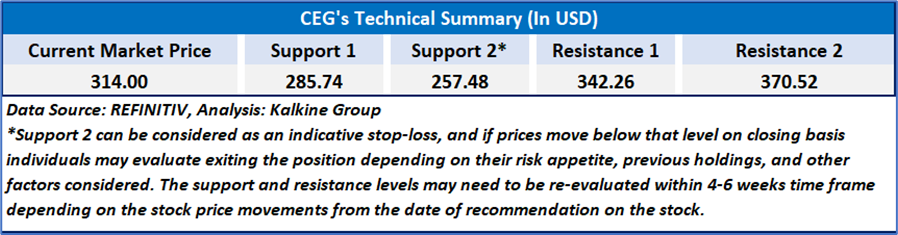
Support: A level at which the stock prices tend to find support if they are falling, and a downtrend may take a pause backed by demand or buying interest. Support 1 refers to the nearby support level for the stock and if the price breaches the level, then Support 2 may act as the crucial support level for the stock.
Resistance: A level at which the stock prices tend to find resistance when they are rising, and an uptrend may take a pause due to profit booking or selling interest. Resistance 1 refers to the nearby resistance level for the stock and if the price surpasses the level, then Resistance 2 may act as the crucial resistance level for the stock.
Stop-loss: It is a level to protect against further losses in case of unfavorable movement in the stock prices.
Past performance is not a reliable indicator of future performance.

 NZ
 UK
 US
 AU
 IND

 CA

 Please wait processing your request...