Section 1: Company Overview and Fundamentals
1.1 Company Overview:
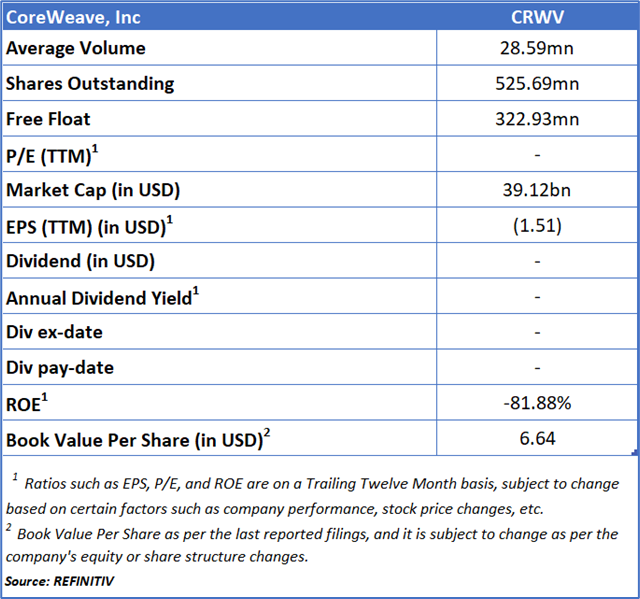
CoreWeave, Inc (NASDAQ: CRWV) is a cloud infrastructure technology company that provides the CoreWeave Cloud Platform, an integrated solution designed to support complex artificial intelligence workloads such as model training and inference. The platform combines infrastructure, managed software, and application software services to deliver high-performance computing capabilities. Its offerings include GPU and CPU compute resources, advanced networking, and storage infrastructure, along with managed services such as Kubernetes-based virtual private cloud environments and bare-metal computing, enabling customers to efficiently develop, deploy, and scale AI applications.
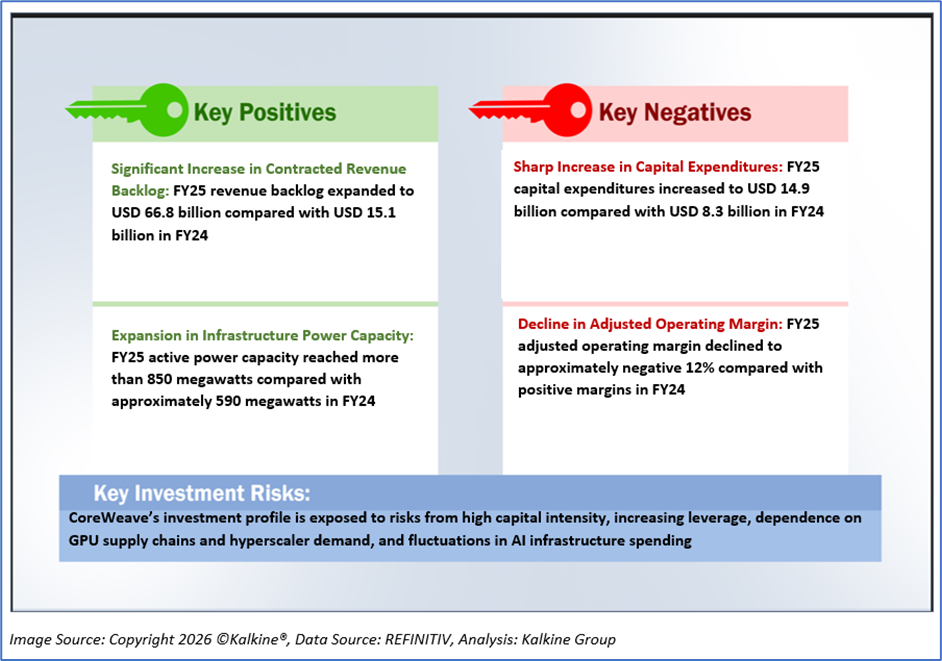
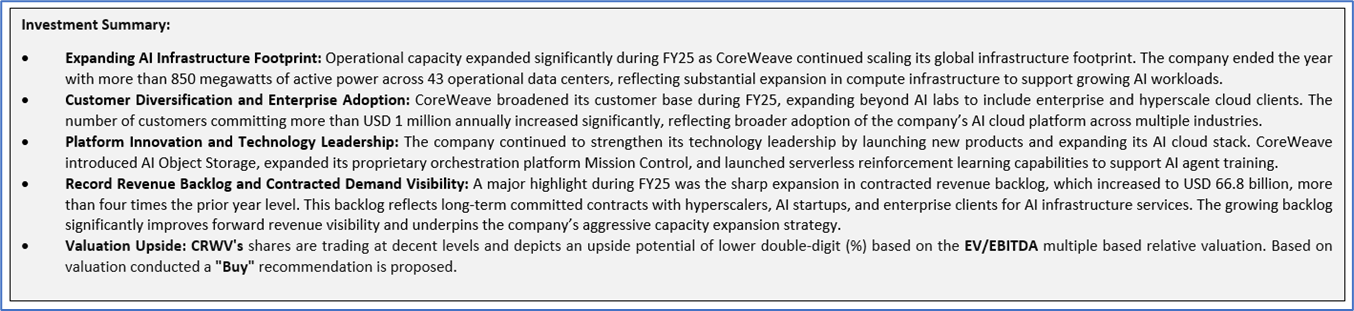
Kalkine’s American Tech Report covers the Company Overview, Key positives & negatives, Investment summary, Key investment metrics, Top 10 shareholding, Business updates and insights into company recent financial results, Key Risks & Outlook, Price performance and technical summary, Target Price, and Recommendation on the stock.
Price Performance:
- The stock is currently trading around USD 74.41, remaining below both the 20-day moving average (USD 88.53) and the 50-day moving average (USD 87.68), indicating weak short-term momentum.
- After reaching a high near USD 187, the price entered a prolonged correction and has since been moving within a broad consolidation range.
- The Relative Strength Index (RSI) near 34 suggests weakening momentum and places the stock close to the oversold zone, which could limit further downside in the near term.
- Volume spikes during recent declines indicate periods of distribution, reflecting cautious market sentiment.
1.2 The Key Positives, Negatives, and Investment summary
1.3 Top 10 shareholders:
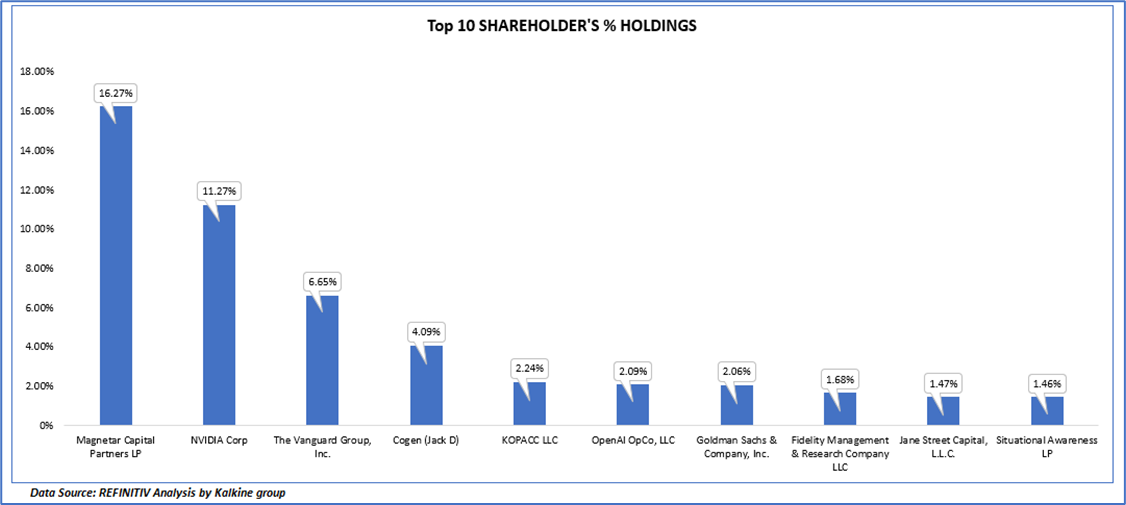
The top 10 shareholders together form ~49.27% of the total shareholding, signifying concentrated shareholding. Magnetar Capital Partners LP and NVIDIA Corp are the biggest shareholders, holding the maximum stake in the company at ~16.27% and ~11.27%, respectively.
1.4 Key Metrics:
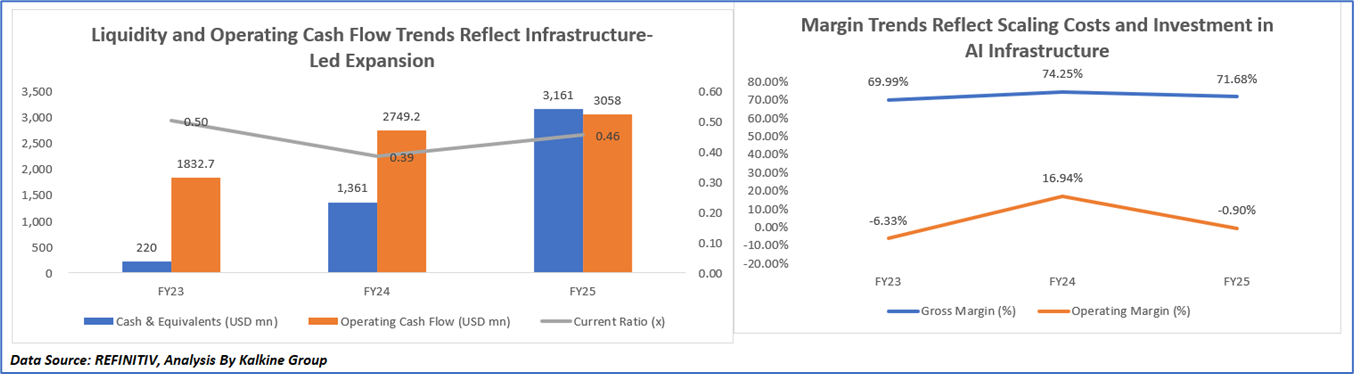
1) Liquidity and Operating Cash Flow Trends Reflect Infrastructure-Led Expansion
CoreWeave’s liquidity trajectory highlights evolving liquidity position alongside improving operating cash generation during its rapid AI infrastructure expansion. Cash and cash equivalents increased significantly from USD 220 million in FY23 to USD 1,361 million in FY24 and further to USD 3,161 million in FY25, largely supported by capital-raising activities and financing initiatives undertaken to fund large-scale GPU clusters and data center deployments. At the same time, operating cash flow strengthened from USD 1,832.7 million in FY23 to USD 2,749.2 million in FY24 and USD 3,058 million in FY25, reflecting strong revenue growth and rising demand for AI cloud infrastructure from hyperscalers, AI labs, and enterprise clients. However, the current ratio declined from 0.50x in FY23 to 0.39x in FY24 before recovering slightly to 0.46x in FY25, indicating elevated working capital requirements and higher short-term obligations associated with infrastructure expansion. Overall, the trend reflects a company operating in a capital-intensive growth phase, where strong operating cash generation and increased funding are being deployed to scale AI compute capacity while gradually strengthening liquidity
2) Margin Trends Reflect Scaling Costs and Investment in AI Infrastructure
The profitability chart illustrates CoreWeave’s margin dynamics during its rapid expansion in AI cloud infrastructure. Gross margin remained relatively stable, improving from 69.99% in FY23 to 74.25% in FY24, before moderating slightly to 71.68% in FY25, reflecting strong pricing power for GPU-based computing services and efficient utilization of infrastructure as demand for AI workloads increased. In contrast, operating margin moved from negative 6.33% in FY23 to positive 16.94% in FY24, driven by strong revenue growth and improved operating leverage as the platform scaled. However, it declined again to negative 0.90% in FY25, primarily due to higher operating expenses associated with accelerated data center deployments, infrastructure expansion, and investments in sales, marketing, and engineering capabilities. Meanwhile, net margin improved significantly from negative 259.37% in FY23 to negative 45.08% in FY24 and further to negative 22.74% in FY25, reflecting substantial revenue growth and improving operating efficiency, although profitability remains constrained by rising interest expenses and depreciation linked to debt-funded infrastructure investments. Overall, the trend indicates a company transitioning through a heavy investment phase, where strong gross profitability is partially offset by elevated operating and financing costs required to scale AI computing capacity.
Section 2: Business Updates and Financial Highlights
2.1 Recent Updates:
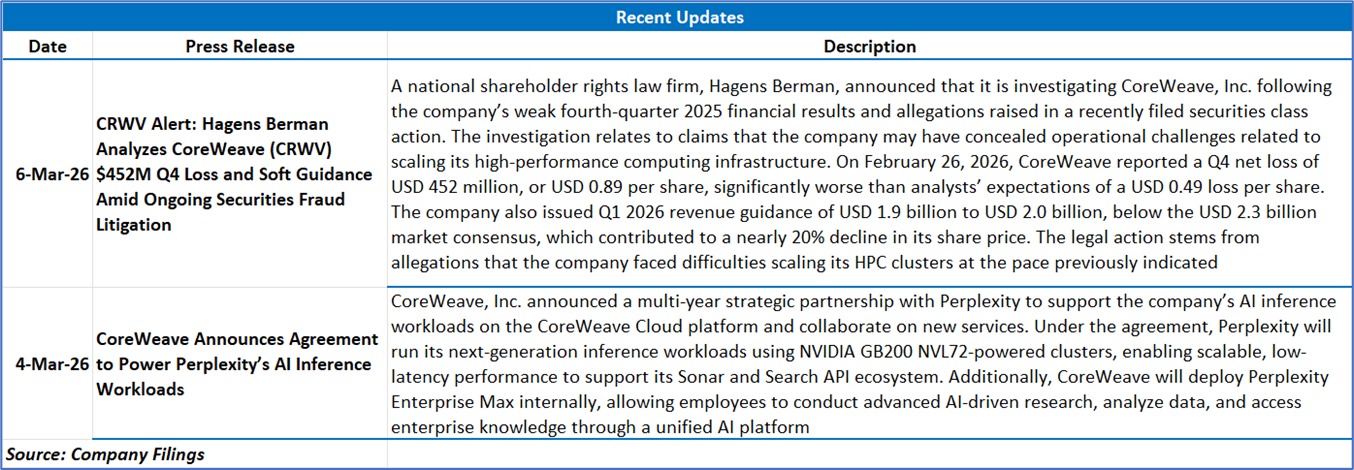
The below picture gives an overview of the recent updates:
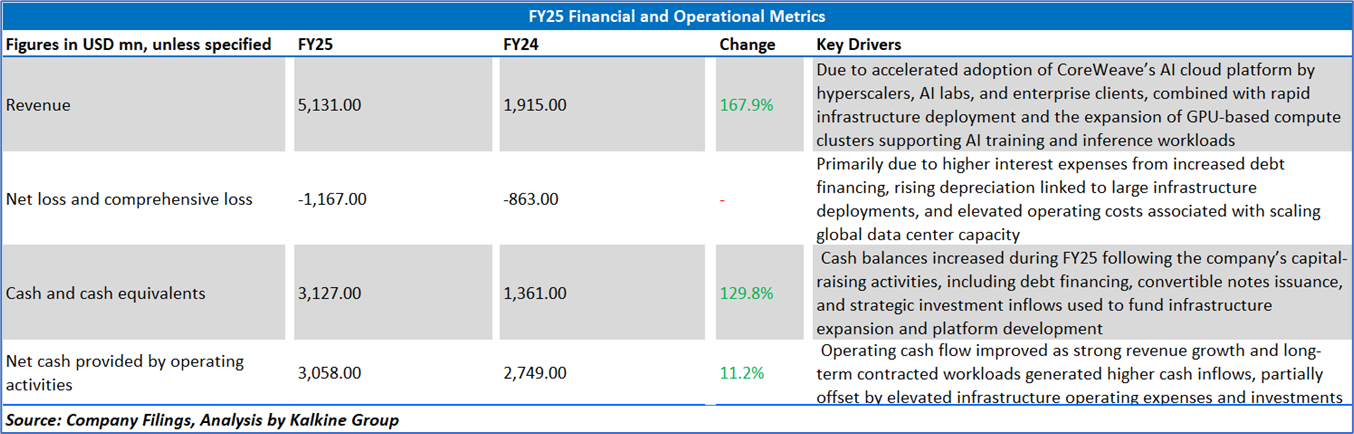
2.2 Insights of FY25:
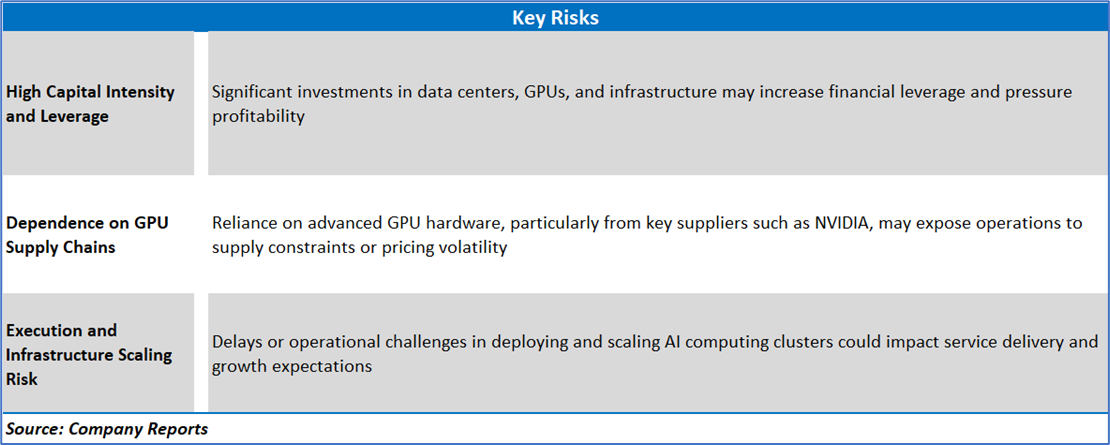
Section 3: Key Risks and Outlook:
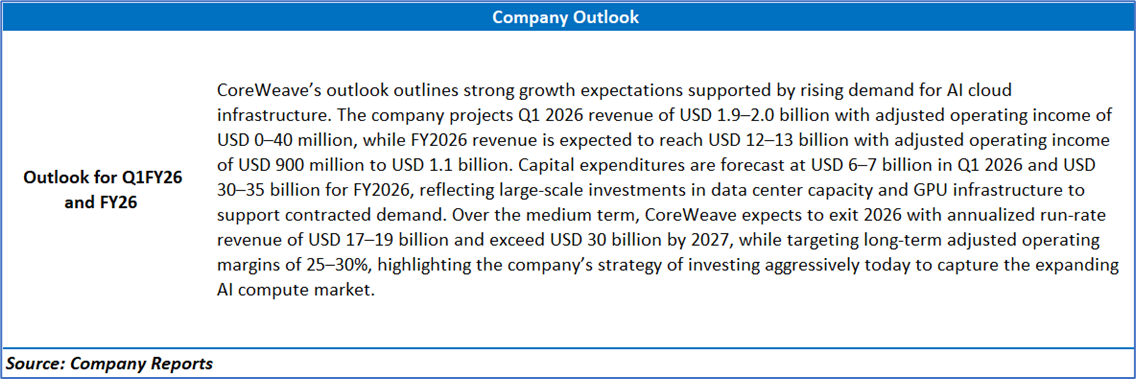
Section 4: Stock Recommendation Summary:
4.1 Technical Summary:
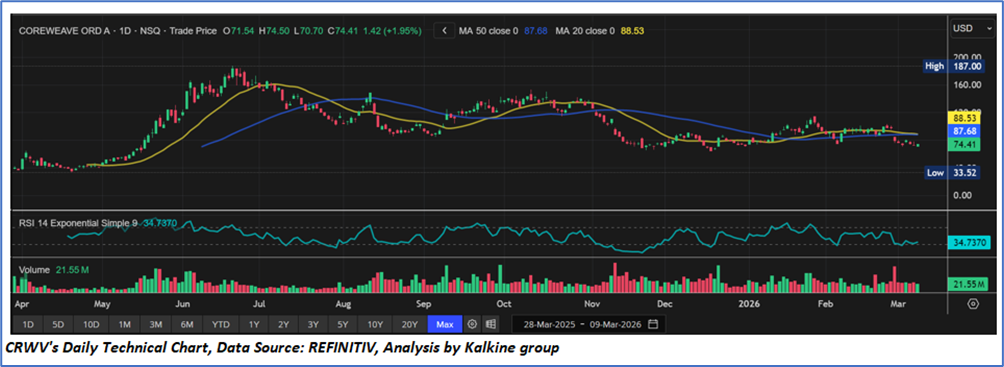
Price Performance:
- The stock is currently trading around USD 74.41, remaining below both the 20-day moving average (USD 88.53) and the 50-day moving average (USD 87.68), indicating weak short-term momentum.
- After reaching a high near USD 187, the price entered a prolonged correction and has since been moving within a broad consolidation range.
- The Relative Strength Index (RSI) near 34 suggests weakening momentum and places the stock close to the oversold zone, which could limit further downside in the near term.
- Volume spikes during recent declines indicate periods of distribution, reflecting cautious market sentiment.
4.2 Fundamental Valuation
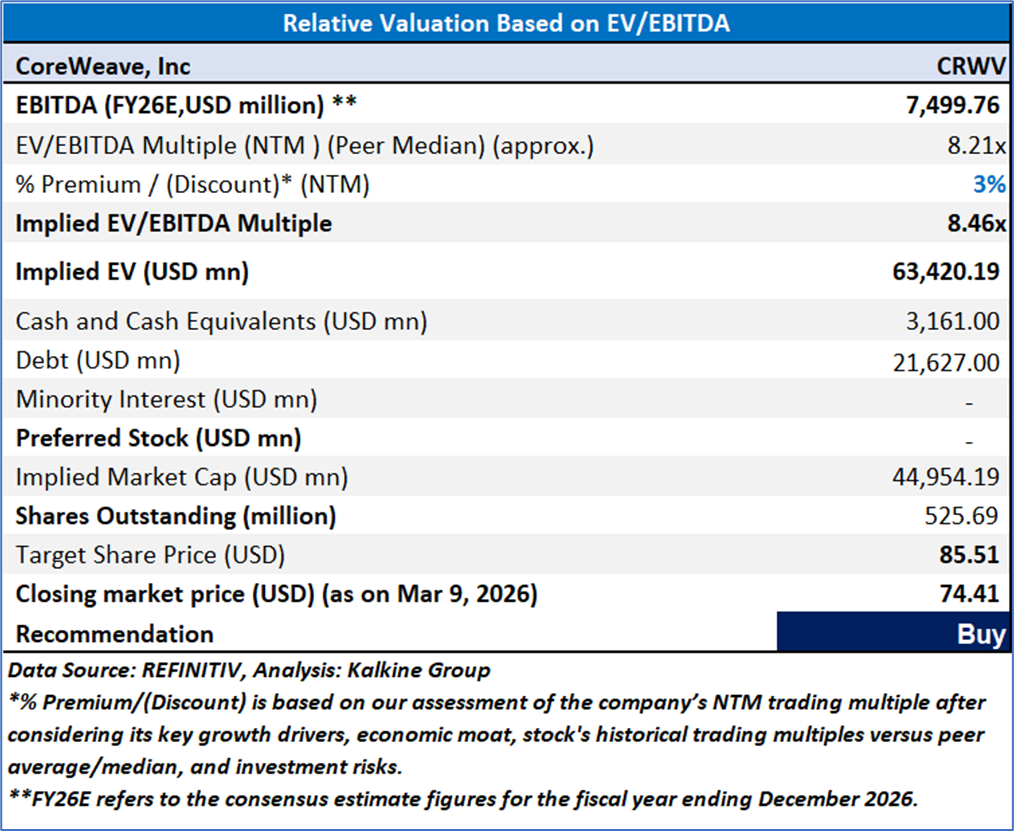
Valuation Methodology: Enterprise Value/EBITDA Multiple Based Relative Valuation
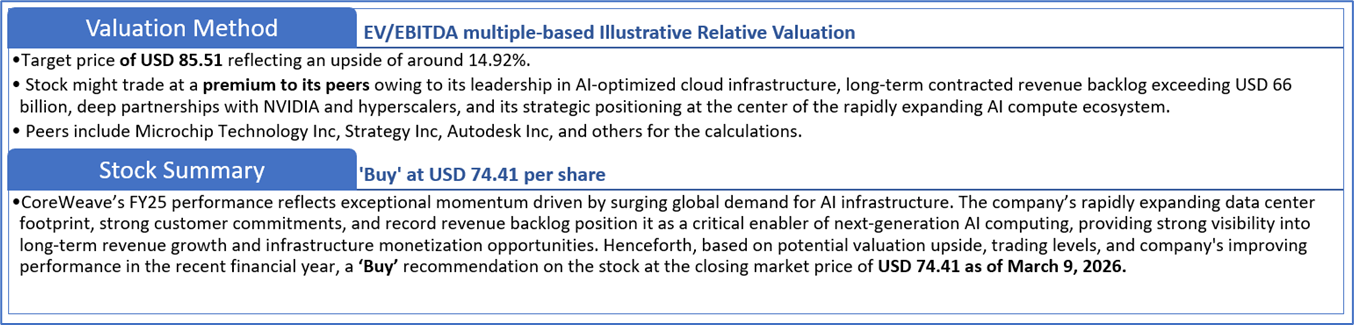
Markets are trading in a highly volatile zone currently due to certain macroeconomic issues and geopolitical tensions prevailing. Therefore, it is prudent to follow a cautious approach while investing.
Note 1: Past performance is not a reliable indicator of future performance.
Note 2: The reference date for all price data, currency, technical indicators, support, and resistance levels is March 09, 2026. The reference data in this report has been partly sourced from REFINITIV.
Note 3: Investment decisions should be made depending on an individual's appetite for upside potential, risks, holding duration, and any previous holdings. An 'Exit' from the stock can be considered if the Target Price mentioned as per the Valuation and or the technical levels provided has been achieved and is subject to the factors discussed above.
Note 4: The report publishing date is as per the Pacific Time Zone.
Technical Indicators Defined: -
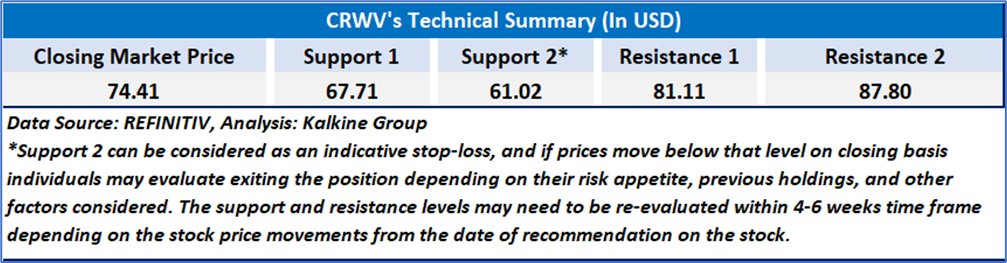
Support: A level at which the stock prices tend to find support if they are falling, and a downtrend may take a pause backed by demand or buying interest. Support 1 refers to the nearby support level for the stock and if the price breaches the level, then Support 2 may act as the crucial support level for the stock.
Resistance: A level at which the stock prices tend to find resistance when they are rising, and an uptrend may take a pause due to profit booking or selling interest. Resistance 1 refers to the nearby resistance level for the stock and if the price surpasses the level, then Resistance 2 may act as the crucial resistance level for the stock.
Stop-loss: It is a level to protect against further losses in case of unfavorable movement in the stock prices.
Past performance is not a reliable indicator of future performance.

 NZ
 UK
 US
 AU
 IND

 CA

 Please wait processing your request...