Section 1: Company Overview and Fundamentals
1.1 Company Overview:
Coterra Energy Inc (NYSE: CTRA) is a U.S.-focused exploration and production company engaged in the development of oil, natural gas, and natural gas liquids across key shale basins. Its core operations span the Permian Basin, Marcellus Shale, and Anadarko Basin, with a strong acreage position supporting diversified production. The Company emphasizes development in resource-rich formations such as the Wolfcamp and Bone Spring in the Permian, the dry gas window in the Marcellus, and the Woodford and Meramec formations in the Anadarko Basin.
Kalkine’s Diversified Opportunities Report covers the Company Overview, Key positives & negatives, Investment summary, Key investment metrics, Top 10 shareholding, Business updates and insights into company recent financial results, Key Risks & Outlook, Price performance and technical summary, Target Price, and Recommendation on the stock.
Stock Performance:
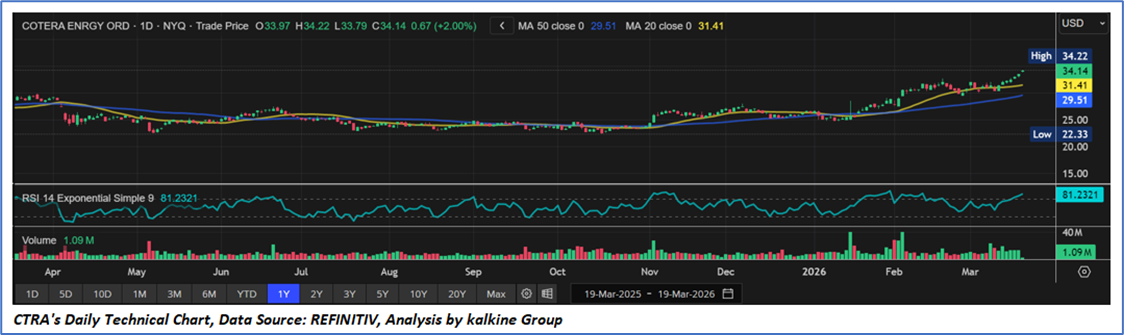
- The stock is exhibiting a clear higher-high, higher-low pattern, indicating sustained bullish momentum following a prolonged consolidation phase.
- Prices are trading above both the 20-day moving average (USD 31.41) and the 50-day moving average (USD 29.51), reinforcing a positive short- to medium-term trend.
- The recent move toward the USD 34–35 range is supported by rising volumes, suggesting accumulation-driven buying interest rather than short-term speculation.
- RSI is elevated near 81, indicating overbought conditions and increasing the likelihood of near-term consolidation or a mild pullback.
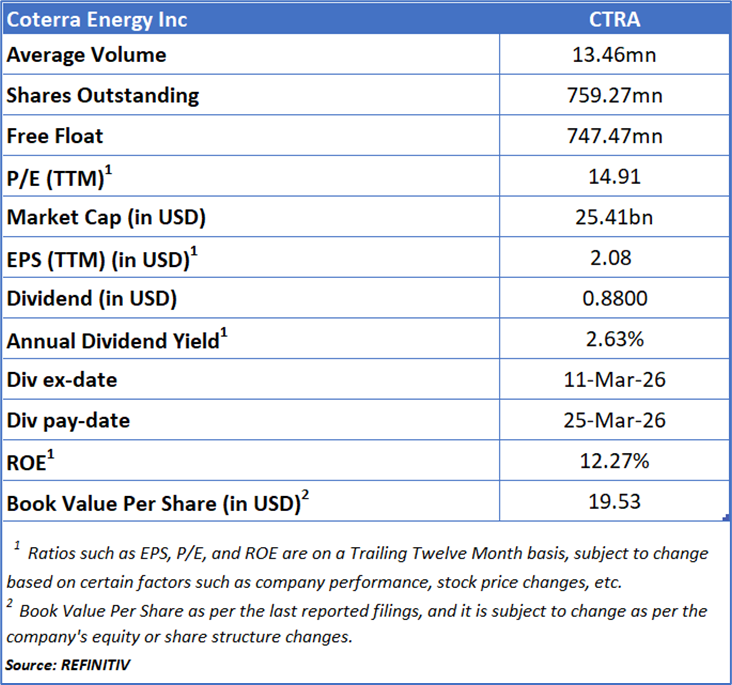
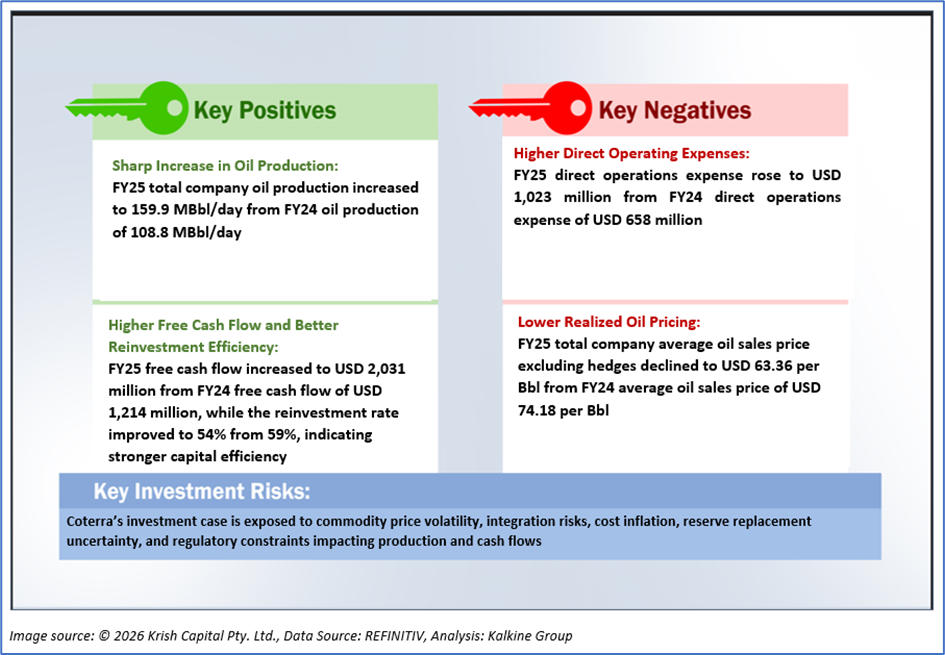
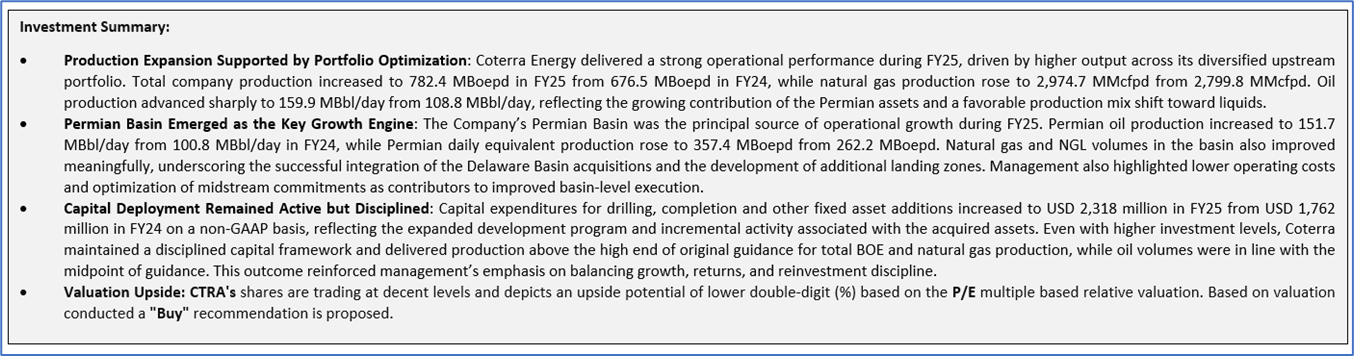
1.2 The Key Positives, Negatives, and Investment summary
1.3 Top 10 shareholders:
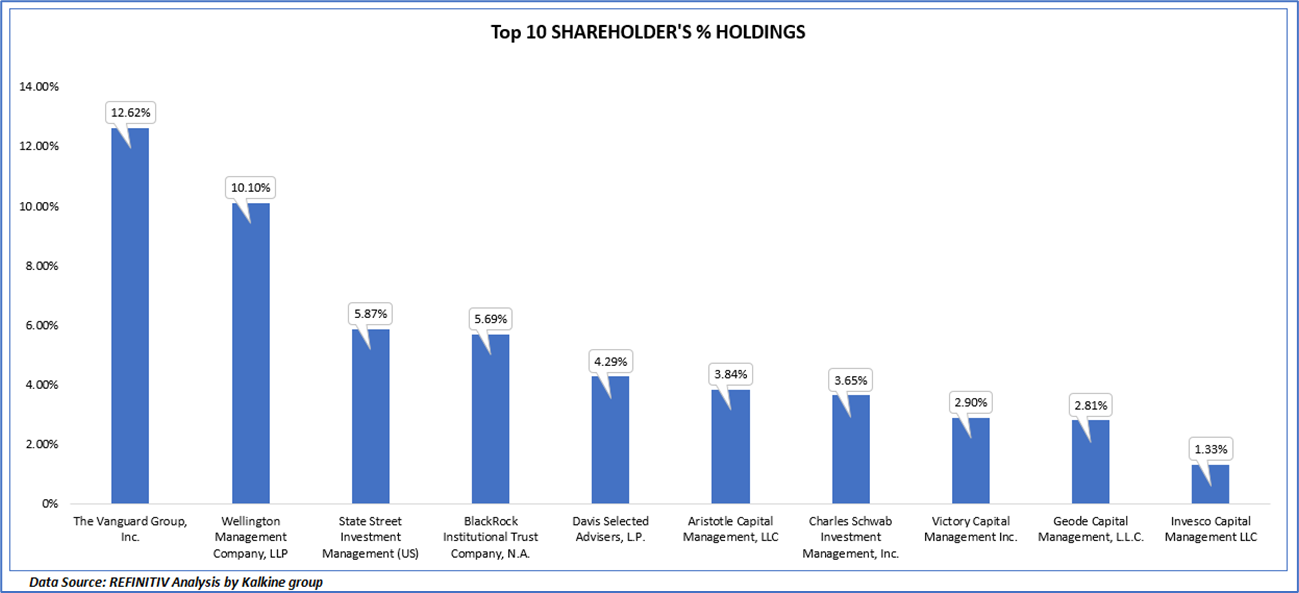
The top 10 shareholders together form ~ 53.09% of the total shareholding, signifying concentrated shareholding. The Vanguard Group, Inc. and Wellington Management Company, LLP are the biggest shareholders, holding the maximum stake in the company at 12.62% and 10.10%, respectively.
1.4 Key Metrics:
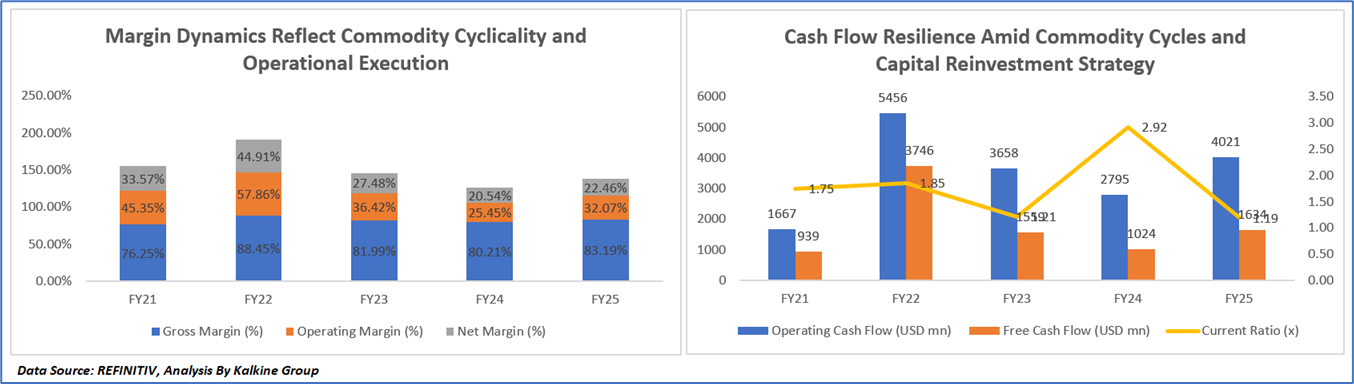
Margin Dynamics Reflect Commodity Cyclicality and Operational Execution
Coterra’s margin trajectory over the period reflects the interplay between commodity price cycles, production mix, and cost dynamics. Margins expanded significantly in FY22, supported by elevated oil and natural gas prices and strong operating leverage, before moderating in FY23 as commodity prices—particularly natural gas—normalized, weighing on realizations. The downward pressure extended into FY24, driven by continued gas price weakness and rising operating costs, including higher transportation and depreciation expenses associated with increased development activity and portfolio adjustments. However, FY25 witnessed a partial recovery in margins, supported by higher production volumes, a more favorable liquids mix, and derivative gains, which helped offset cost inflation. Overall, the trend underscores the Company’s sensitivity to commodity cycles, while also highlighting the stabilizing impact of its diversified asset base and disciplined operational execution.
Cash Flow Resilience Amid Commodity Cycles and Capital Reinvestment Strategy
Coterra’s operating cash flow, free cash flow, and current ratio trends illustrate the impact of commodity price cycles alongside disciplined capital allocation and balance sheet management. Cash flows surged in FY22 due to elevated oil and natural gas prices, driving strong revenue realization and free cash generation. This momentum moderated in FY23 as natural gas prices weakened, reducing cash inflows despite stable production. The softness extended into FY24, where continued pricing pressure and sustained capital expenditures weighed on cash flows, although liquidity improved due to prudent working capital management and a conservative balance sheet. In FY25, cash flows rebounded on higher production—particularly oil—and favorable derivative gains, while the current ratio declined as the company deployed liquidity toward capital investments, shareholder returns, and strategic initiatives. Overall, the trend underscores Coterra’s sensitivity to pricing cycles while highlighting its ability to maintain financial flexibility through disciplined execution.
Section 2: Business Updates and Corporate Business Highlights
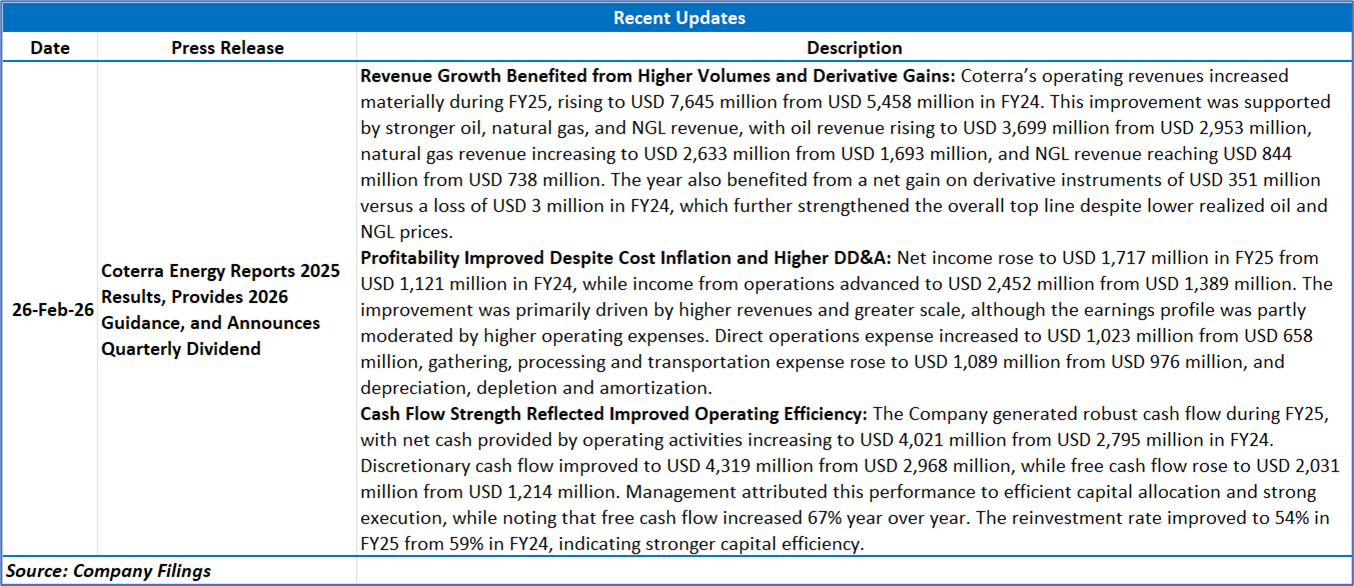
2.1 Recent Business Updates
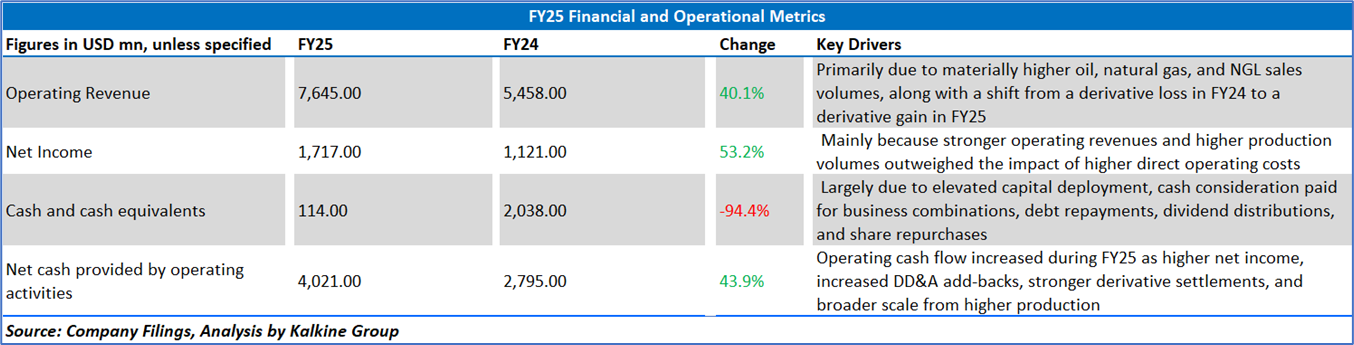
2.2 Insights of FY25:
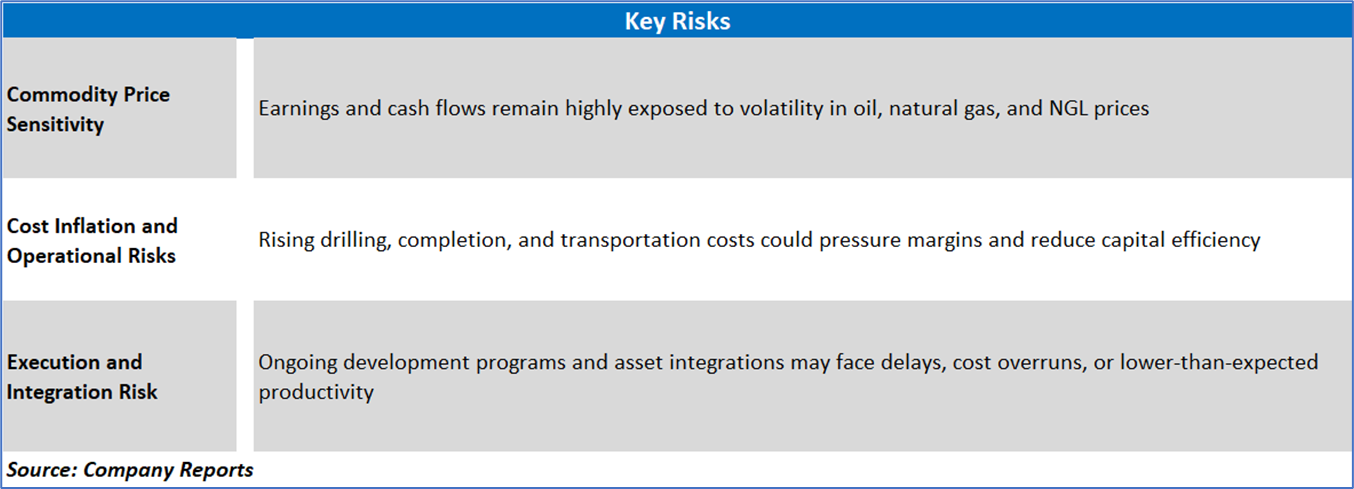
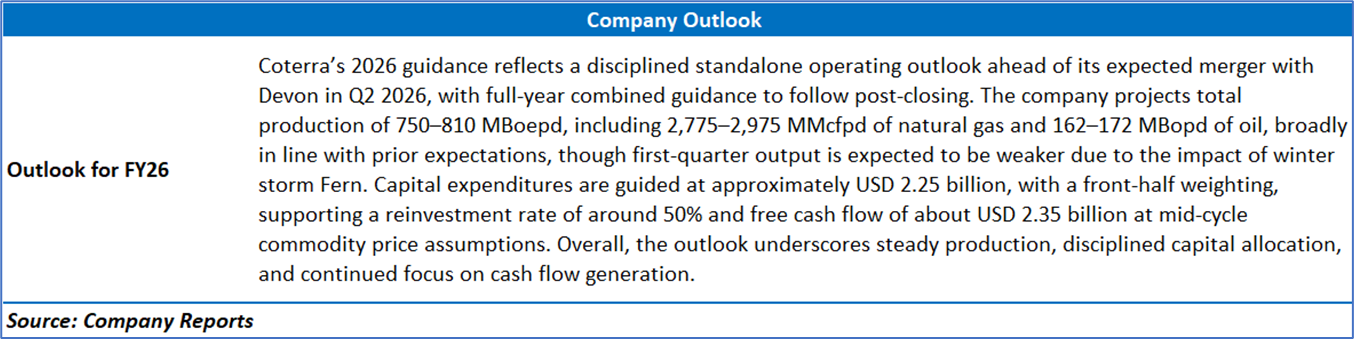
Section 3: Key Risks & Outlook
Section 4: Stock Recommendation Summary:
4.1 Price Performance and Technical Summary:
Stock Performance:
- Strong Uptrend Structure: The stock is exhibiting a clear higher-high, higher-low pattern, indicating sustained bullish momentum following a prolonged consolidation phase.
- Moving Average Support: Prices are trading above both the 20-day moving average (USD 31.41) and the 50-day moving average (USD 29.51), reinforcing a positive short- to medium-term trend.
- Breakout with Volume Support: The recent move toward the USD 34–35 range is supported by rising volumes, suggesting accumulation-driven buying interest rather than short-term speculation.
- Overbought Momentum Indicator: RSI is elevated near 81, indicating overbought conditions and increasing the likelihood of near-term consolidation or a mild pullback.
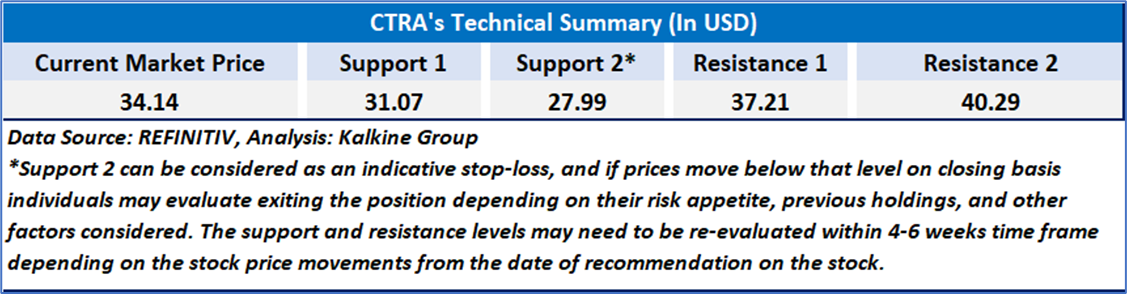
- Key Resistance Level: Immediate resistance is positioned around USD 34.2–35, where price action may face near-term selling pressure.
- Support Zones to Watch: Initial support lies near USD 31.4 (20-day MA), followed by stronger support around USD 29.5 (50-day MA).
4.2 Fundamental Valuation
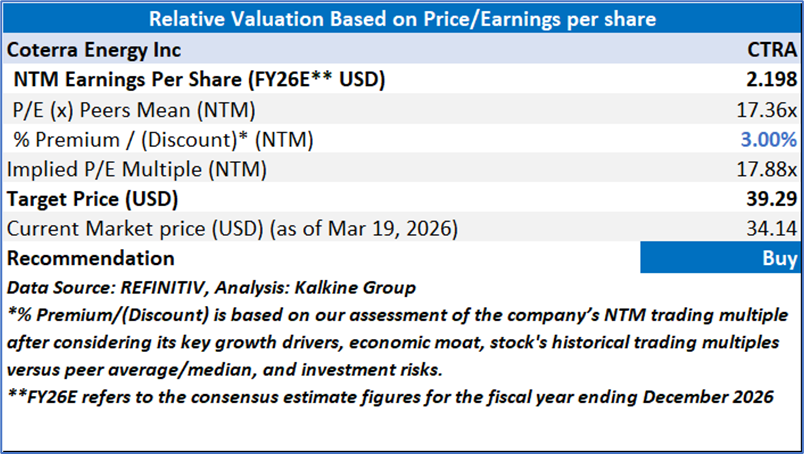
Valuation Methodology: Price/Earnings Multiple Based Relative Valuation
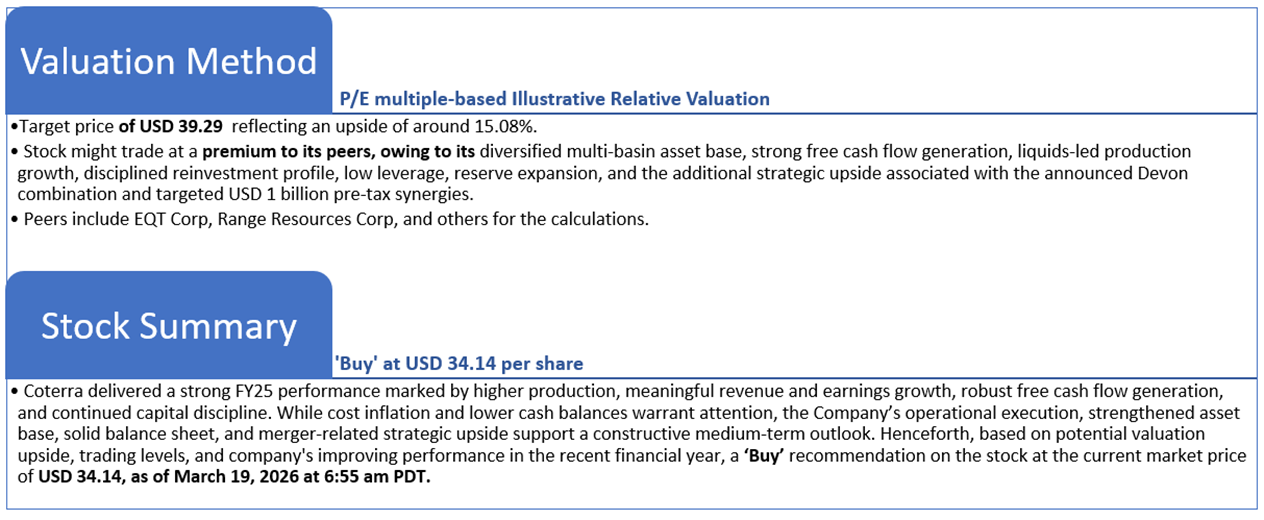
Markets are trading in a highly volatile zone currently due to certain macroeconomic issues and geopolitical tensions prevailing. Therefore, it is prudent to follow a cautious approach while investing.
Note 1: Past performance is not a reliable indicator of future performance.
Note 2: The reference date for all price data, currency, technical indicators, support, and resistance levels is March 19, 2026. The reference data in this report has been partly sourced from REFINITIV.
Note 3: Investment decisions should be made depending on an individual's appetite for upside potential, risks, holding duration, and any previous holdings. An 'Exit' from the stock can be considered if the Target Price mentioned as per the Valuation and or the technical levels provided has been achieved and is subject to the factors discussed above.
Note 4: The report publishing date is as per the Pacific Time Zone.
Technical Indicators Defined: -
Support: A level at which the stock prices tend to find support if they are falling, and a downtrend may take a pause backed by demand or buying interest. Support 1 refers to the nearby support level for the stock and if the price breaches the level, then Support 2 may act as the crucial support level for the stock.
Resistance: A level at which the stock prices tend to find resistance when they are rising, and an uptrend may take a pause due to profit booking or selling interest. Resistance 1 refers to the nearby resistance level for the stock and if the price surpasses the level, then Resistance 2 may act as the crucial resistance level for the stock.
Stop-loss: It is a level to protect against further losses in case of unfavorable movement in the stock prices.
Past performance is not a reliable indicator of future performance.

 NZ
 UK
 US
 AU
 IND

 CA

 Please wait processing your request...