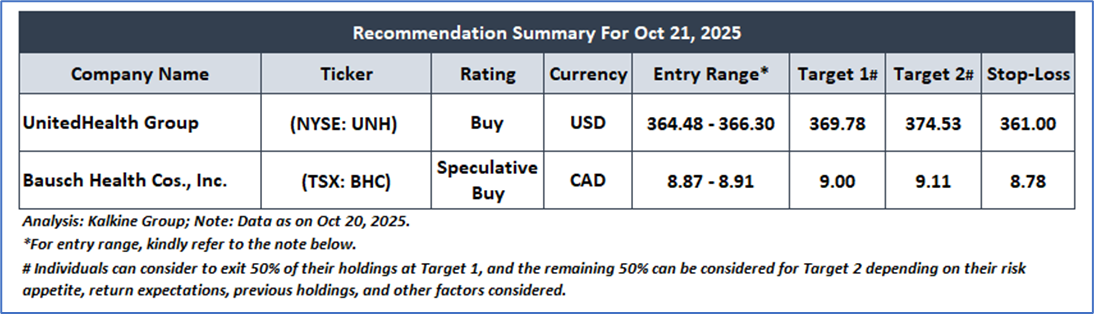
Company Overview: UnitedHealth Group (NYSE: UNH) is a healthcare and wellness company focused on advancing individual health and improving the efficiency of the broader health system, operating through two integrated and complementary business segments. Bausch Health Cos., Inc. (TSX: BHC) engages in the development, manufacture and market of a range of branded, generic and branded generic pharmaceuticals, medical devices and over-the-counter products.
This Report covers the Price Action, Technical Indicators Analysis along with the Target Levels, Stop Loss Level, and Recommendations on these two stocks.

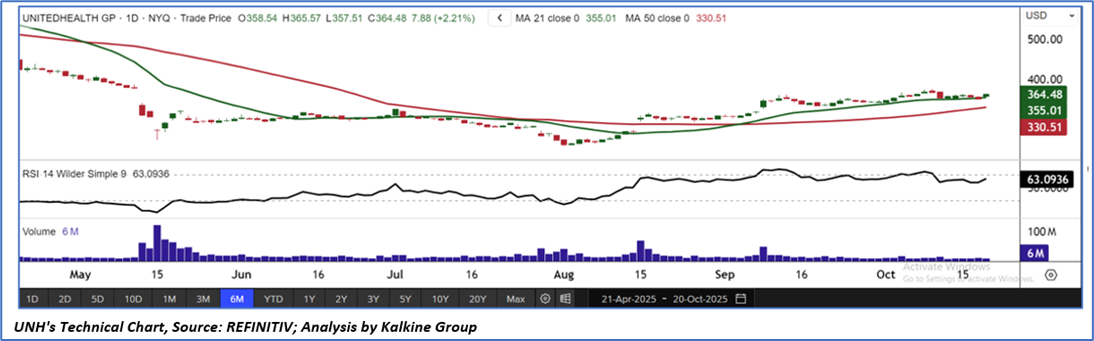
UNH’s Technical Observation
UNH's stock price is holding strong support at key levels, indicating a possible short-term upward trend. The 14-period RSI stays above the midpoint, reflecting growing buying momentum. Moreover, the stock is trading above its major moving averages, further supporting the overall bullish outlook.
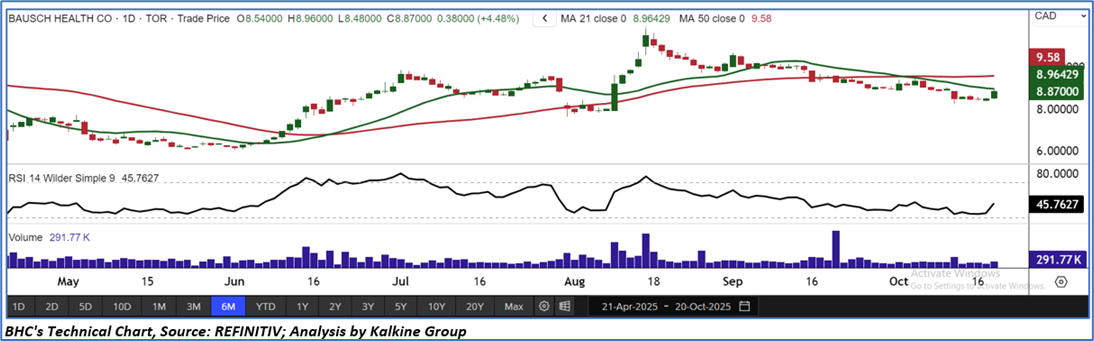
BHC’s Technical Observation
BHC's stock price is firmly supported at key levels, suggesting a possible short-term upward movement. The 14-period RSI moving toward the midpoint, indicating increasing buying momentum. Additionally, the stock is nearing a potential rebound to its 21-period simple moving average, which, once achieved, could attract even more buyers.
Markets are trading in a highly volatile zone currently due to certain macroeconomic issues and prevailing geopolitical tensions. Therefor it is prudent to follow a cautious approach while investing.
Related Risks: This report may be looked at from a high-risk perspective, and recommendations are provided only for day trading purposes. Recommendations provided in this report are solely based on technical parameters, and the fundamental performance of the stocks has not been considered in the decision-making process. Other factors which could impact stock prices include market risks, regulatory risks, interest rates risks, currency risks, social and political instability risks etc.
Note 1: Entry Range: For the given recommendation(s), the Entry Range is based on considering a certain range (0.5% - 2%) above (in speculative buy case) or below (in sell case) of the previous day close price. A recommendation will be considered void if the prices do not test the given range levels for the particular day.
Note 2: This report's recommendation(s) is purely for day trading purposes and position(s) will be considered closed automatically at the close price of the day in case no target or stop loss level is hit. It is advisable to follow the targets and stop-loss levels strictly and exit the position accordingly, as it may lead to limitless loss if the position is not taken care of with due diligence.
How to Read the Charts?
The green colour line reflects the 21-period moving average, while the red line indicates the 50- period moving average. SMA helps to identify existing price trends. If the prices are trading above the 21-period and 50-period moving averages, then it shows prices are currently trading in a bullish trend.
The black colour line in the chart’s lower segment reflects the Relative Strength Index (14-Period), which indicates the strength of the price trend. A reading above 50 indicates a positive momentum, while below 50 indicates a negative momentum. A reading of 70 or above suggests overbought status, while a reading of 30 or below suggests an oversold status.
The blue bars in the chart’s lower segment show the volume of the stock. The volume is the number of shares that changed hands during a given day. Stocks with high volumes are more liquid than stocks with lesser volumes, and higher liquidity in stocks helps in easier and faster execution of the order.
Stop-loss: It is a level to protect further losses in case of unfavorable movement in the stock prices.
The reference date for all price data, currency, technical indicators, support, and resistance levels as on October 20, 2025. The reference data in this report has been partly sourced from REFINITIV.
Abbreviations
CMP: Current Market Price
SMA: Simple Moving Average
RSI: Relative Strength Index
USD: United States dollar
CAD: Canadian dollar
Note: Trading decisions require a thorough analysis by individuals. The technical analysis reports generally chart out metrics that individuals may assess before any stock evaluation. The above are illustrative analytical factors used for evaluating the stocks; other parameters can be looked at along with additional risks per se. Past performance is neither an indicator nor a guarantee of future performance.
Past performance is not a reliable indicator of future performance.
 Please wait processing your request...